
The success in trading depends on how investors find the technical outlook of a particular asset. The technical analysis enables traders to determine the potentially profitable trading positions by observing the market context differently. The tweezer is one of the coolest, most effective, and most competent to catch profitable trades with low risks among several technical patterns.
However, the tweezer pattern involves multiple candlesticks to complete formation, and functionality is also different depending on appearance. This article describes the tweezer pattern with chart attachments, besides listing pros and cons.
What are tweezer top and tweezer bottom patterns?
These patterns complete formation with multi candles. Both buy and sell candles combine to complete the formation of this pattern. Meanwhile, this unique pattern signals trend reversal by appearing at the finish line of any trend. Two types of tweezer patterns are available.
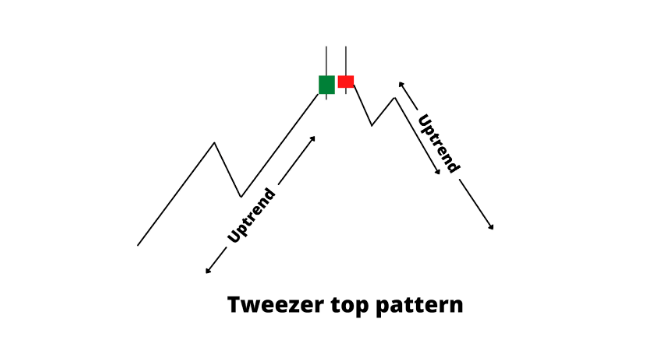
Tweezer top
It occurs at the finish line of an uptrend or swing high position, signaling a possible declining pressure on the asset price. A bullish candle at a bullish swing high with a green body declares a fine bullish movement on the asset price.
On the next day, buyers lose interest, and the price usually starts to decline after forming the tweezer top. So the formation contains a bullish candle first, then a bearish candle, and both will occur at any high swing level.
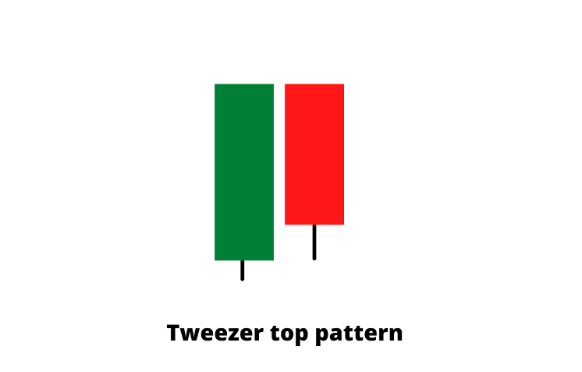
Identify the the pattern is similar to the figure below shows.
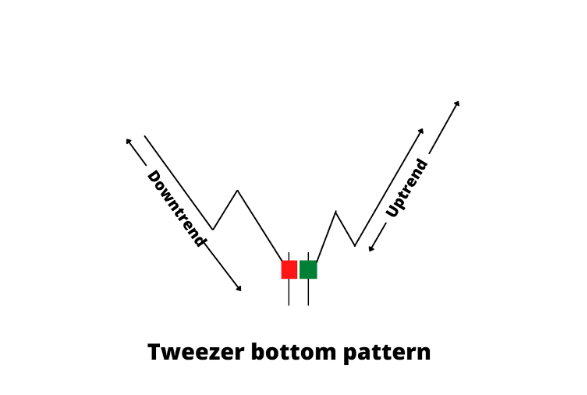
Tweezer bottom
This is also a combination of two-price candles, but in this case, it will look like the negative version of the tweezer top. Candle one is bearish and declares fine sell movement on the asset price.
The next day, sellers lose interest, and the price starts to move upside on buying pressure after the tweezer bottom formation completes. This pattern usually occurs at the finish line of a downtrend or low swing position, signaling a possible upcoming bullish pressure on the asset price. 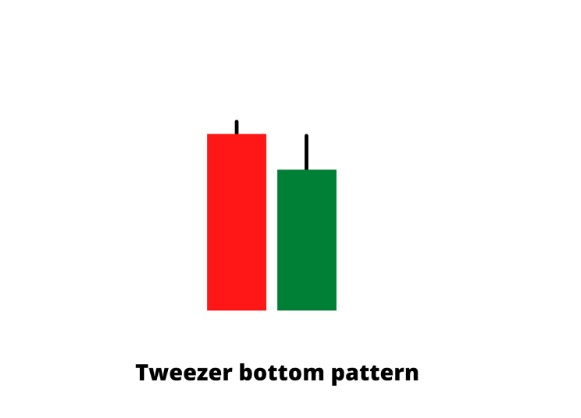
Identify the pattern is similar to the figure below shows.
How to trade using these patterns?
When you want to trade using these patterns, you can do it by simply determining the swing high/low levels on a nacked chart. These patterns generate strong trade signals appearing near the finish line of the current trend. Any trading using tweezer top or bottom can complete by following steps.
Step one
In the first step, look at the market trend; you should determine the area of interest where investors may seek to buy or sell. The demand or supply zones of the target asset, where a reversal may occur depending on significant buy/sell pressure on the asset price.
Step two
On the next step, wait till any tweezer pattern takes place and the reaction on that level. Confirm that the level is a reversal zone, then place buy/sell orders depending on the reaction and pattern type.
Step three
It is the last step after the execution of trading positions. After placing orders, set the profit target near the next support resistance level. You can close trades manually or wait till the TP gets hit by the price movement.
These are the simple concepts of using tweezer patterns to create complete trading techniques. You can use this pattern to trade at a nacked chart. Otherwise, many traders and investors use several indicators such as MACD, MA crossover, parabolic SAR, RSI, ADX, etc., to generate more precious trading positions.
Executing trades using tweezer patterns
We use support resistance and a popular technical indicator MACD besides tweezer patterns to generate trade ideas. In this way, it becomes easy to make trading decisions. This strategy works fine on any time frame chart you want to trade.
Still, we recommend using hourly or above charts to eliminate fake swing high/low levels, as it is essential to determine swing levels when you use tweezer patterns to execute trades.
Bullish trade scenario
When you seek buying opportunities, mark the tweezer bottom at the end of any downtrend price movement near any support level. After the tweezer bottom formation, look at the MACD window:
- The dynamic blue line crosses the dynamic red line on the upside.
- MACD green histogram bars take place above the central (0.0) line.
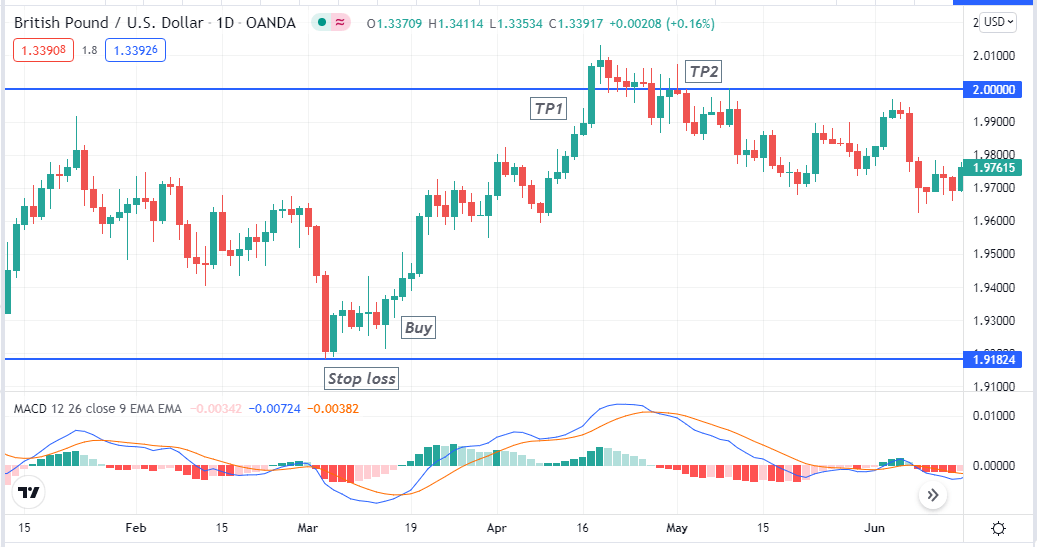
Bullish setup
Entry
Match these conditions above with your target asset chart and place a buy order.
Stop-loss
Set an initial stop loss below the tweezer bottom formation with a buffer of 10-15pips.
Take profit
The primary profit target will be below the nearest resistance. Otherwise, close the buy position when:
- The dynamic blue line crosses the dynamic red line on the downside.
- MACD red histogram bars take place below the central (0.0) line.
Bearish trade scenario
When you seek selling opportunities, mark the tweezer top at the end of an uptrend price movement near any resistance level. After the tweezer top pattern formation, look at the MACD window:
- The dynamic blue line crosses the dynamic red line on the downside.
- MACD red histogram bars take place below the central (0.0) line.
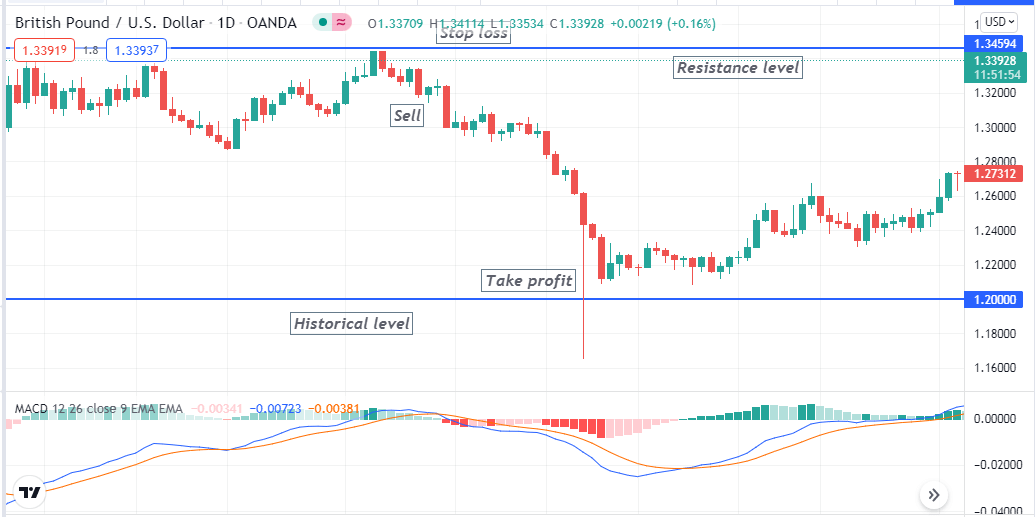
Bearish setup
Entry
Match these conditions above with your target asset chart and place a sell order.
Stop-loss
Set an initial stop loss above the tweezer top formation with a buffer of 10-15pips.
Take profit
The primary profit target will be above the nearest support. Otherwise, close the sell position when:
- The dynamic blue line crosses the dynamic red line on the upside.
- MACD green histogram bars take place above the central (0.0) line.
Pros and cons
| 👍 Pros | 👎 Cons |
|
|
|
|
|
|
Final thought
Finally, tweezer patterns are standard, reliable candle formation to determine possible reversal. We suggest avoiding trading with this pattern during significant news releases. Practice demo trading to check the potentiality of these patterns before using these patterns on live trading.


Comments