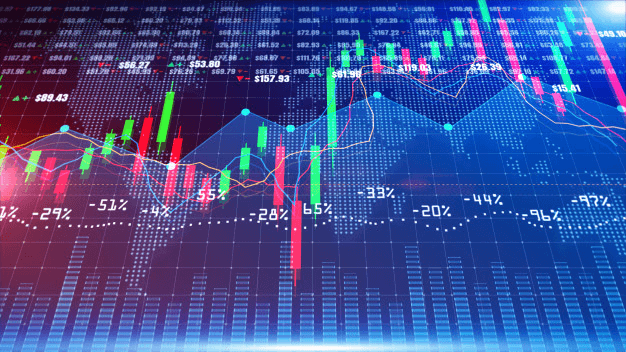
When price moves either uptrend or downtrend in the forex market, it appears at the chart visually with candlesticks. It is one of the chart types to represent the price movement. The candlesticks evolved in Japan more than 100 years before the bar and the west developed the point-and-figure charts. Investors across the world use these patterns for technical type analysis to predict the future price for centuries.
Nowadays, they have become essential tools, and traders must have strong knowledge about them. Let’s see the complete candlestick guide that will help you to build a strong trading career.
What is the candlestick?
Back in the 1700s, Homma, a Japanese man, discovered a close connection between the supply-demand and the price of rice. The emotions of traders have a strong influence on the price of a particular product. The candlesticks are simply the visual representation of traders’ emotions/sentiments. That shows the price movement by different colors and candle types. So each color represents a different phase of price movement. Simply the pattern is divided into two kinds, bullish and bearish.
The nature of the candlestick helps in understanding the psychology of traders, which is an essential aspect of analysis. The candlestick chart made it possible to identify standard patterns of traders’ behavior and predict their subsequent decisions accordingly. As a result, a seemingly primitive analysis allowed its creator to increase his capital significantly.
Elements of the candlestick: OHCL
Each candle shows the complete price movement of a specific period. For example, an ideal daily candle, either bullish or bearish, will show the open, high, close, and low price of that day.
Those are the essential elements of a candle, and OHCL stands for open, high, close, and low. In addition, the candlestick has a wide part called the “real body,” representing the open and close price of that day’s movement.
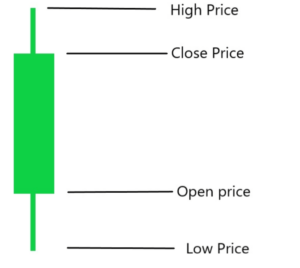
- When the body is black, that means a bearish candle, or simply the price closed lower than the open.
- If the body is empty, that represents a bullish candle, or simply the price closed higher than the open.
- There are shadows or wicks at the candles representing the highs or lows during that specific period.
What is a candlestick mood?
For a more accurate determination of the nature of a candlestick, an expert on the price action method, Lance Beggs, introduced into use such a concept as the “mood” of a candle. This approach has some advantages over the traditional classification of candles since it does not focus only on the candle color but considers the nature of the price movement.
There can be three types of sentiment in total: bullish, bearish, and neutral. Moreover, each of the moods additionally has three gradations or levels: high, medium, and low.
If the candlestick closes above the previous high, it is in a bullish mood. Conversely, if the period’s closing price was below the previous low, the candlestick has a bearish mood. A neutral sentiment candle is formed when the closing price is within the range of the last candle. The close of the current candlestick must fall into one of three zones relative to the previous period.
Important patterns
Not all of these patterns work equally well. In this part, we will discuss some widespread and practical uses of them.
Pinbar
Traders often use the pinbar candlestick pattern to identify trading positions. This type has a petite body and a long wick. The bullish pinbar shows the price rejection at lower levels. So the price may doesn’t want to move more downward. On the other hand, a bearish pin bar shows price rejection at the upside and has higher wicks.

Engulfing pattern
The engulfing pattern is one of the highly effective among all. It is a small black candle followed by a large white candle the next day. The body of the white candle completely overlaps the previous candle.

The bearish engulfing pattern is just the opposite of the bullish. Therefore, when a bullish engulfing pattern appears, then the price may moves further high and vice versa for a bearish engulfing pattern.
Shooting star
The shooting star is more likely a reversal-type candlestick pattern. It looks the same as the inverted hammer.

The bullish shooting star has a long upper shadow and has no or minor lower shadow. That appears at the end of an uptrend, so the bearish shooting star is just the opposite of the bullish shooting star.
Hammer
It is just like the shooting star pattern with shadow or wick on only one side. So this type of candle looks like a hammer. Bullish hammers have short bodies with lower wicks and generally appear at the end of a bearish trend. So the bearish hammer is just the opposite of the bullish occurring at the top of an uptrend.

Doji
In Japanese, Doji means mistake or blunder. When the opening and closing prices are the same for a certain period, that makes a Doji candle. Technically it’s a reversal type candlestick pattern.

The bullish Doji appears at the downtrend, and the bearish Doji appears at the uptrend. Likely, traders take a break at a certain level where this type of candle appears. So the trend may remain intact or make a reversal.
How to read chart using candlestick pattern
Candlestick chart patterns are effective in reading the price movement and predict the price movement. However, it’s not a 100% effective trading system like every other trading system. No trading system always works as several facts work behind the price movement, and different time frame charts may have various indications.
Nevertheless, at a certain price level: historic, support resistance, several price action levels, these patterns show tremendous results.

Let’s look at the example. By looking at the daily chart of the XAU/USD chart, the price made an engulfing candlestick pattern from 1730-1760. That’s a bullish signal, which goes further higher 35$+, that’s 1760-1795, per ounce in four days.
Afterward, the price took some retracement toward 1755 after a shooting star candle. Then there, a Doji candle appears near 1770. So the price again starts to make a solid high and goes near 1830, nearly 60$ per ounce, just in the next six days!
Limitations of candlestick pattern
There are two possible ways to observe or make decisions to open orders for the assets: the technical and the fundamental analysis.
Technical analysis focuses on historical patterns or repeated ways, but the fundamental analysis focuses on economic, political, social news, and factors.
Investors always try to find a fair price to open orders for any tradable assets that have opportunities to move further forward towards the order.
Here are some limitations of the patterns:
- Candlestick pattern suggests trade ideas based on technical facts.
- Therefore, the main limitations of the candlestick are that it does not include fundamental effects on the price.
- It is not possible to see the trading volume using candlesticks.
- Candlestick does not show a precise price direction from a random place.
There is nothing to worry about as, besides technical analysis, the fundamental analysis also has limitations. It takes a lot of finance, experience, knowledge, and resources to think like the players: big institutions, hedge funds, central banks.
Final thought
Finally, there is no doubt that candlestick patterns work fine at some such levels. However, the best trading opportunities come when the technical and fundamental suggest the same direction for the price movement. So better to do some research before putting any order at a specific price for any asset.


Comments