
Triple RSI is a custom indicator to generate trade ideas for any financial asset. It is so popular in the financial market for its efficiency. So it makes sense that you can generate many profitable trade ideas using the triple RSI indicator.
However, it requires having a particular level of understanding of the indicator components alongside the using procedure when seeking to obtain the best results. We will dive deep into the tool in this article. Moreover, it contains trading strategies using the indicator with chart attachments for better understanding.
What is the triple RSI indicator?
This indicator contains three RSI dynamic lines instead of one in traditional RSI. It is unique and uses additional calculations alongside the traditional RSI indicator concept. Different values this indicator uses are 7,14, and 21.
The first RSI line of lower value is red, followed by the second yellow and the third blue. Crossover between these lines enables trading opportunities for crypto investors. Meanwhile, the levels are the same as the traditional RSI indicator.
How to use the triple RSI in trading strategy?
You already know that the triple RSI involves calculating the market data using the same concept as the traditional RSI and conducting additional calculations. When the dynamic red line reaches above the other two dynamic lines declares a positive force on the asset price and vice versa for the opposite crossover. Crypto investors usually seek these crossovers near the top (80) or bottom (20) levels when opening buy/sell positions.
Short-term trading strategy
In this trading method, we combine the triple RSI indicator reading with the ADX indicator to determine the future movement of any particular trading instrument. We confirm the price direction using the triple RSI indicator and then confirm the current trend’s strength by observing the ADX indicator reading. Then seek to open trading positions by combining both indicator readings. This strategy suits many time frame charts. We suggest using a 15 min or H1 chart to get the best results.
Bullish trade scenario
When seeking to open buy positions, observe indicator readings as below:
- The dynamic red line of the triple RSI window reaches above the other two dynamic lines.
- The dynamic yellow line crosses above the dynamic blue line.
- All three dynamic lines reach above the central (50) level and head on the upside.
- The ADX reading reaches above 20.
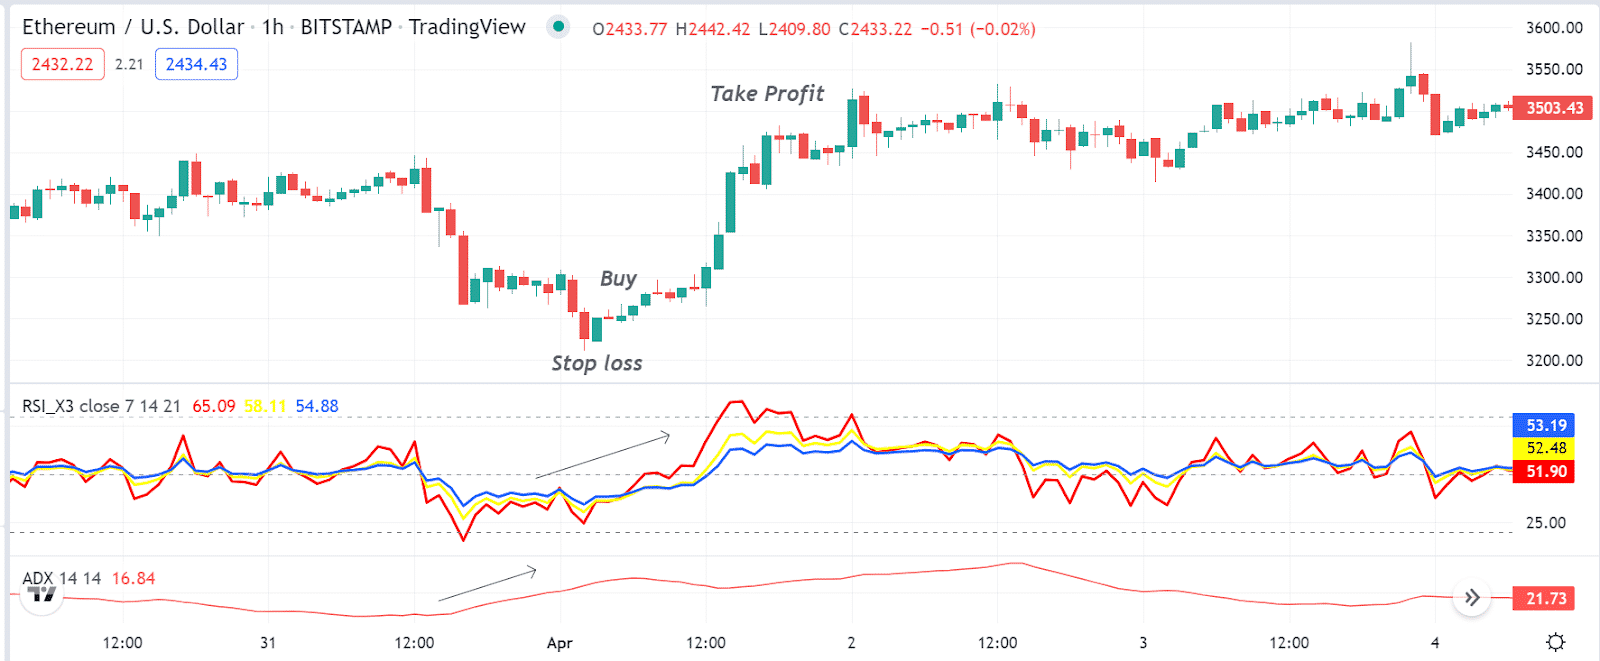
Bullish setup
Entry
When these conditions above match your target asset chart, it positively influences the asset price. Open a buy position.
Stop loss
Set an initial stop loss below the current swing low with a buffer of 5-10pips.
Take profit
Close the buy order by checking indicators readings as below:
- The dynamic lines of the RSI indicator window reach the top (80) level or above.
- Dynamic lines of the Triple RSI window may start declining after reaching near the top (80) level.
- The ADX value drops below 20.
Bearish trade scenario
When seeking to open sell positions, observe indicator readings as below:
- The dynamic red line of the triple RSI window reaches below the other two dynamic lines.
- The dynamic yellow line crosses below the dynamic blue line.
- All three dynamic lines reach below the central (50) level and head on the downside.
- The ADX reading reaches above 20.
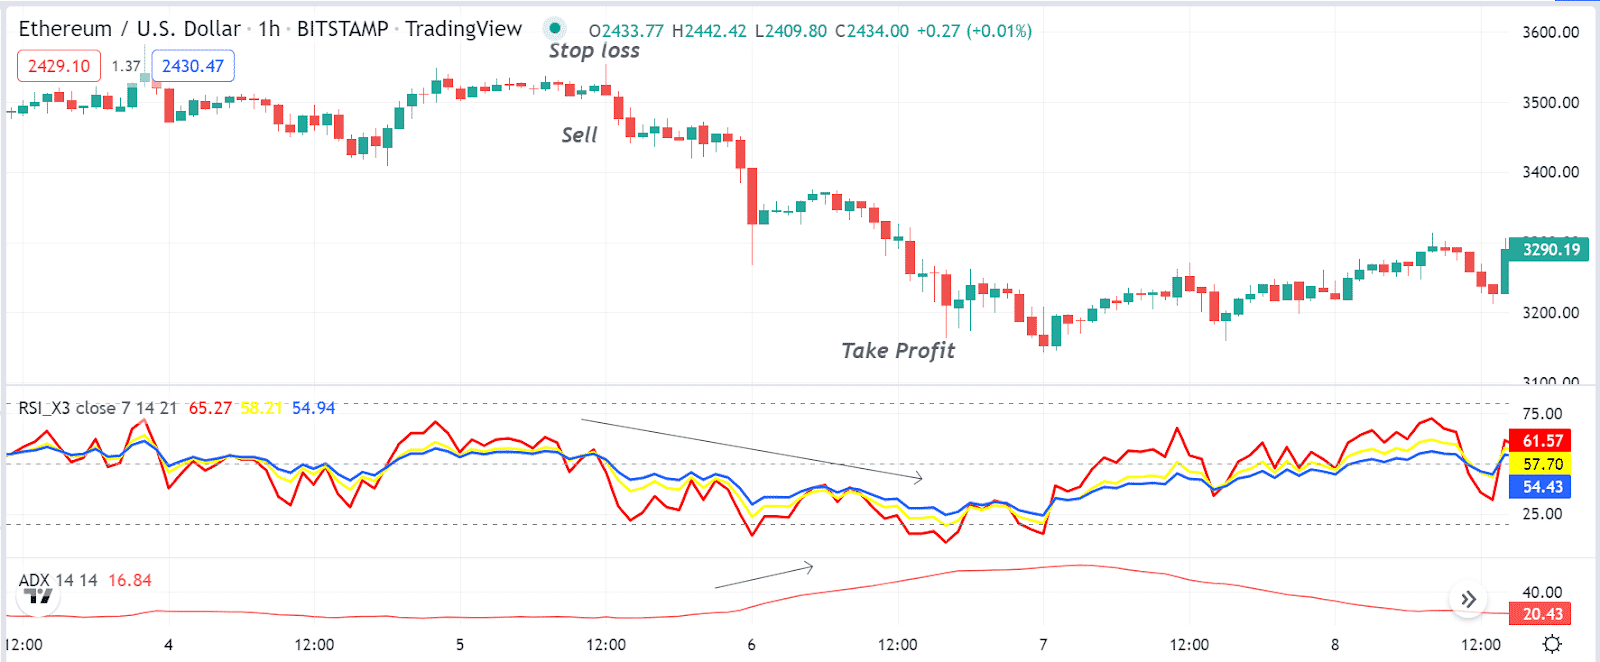
Bearish setup
Entry
When these conditions above match your target asset chart, it negatively influences the asset price. Open a sell position.
Stop loss
Set an initial stop loss above the current swing high with a buffer of 5-10pips.
Take profit
Close the sell order by checking indicators readings as below:
- The dynamic lines of the RSI indicator window reach the bottom (20) level or below.
- Dynamic lines of the Triple RSI window may start rising after reaching near the bottom (20) level.
- The ADX value drops below 20.
Long term trading strategy
We use the parabolic SAR as a supportive indicator alongside the triple RSI indicator to generate potentially profitable trade ideas in this trading method. Parabolic SAR is a straightforward indicator that detects swing points and confirms trends by creating dots on both sides of price candles.
We use this indicator reading to confirm the price movements before entering trades. We suggest using this method on a D1 or H4 chart to catch the best long-term trades.
Bullish trade scenario
You may open a buy position when the indicator shows readings as below:
- The red and dynamic yellow lines reach above the dynamic blue line in the triple RSI indicator window.
- All dynamic lines are near the central (50) line and head on the upside.
- The parabolic SAR dot takes place below price candles and starts making a series.
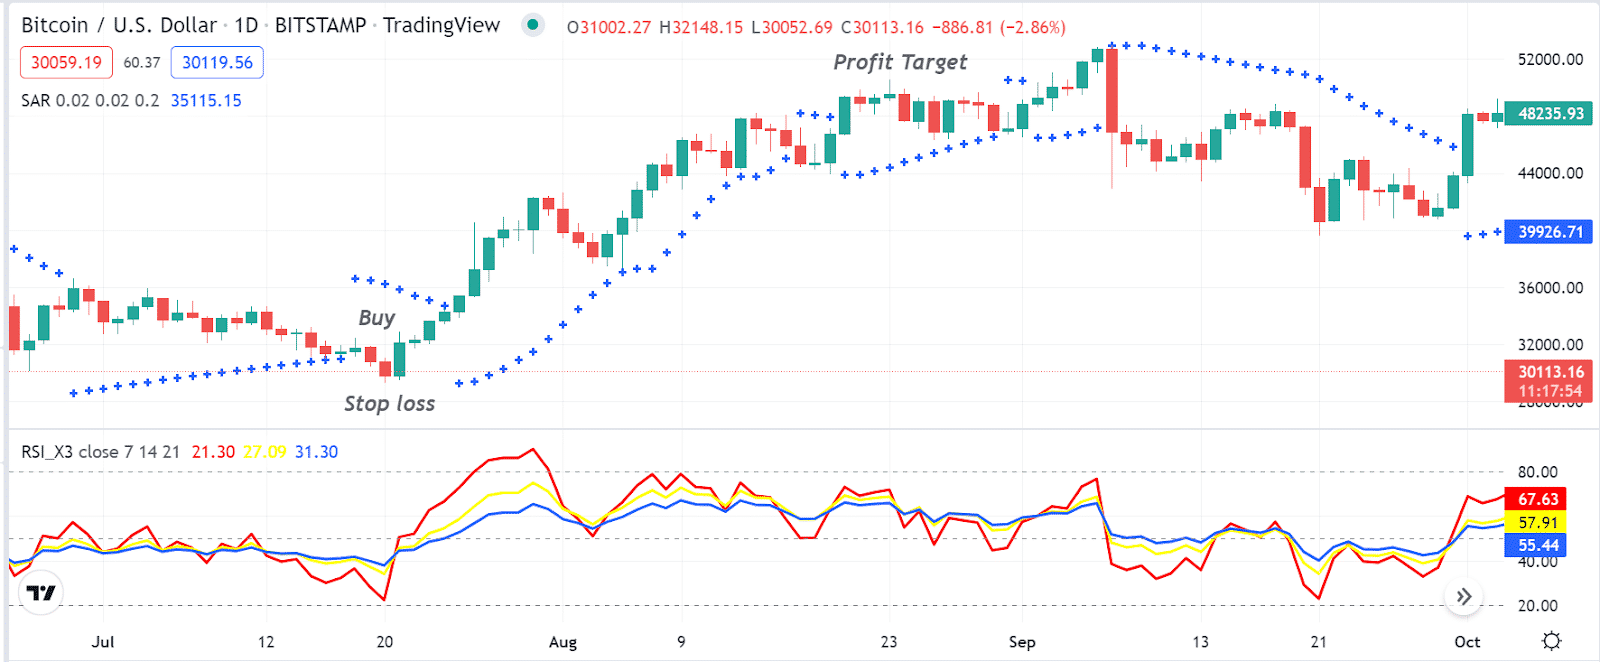
Bullish setup
Entry
When these conditions above match your target asset chart, open a buy position.
Stop loss
Place an initial stop loss below the current bullish momentum.
Take profit
Close the buy order by matching the conditions below:
- All dynamic lines of the triple RSI indicator window may reach near the upper (80) level or above.
- The dynamic lines of the triple RSi indicator window start to decline after reaching near the top (80) level.
- The parabolic SAR dots switch on the upside of price candles.
Bearish trade scenario
You may open a sell position when the indicator shows readings as below:
- The red and dynamic yellow lines reach below the dynamic blue line in the triple RSI indicator window.
- All dynamic lines are near the central (50) line and head on the downside.
- The parabolic SAR dot takes place above price candles and starts making a series.
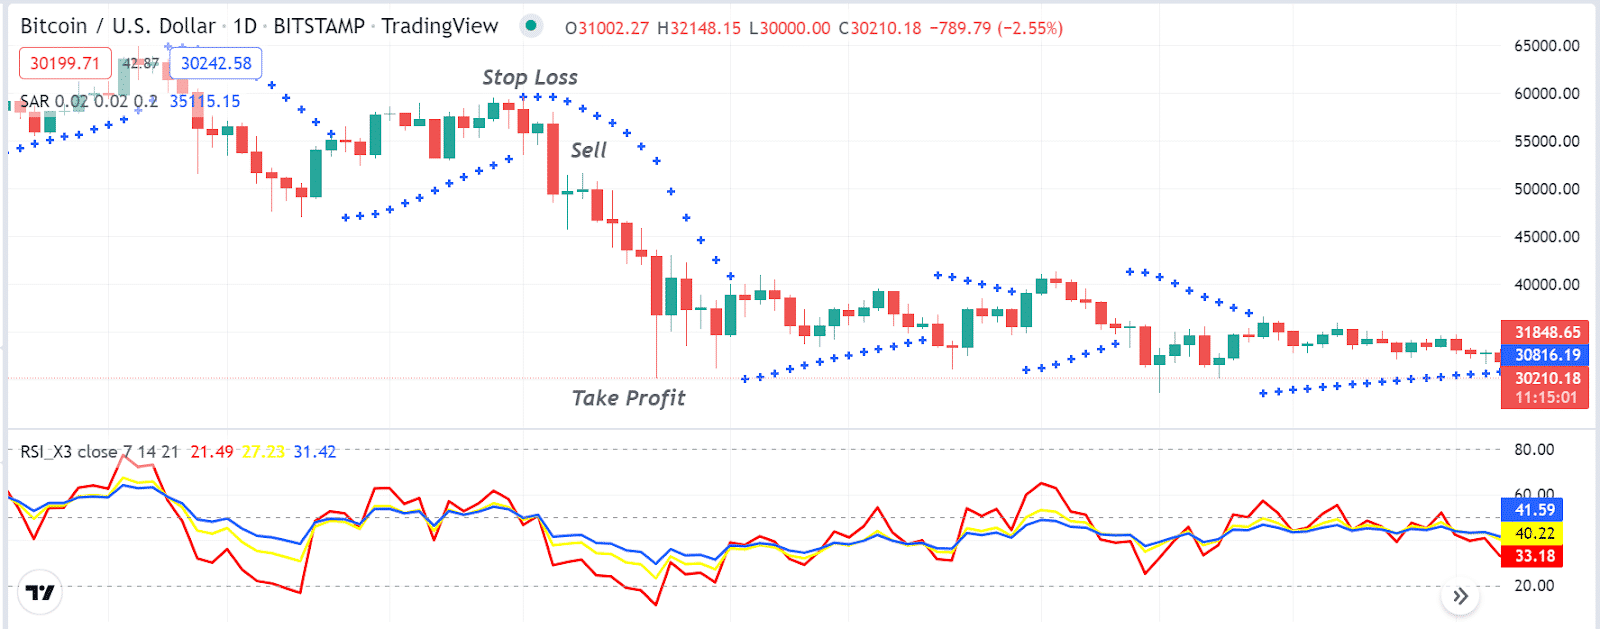
Bearish setup
Entry
When these conditions above match your target asset chart, open a sell position.
Stop loss
Place an initial stop loss above the current bearish momentum.
Take profit
Close the sell order by matching the conditions below:
- All dynamic lines of the triple RSI indicator window may reach near the bottom (20) level or above.
- The dynamic lines of the triple RSi indicator window start to increase after reaching near the bottom (20) level.
- The parabolic SAR dots switch on the downside of price candles.
Pros and cons
| 👍 Pros | 👎 Cons |
|
|
|
|
|
|
Final thought
Finally, the triple RSI indicator is a unique indicator to generate trade ideas for many trading assets. You can make enormous profits from crypto assets by using this indicator concept independently or any trading strategies above.


Comments