
In the FX, price moves by leaving footprints and creates patterns at different time frames. The high low with the ADX trading system for MT4 is based on asset price moving strength and dynamic range (support and resistance).
Therefore, we can quickly short the assets positive and negative before entering the market, and the range can identify the exit points.
What is the high low with the ADX trading system?
The forex market’s basic phenomena to make money are buying orders at lows and selling orders at highs. So this trading method shows that highs and lows could be considered entry points and the exits or the dynamic support-resistance levels.
Required tools/indicators for this trading system:
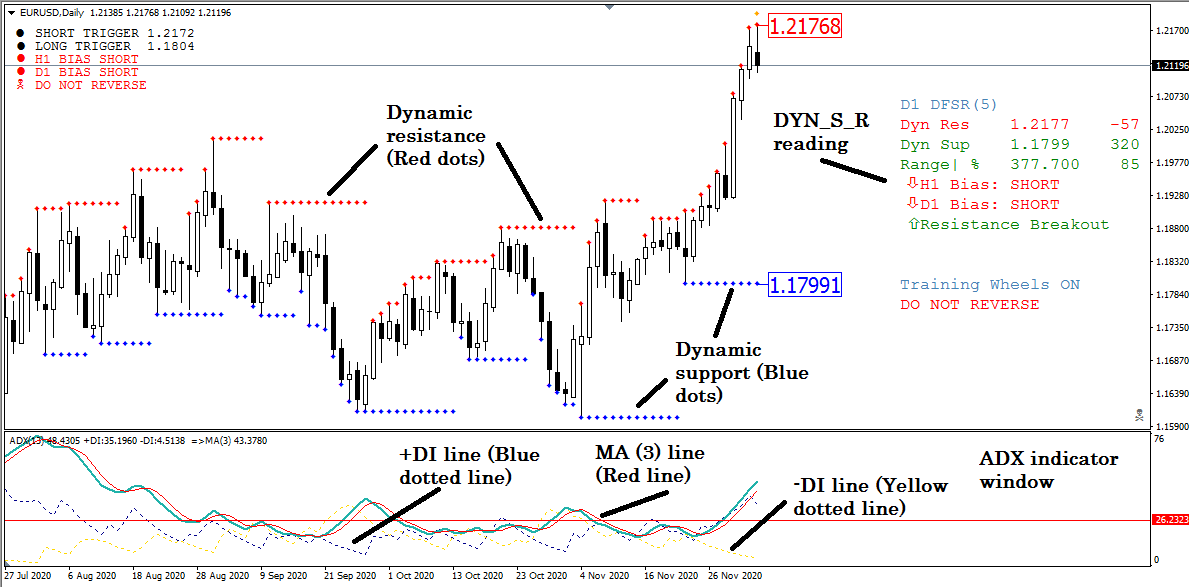
- ADX13: average directional movement index with +DI, -DI, and MA (3)
- DYN_S_R: dynamic support/resistance or range indicator

Simple brief of tools
The average directional movement index (ADX) is an indicator or tool of technical analysis that calculates market data and determines the trend’s strength.
The trend of asset price can be on an uptrend or a downtrend that is shown by two coincident indicators:
- The negative directional indicator -DI
- The positive directional indicator +DI
When the value of +DI is greater than the value of -DI, or simply the +DI line crosses or remains above the -DI line, it indicates upward or positive asset price strength and vice versa. This indicator calculates and shows its reading on an independent window containing two more signal lines or moving average lines of different colors with different input values.
The DYN_S_R is an asset that indicates the support and resistance levels by creating:
- Blue dots at the support levels: below the candles
- Red dots at the resistance levels: above the candles
In other words, this tool identifies the range of the price movement and shows it at the main chart window.
Bullish trading strategy
Trading in the direction of a strong trend increases profit potential and reduces risk at once. After applying all features of this trading method, it’s straightforward to identify the asset’s profitable buy positions. This trading system applies to any major or minor currency pair, and the recommended time frame is a daily (D1) chart.
Bullish trading conditions:
- The value of +DI is more significant than -DI (+DI> -DI) or simply the +DI (dark blue dotted) line crosses or remains above the -DI or yellow dotted line, which indicates positive strength for the asset price movement.
- Check the MA (3) or red line and confirm that the +DI or dark blue dotted line crosses or remains above it (+DI>-DI ADX> 3EMA).
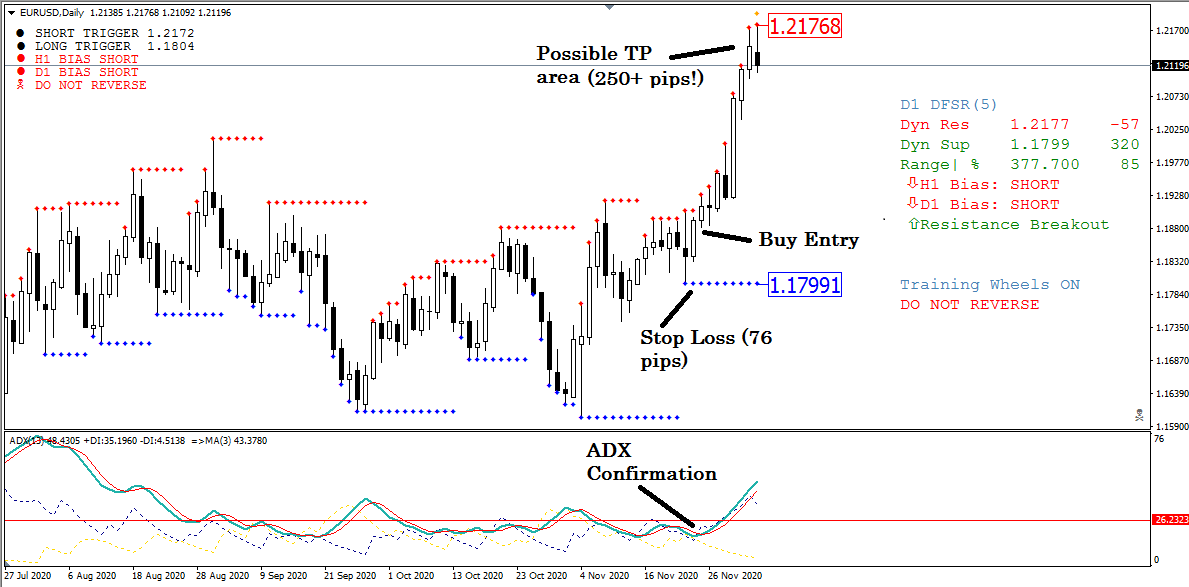
Entry
Check all the buy conditions above are proper at the daily chart of the target asset, then wait for the daily candle to close and enter “buy order” above three pips of the closed candle with the red dot.
Note: this trading method recommends opening pending orders to ensure the entry at the correct price and adding the spreads to pending orders when looking to go long. Therefore, be aware of entering at major pairs during major economic events like NFP, FOMC announcement, FED interest rate decision, etc.
Stop loss
The stop loss should be below the recent swing low or below the dynamic support level with some buffer.
Note: this trading system recommends stop-loss between 50-80 pips. As it is a trend following strategy, you can shift the stop loss at the breakeven point or above it by observing price movement’s behavior to reduce risks.
Take profit
Exit when the opposite or red dot starts to make a line or after two red dots appear in a row.
List of exceptional pairs and profit targets:
- GBP/JPY, EUR/JPY, GBP/USD 80 pips
- EUR/USD 70 pips
- USD/CAD, AUD/USD, USD/JPY, USD/CHF 60 pips
Bearish trading strategy
Trading in the direction of a strong trend increases profit potential and reduces risk at once. After applying all features of this trading method, it’s straightforward to identify the asset’s profitable sell positions. This trading system applies to any major or minor currency pair and the recommended time frame is a daily (D1) chart.
Bearish trading conditions:
- The value of -DI is more significant than +DI (-DI>+ DI), or simply the -DI or yellow dotted line crosses or remains above the +DI or dark blue dotted line, indicating negative strength for the asset price movement.
- Check the MA (3) or red line and confirm that the -DI or dark blue dotted line crosses or remains above it (-DI>+DI ADX> 3EMA).
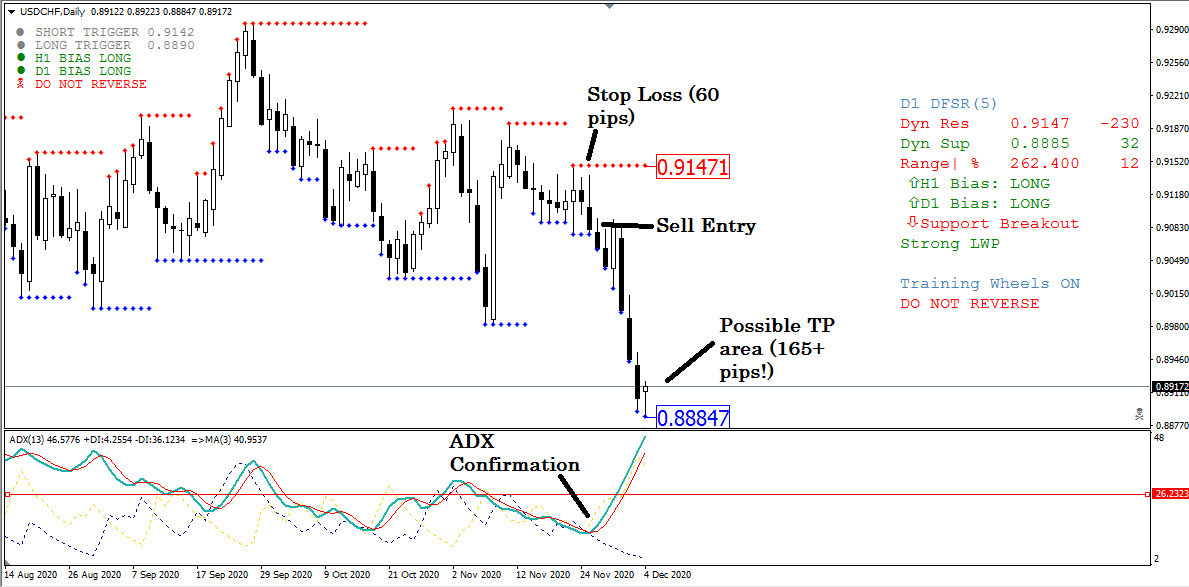
Entry
Check all the sell conditions above are proper at the daily chart of the target asset. Then wait for the daily candle to close and enter the sell order below three pips of the closed candle with the blue dot.
Note: this trading method recommends opening pending orders to ensure entry at the correct price. Be aware of entering at major pairs during major economic events like NFP, FOMC announcement, FED interest rate decision, etc.
Stop loss
The stop loss should be above the recent swing high or above the dynamic resistance level with some buffer.
Note: this trading system recommends stop-loss between 50-80 pips. As it is a trend following strategy, stop losses could be shifted at the breakeven point or below it by observing price movement’s behavior to reduce risks.
Take profit
Exit when the opposite or blue dot starts to make a line or after two blue dots appear in a row.
List of exceptional pairs and profit targets:
- GBP/JPY, EUR/JPY, GBP/USD 80 pips
- EUR/USD 70 pips
- USD/CAD, AUD/USD, USD/JPY, USD/CHF 60 pips
Final thoughts
This trading system is very effective and profitable as it generates trade ideas by identifying trends, the strength of the trends, and the dynamic range of asset price movement. The daily chart is the most used or observed map by every level of traders from individuals to the institution as this system recommended time frame so that you can identify optimistic trade setups.


Comments