
The FX is the world’s biggest financial market, where significant participants are prominent institutes. Therefore, when we make trading decisions, we should have vital elements with a good track record.
In every trading system, traders should test its reliability by watching how it worked in the past candle. Based on this concept, make sure to consider the harmonic pattern a reliable trading system as it has been providing profits since 1932.
If you can make the best use of these patterns, you can make decent money from forex trading.
What is the harmonic pattern?
A harmonic pattern is a geometric price behavior that can provide a reliable price direction. For example, the price in the financial market moves by creating new highs or lows where failure to do so makes the possibility of reversal.
However, every failure of trend continuation is not a sign of price reversal. It requires some calculative signs and Fibonacci ratios to indicate the reversal point. The main aim of the harmonic pattern is to spot the exact price reversal point, depending on its calculation method.
Moreover, traders can use harmonic patterns to find whether the price will follow the current direction or not in any instrument.
We can distinguish harmonic patterns in both internal and external ways:
- In an internal one, the price remains within the geometric share.
- In an external one, the price breaks below or above the geometric shape.
You can pick any of these patterns for your trading.
Top 4 harmonic patterns for forex trading:
- Bat pattern
- Crab pattern
- Butterfly pattern
- Gartley pattern
Let’s have a look at them one by one.
Bat pattern
It is a geometric pattern with four swings. You can spot this pattern by watching the market movement or by drawing lines using MT4 tools.
There is a practical chart in the image below where the bat pattern works as a significant price reversal.
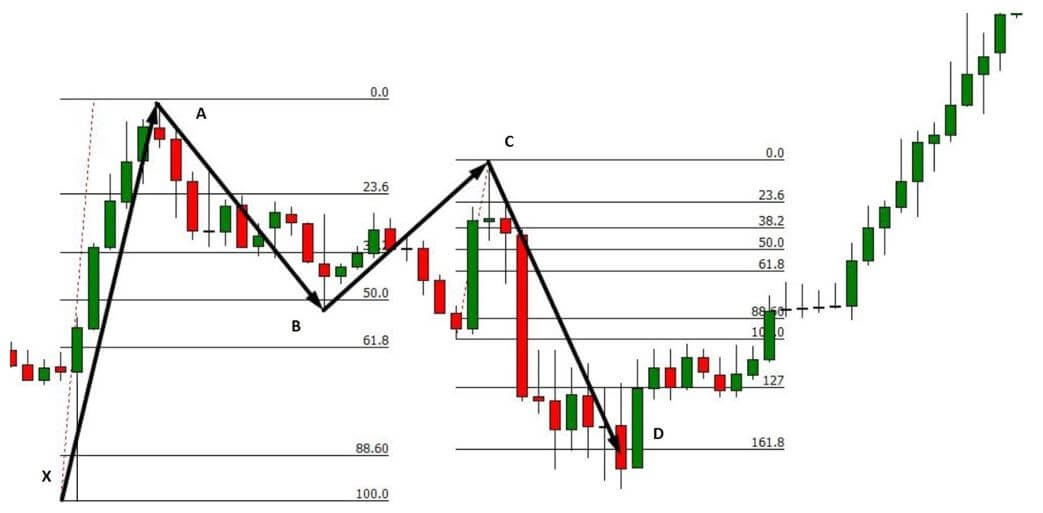
The critical feature of Bat pattern as per the above image:
- XA
The first leg is XA that came after a strong bearish trend. After a long selling market, the XA will be bearish. On the other hand, for a bearish trend, it will be bullish.
- AB
Another leg that comes from the XA is AB. It is the XA’s retracement that may start from 0.382 to 0.50. Make sure that the AB leg is corrective after the impulsive XA leg.
- BC
Then BC will try to overcome the AB but fail. Therefore, BC will remain smaller than the AB. As a result, the CD will move with a tremendous speed, breaking below or above the low/high of X.
- CD
It is the last and final leg that defines the D as an entry point. This leg can extend up to 1.618 to 2.618 of the BC leg.
Crab pattern
The Crab pattern is also a geometric pattern with four swings. You can spot this pattern by watching the market movement or by drawing lines using MT4 tools.
In the image below, we can see what a crab pattern looks like.
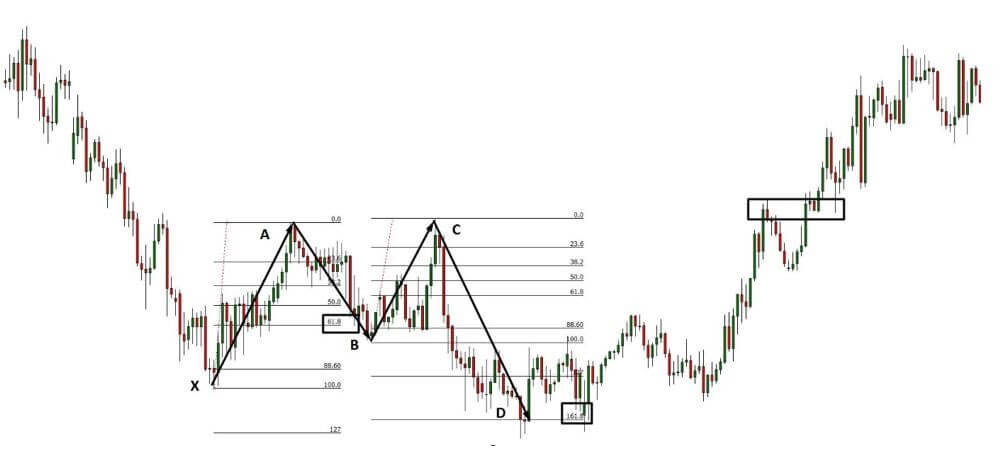
The critical feature of Crab pattern as per the above image:
- XA
The first leg is XA that came after a strong bearish trend. After a solid bearish trend, it may come as a bullish sign. On the other hand, for a bearish trend, it will be bullish.
- AB
Another leg that comes from the XA is AB. It is the XA’s retracement that may come from 0.382 to 0.618. Make sure that the AB leg is corrective after the impulsive XA leg.
- BC
After AB, BC may retrace up to 100% of AB.
- CD
It is the last leg of the bat pattern that defines the D point as an entry point. The CD leg can extend up to 2.224 to 3.618 of the BC leg.
Butterfly pattern
It is a market reversal indicator that shows the price in four legs: XA, AB, BC, and CD. Therefore, you may find such patterns at the top and down of a trend. Here, X is the starting point, and D is the entry point.
Let’s have a look at how the Butterfly pattern looks like.
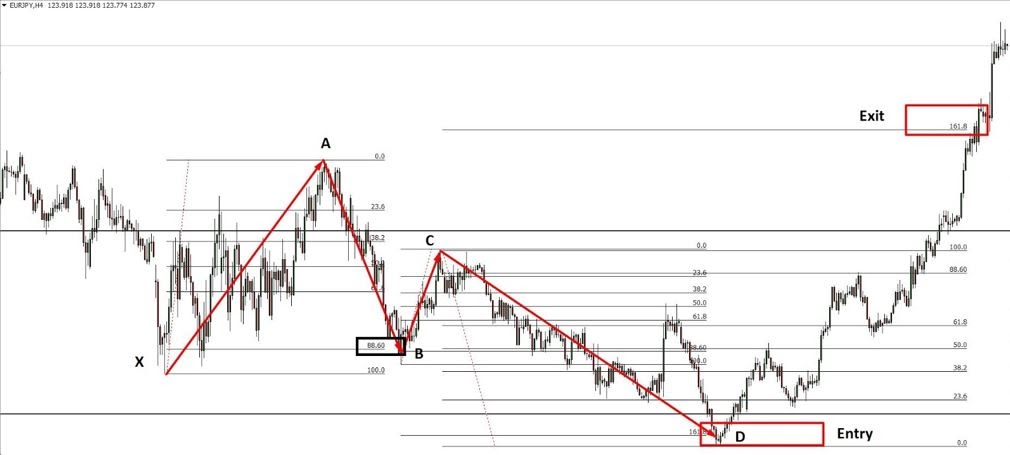
The critical feature of this pattern as per the above image:
- XA
The first leg is XA that will make a new high or low by violating the most recent price swings.
- AB
Another leg from the XA is AB that can retrace up to 0.782 of the XA leg.
- BC
After AB, BC can retrace from 0.382 to 0.882 of the AB.
- CD
It is the last leg that may extend up to 1.618 to 2.618 BC.
Gartley pattern
Traders can identify the Gartley pattern using trendline and Fibonacci ratios. The main difference of this pattern is that it looks like the W/M shape. Like the butterfly pattern, it has four legs: XA, AB, BC, and CD.
Let’s have a look at a visual version of the Gartley pattern from the chart.
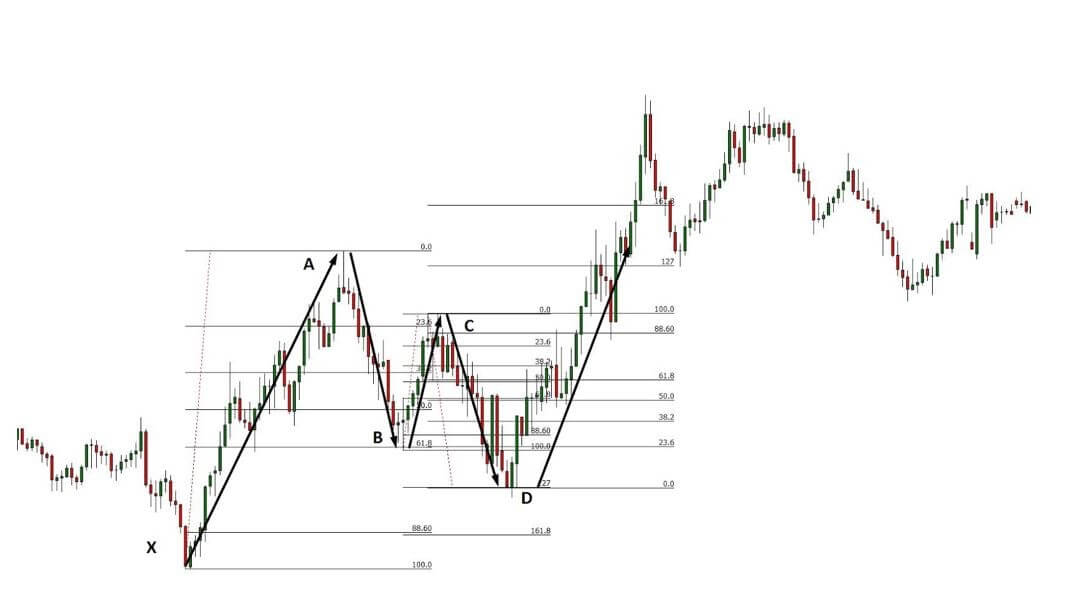
Let’s have a look at conditions to confirm that the current pattern is a Gartley:
- XA
It is the primary leg.
- AB
It may retrace up to 61.8% of the XA leg.
- BC
It should retrace from 38.2% to 88.6% of AB.
- CD
This leg can move 127.2% Fibonacci extension level of BC.
Conclusion
We have seen the top four harmonic patterns that are profitable in any financial market. So you can build a good trading strategy using these tools in any timeframe.
However, the FX consists of some unavoidable risks, and there is no guarantee that the price will follow this pattern every time. Therefore, if you want to make sustainable growth to your trading account, you should follow a trading strategy with a systematic approach to minimize risks.


Comments