
FOMO, or the fear and missing out, is a handy method to detect significant movements of any particular asset in the financial market. Financial traders frequently use this concept while making trade decisions. So it makes sense that this technique can be helpful for crypto investors to determine profitable trading positions.
However, someone interested in implementing any concept or technical tool to execute successful trades requires a certain level of understanding to obtain the best results. This article enlightens the FOMO indicator alongside describing sustainable trading strategies using this indicator with chart attachments.
What is the FOMO indicator?
The FOMO momentum indicator enables executing profitable trades by utilizing the market context. It is a technical indicator that detects the momentum like other momentum indicators and displays the result in an independent window. The indicator window contains a central line and histogram bars of different colors on both sides of that central line. The FOMO or fear of missing out reflects the feelings of an investor who may recently missed a significant price movement.
How to trade crypto using the FOMO indicator?
Using this indicator, any trading method in crypto assets is a crypto FOMO strategy. Follow the histogram bar color and size to learn the market context. When the histogram bars appear above the central line, the color will be green, and it creates red histogram bars when the asset price faces declining pressure.
Moreover, the size of histogram bars will increase or decrease depending on the price changing force in any direction. To implement the concept most effectively, you can use this indicator concept independently or combine the reading with other technical tools and indicators.
Short-term trading strategy
In this short-term trading method, we combine the support resistance concept and the parabolic SAR indicator with the FOMO indicator to make trade decisions. This method applies to many trading assets on different time frame charts; we recommend using a 15 min or H1 chart to catch the best short-term trades.
First, we mark the support resistance levels from upper time frame charts alongside marking many necessary levels, including historical levels, price action levels, etc. Later seek to open trading positions in short-term time frame charts depending on the market context or market behavior.
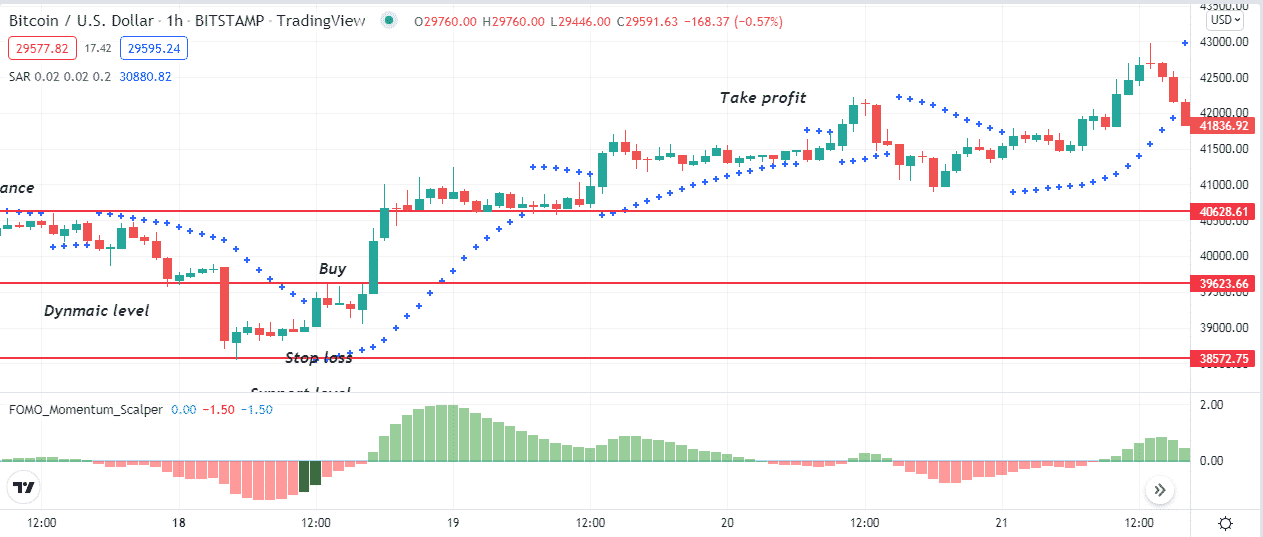
Bullish trade scenario
When seeking to open a buy position, mark all essential levels and observe the scenarios below:
- The price reaches a support level or starts bouncing upside after getting that level.
- The price may break above any resistance level.
- The parabolic SAR dot takes place below price candles and starts making a series.
- Green histogram bars take place above the central line of the FOMO indicator window.
Entry
Match these conditions above to detect potential bullish momentum and open a buy position.
Stop loss
The initial stop loss will be below the current bullish momentum with a buffer of 5-10pips.
Take profit
The primary initial profit target will be below the next resistance level. Otherwise, close the buy order by observing the scenarios below:
- The parabolic SAR dots switch above price candles.
- Red histogram bars take place below the central line of the FOMO indicator window.
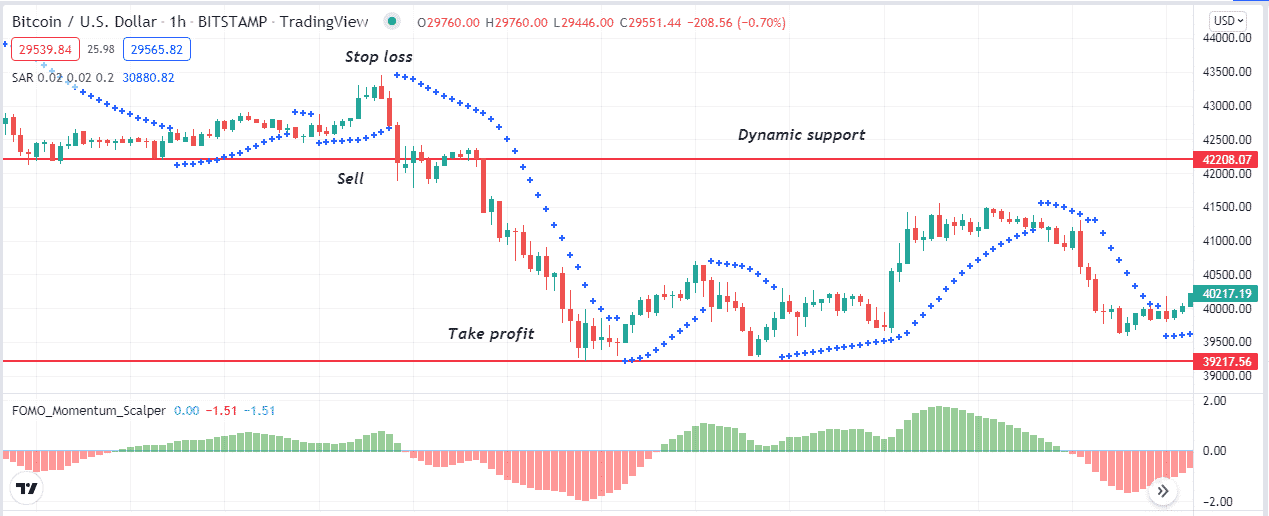
Bearish trade scenario
When seeking to open a sell position, mark all essential levels and observe the scenarios below:
- The price reaches a resistance level or starts bouncing downside after getting that level.
- The price may break below any support level.
- The parabolic SAR dot takes place above price candles and starts making a series.
- Red histogram bars take place below the central line of the FOMO indicator window.
Sell setup
Entry
Match these conditions above to detect potential bearish momentum and open a sell position.
Stop loss
The initial stop loss will be above the current bearish momentum with a buffer of 5-10pips.
Take profit
The primary initial profit target will be above the next support level. Otherwise, close the sell order by observing the scenarios below:
- The parabolic SAR dots switch below price candles.
- Green histogram bars take place below the central line of the FOMO ind icator window.
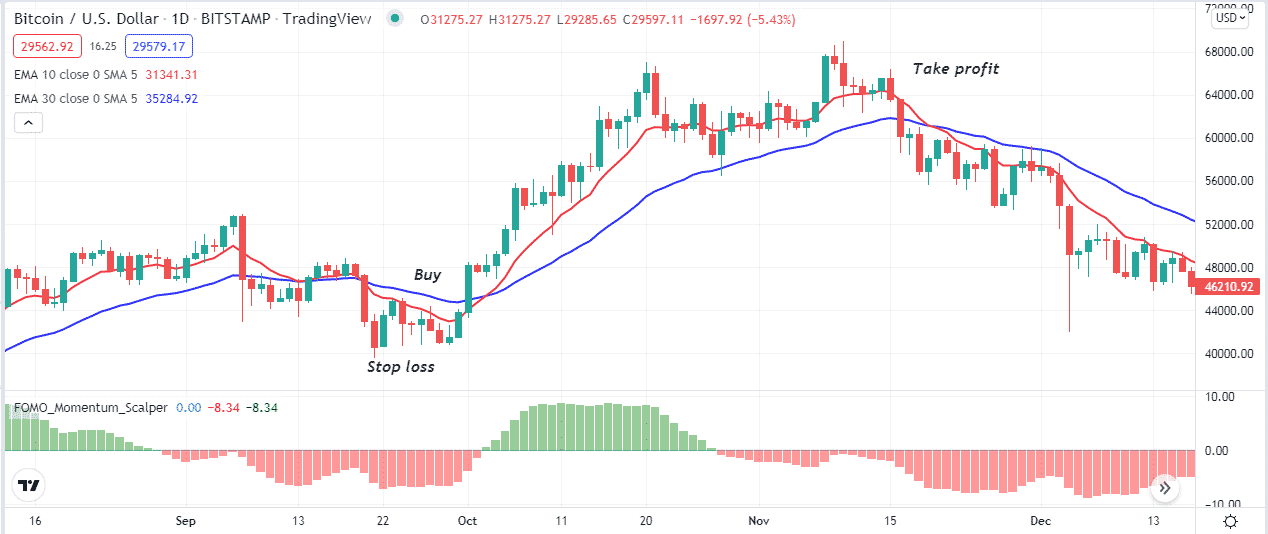
Long-term trading strategy
This trading method combines the EMA crossover concept alongside the FOMO indicator to determine trading positions.
We use EMA 10 (red) and EMA 30 (blue) lines. When the red EMA crosses above the blue EMA, it declares buyers’ domination at the asset price. The opposite crossover between these signal lines expresses sellers’ domination at the asset price.
Meanwhile, we match the market context with the FOMO indicator and execute trades according to the result. We recommend using this trading technique on an H4 or D1 chart to catch the most potent long-term trades.
Bullish trade scenario
Open buy positions when your target asset chart matches these conditions below:
- The red EMA line reaches above the blue EMA.
- Both EMA lines head on the upside.
- The FOMO green histogram bars take place above the central line.
Buy setup
Entry
When these conditions above match your target asset chart, this method declares the price enters a bullish trend. Open a buy order.
Stop loss
Place an initial stop loss below the current bullish momentum.
Take profit
Close the buy order by matching the conditions below:
- The red EMA line drops below the blue EMA line.
- Red histogram bars take place below the central line of the FOMO indicator.
Bearish trade scenario
Open sell positions when your target asset chart matches these conditions below:
- The red EMA line reaches below the blue EMA.
- Both EMA lines head on the downside.
- The FOMO red histogram bars take place below the central line.
Sell setup
Entry
When these conditions above match your target asset chart, this method declares the price enters a bearish trend. Open a sell order.
Stop loss
Place an initial stop loss above the current bearish momentum.
Take profit
Close the sell order by matching the conditions below:
- The red EMA line reaches above the blue EMA line.
- Green histogram bars take place above the central line of the FOMO indicator.
Pros and cons
| 👍 Pros | 👎 Cons |
|
|
|
|
|
|
Final thought
Finally, many financial investors successfully use the FOMO indicator to trade many trading instruments, including stocks, commodities, etc. You can use this unique indicator effectively in crypto assets by mastering the concept appropriately.


Comments