
As long as financial markets exist, so does the moving average. There is no indicator as practical and straightforward as this one. Here you will find everything there is to know about MA, from their types to the system, practical usage. We will equally analyze different trading techniques for this indicator.
- What is the moving average?
- History of MA
- The formula of the MA
- Method for plotting a MA on a price chart
- The advantages and disadvantages of MA indicators
- Benefits of MA
- Disadvantages of MA
- How should you choose the MA period?
- How to trade with the MA?
- How to use the EMA to determine when a trend reversal occurs?
What is the moving average?
MA is a standard and built-in trend indicator that displays the average worth value for a specific time. The indicator shows the direction of the trend, the propensity of the price to rise or fall in the future.
History of MA
The MA concept came to the limelight in 1909 when H.W. Yule depicted R.H. Hooker’s instantaneous averages, summed in 1901, as moving averages. Although Yule’s textbook has no record of concept, his description of the same brought it to being circulated by W.L. King in 1912 in a book titled Elements of a Statistical Method.
MA has been a powerful tool that has always been used to discover the pathway of minimal resistance, highlight points of valuation on one’s chart, determine best entry periods, drive in massive sales, and select the best asset to trade.
The formula of the MA
SMA = SUM (CLOSE (i), N) / N, where:
SUM — amount
CLOSE (i) — closing price of the current period
N — number of computation periods
Method for plotting a MA on a price chart
There are numerous methods for constructing this indicator:
- Simple moving average (SMA) — shows the sum of the closing prices of any instrument for a specified number of unit periods, divided by the number of these periods.
- Exponential moving average (EMA) — giving more value to the bars closer to the current price. The EMA adds a certain fraction of the recent closing price to the immediate value of the moving average. In calculating the smoothed average, more weight has the market closing price. This is the most popular version of the primary indicator.
- Linear weighted moving average (LVMA) — is the most active indicator. It reacts the fastest to price changes, so it gives a lot of false signals. Traders don’t usually use it.
The distinctions between the methods are not significant, but some lines are smoother than others.
The advantages and disadvantages of MA indicators
| Parameter | Dignity | Disadvantage |
| Trend visualization | Unambiguously indicates the direction of the trend | It doesn’t predict the future |
| Variability | Many types of MA | Different MAs sometimes contradict each other |
| Signals for a trend change | Variety of signals, choice | Perceiving signals as 100% predicting the future |
| Trading strategies using MA | Suitable for both trending and counter-trending strategies | Many false signals during periods of non-directional movement |
Benefits of MA
At first, it is difficult not to get lost in the chaos of price fluctuations — there is too much information that the brain cannot simplify and structure. The moving average will help to “reject” some of the price fluctuations that have the most negligible impact on the overall picture.
Depending on his needs, a trader can choose an MA that fits the best to traderes needs. This will help maintain consistency of trading even during periods of unsuccessful series of deals.
The use of a MA involves receiving several types of simple and unambiguous signals for both continuation and trend change.
MA gives plenty of room for both: trending and counter-trending strategies.
Disadvantages of MA
Any MA calculation contains past price data. The final result will reflect, to one degree or another, the past dynamics.
MAs of various types and parameters in some cases will contradict each other. The trader should understand why he is using these MA settings.
Novice traders often perceive signals of a possible trend change from MA as unambiguous. Due to its visual display, the indicator seems to traders as an obstacle to the price, after overcoming which nothing will prevent it from forming a new trend in the opposite direction.
During periods of non-directional movements, the price will very often cross the indicator in both directions. Consequently, in any strategy based on this indicator, such periods are characterized by many “false” signals.
How should you choose the MA period?
Since the MA is a trend indicator, you need to be careful when choosing a period.
The manor rule is evident in the following principle: after the price traverses the MA line, it should stay above it for as long as possible — if the market goes up or below the line — if the market falls. It must act as something like a dynamic line of support or resistance.
The primary task of any trader is to find, using an ordinary search, such values at which the MA will coincide as much as possible with the support or resistance line.
How to trade with the MA?
As it is a trend indicator, its strategies are trending first and foremost. Traders come up with different signals, but there are three main ones.
- Identifying a trend using a MA
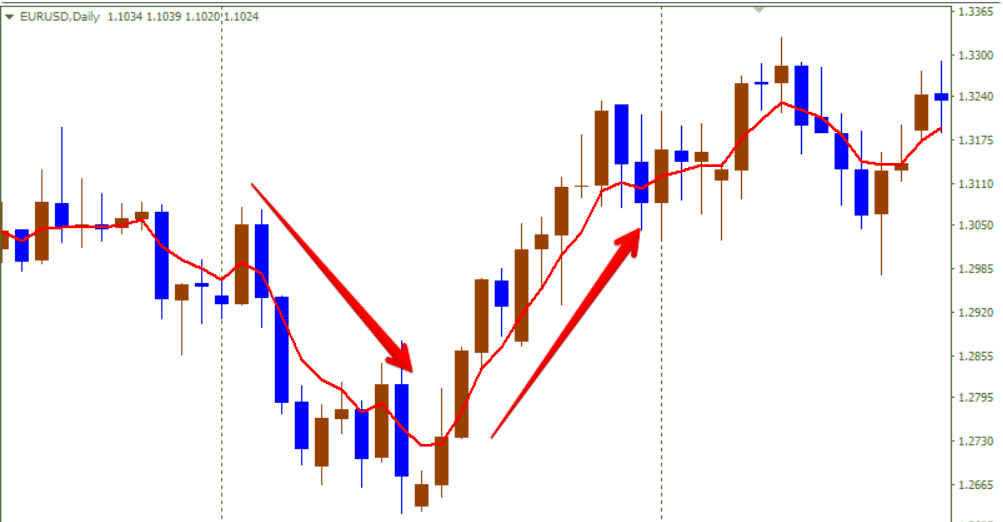
The general direction of the indicator shows the current trend. Depending on the period, the trend is short-term, medium-term, or long-term. The MA looks upward — an upward trend, downwards — a downtrend, located horizontally — a flat.
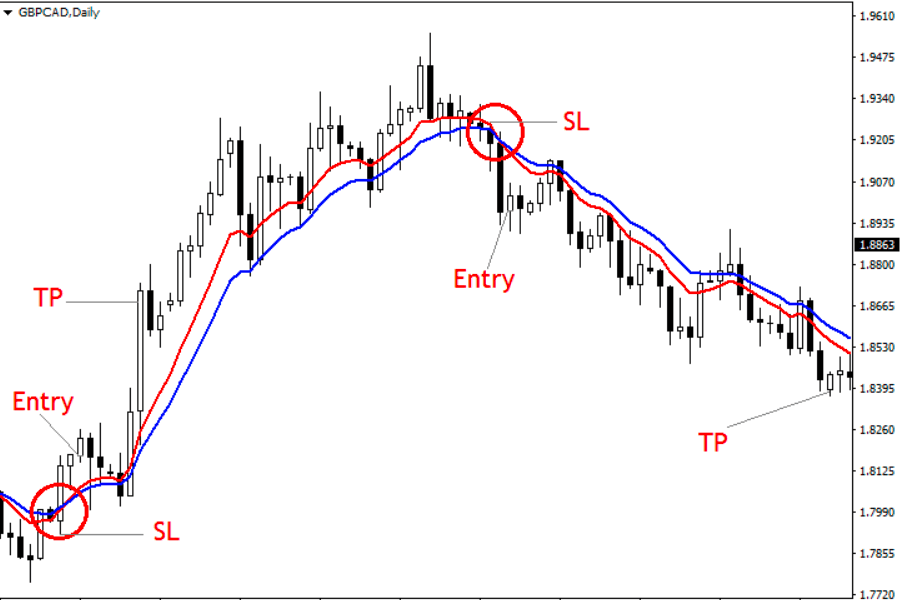
- MA crossover signals
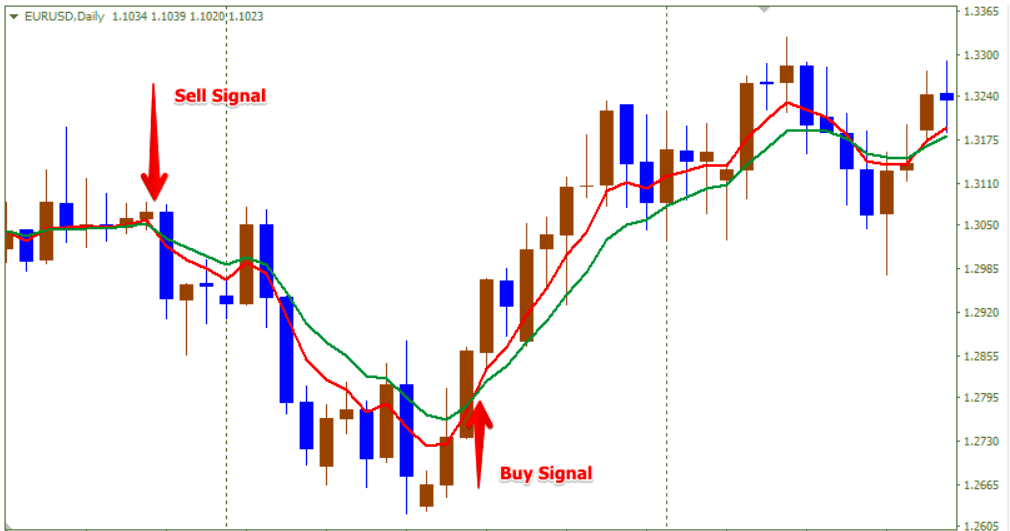
The signal depends on a MA with a shorter period: if it crosses the second line from bottom to top, we have a buy signal, and from top to bottom, we will sell.
- Sliding like resistance
Sliders as support and resistance. Above, we said that MAs with prolonged periods are most suitable for this role. A line break is considered a signal in the direction of the breakdown. It is essential to be very conscientious about selecting the indicator period — it can be different for each asset.
How to use the EMA to determine when a trend reversal occurs?
Let’s look at two common ways:
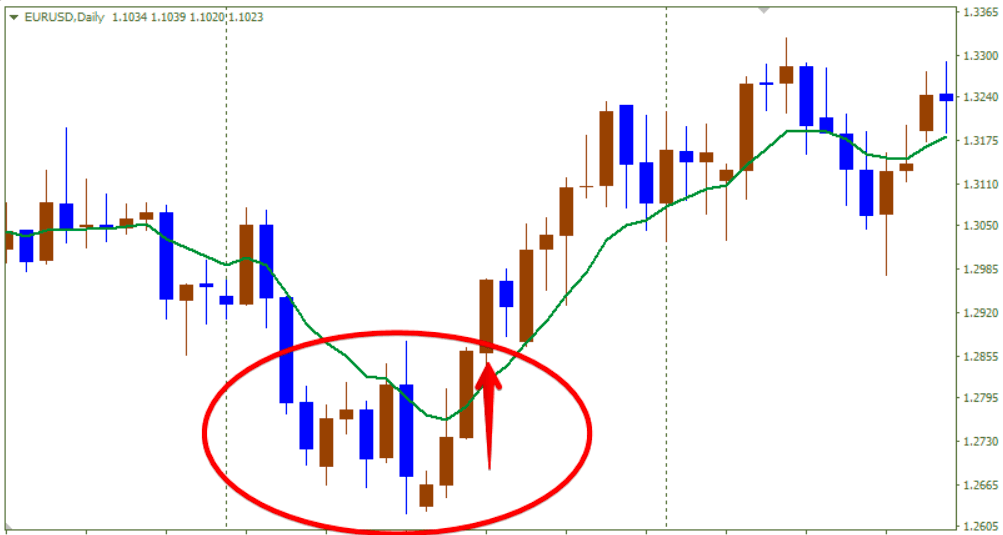
- Look at the direction of the indicator.
- Look at the intersection of the indicator by the price. Alternatively, wait for the price to close behind the arrow.
Consequently, to change the direction of the indicator, the price must go sharply and much in the opposite direction.
This will point to:
- The weakness of those who “push” the price in the direction of the trend.
- The strength of those who “push” the price in the opposite route.
These factors may indicate a trend reversal.
As for the price crossing the indicator, many experts believe that it makes no sense to use this as a signal for something. If the indicator is directed up, and the price has gone under it, this does not mean a bearish trend. On the contrary, you can take a closer look at buying — if the direction of the MA has not changed, then this price movement could not reverse the global trend.


Comments