
Financial traders use many technical indicators to determine the price movement of financial assets. Several types of technical indicators allow traders to analyze the market data from different angles.
The RSI is a popular technical indicator among financial market participants who trade forex, commodities, stocks, etc.
However, when you decide to start using any indicator, you need to learn the capabilities and functionality of that technical indicator. This article contains all the essential info about the RSI indicator with short-term and long-term trading methods.
What is RSI?
It is the short form of trading strength, which is a popular momentum indicator. The developer of this tool is J. Welles Wilder Jr. In 1978, he first wrote about this indicator in his book “New Concepts in Technical Trading Systems.”
The RSI indicator belongs to the group of momentum indicators. It works with recent and historical market data and shows strengths and weaknesses depending on the closing data of a particular period.
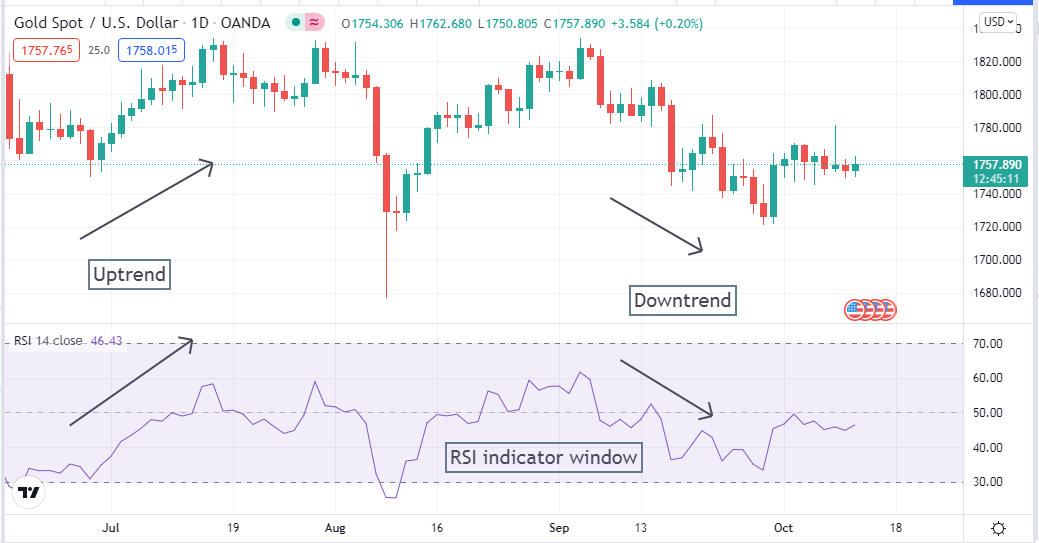
Uptrend and downtrend on a daily XAU/USD chart with RSI window
Please don’t confuse this indicator by comparing it with the Relative Strength Indicator. RSI shows its reading on an independent window. That window includes a signal line that moves in a range between 1-100.
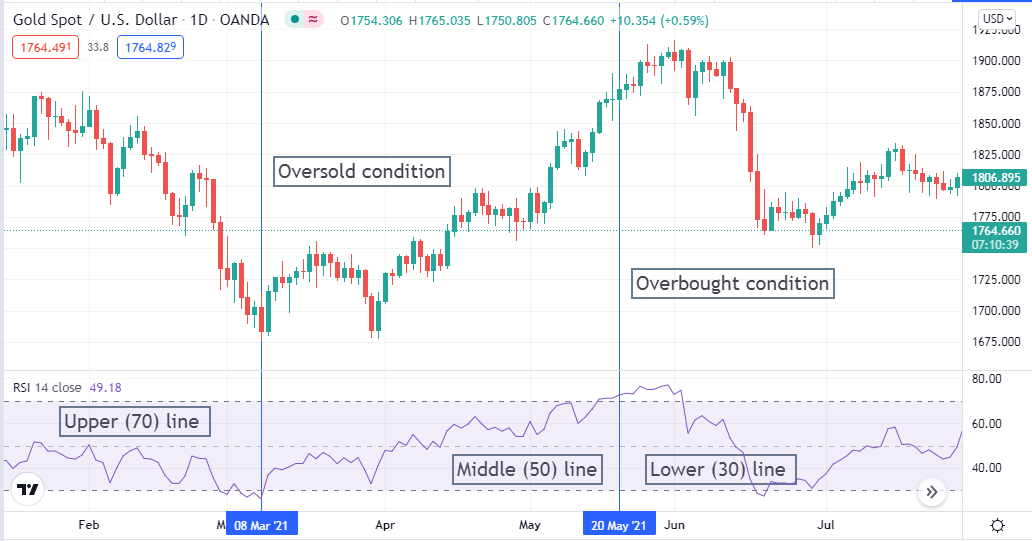
There are three lines at the RSI window:
- One is the upper (70) line
- The middle (50) line
- The lower (30) line
All lines on different values declare price movement phases or conditions.
How to use RSI in trading strategy?
With this indicator, you can trade many financial assets such as forex, stocks, commodities, etc. When the asset price turns to a bullish phase, the dynamic signal line of the RSI window starts to move toward the upside.
If the dynamic signal line crosses the middle (50) line, it confirms that the price movement is bullish and may remain in this phase a few more times. When the RSI window’s signal line reaches or crosses above the upper (70) line, it indicates the asset’s price is at the overbought condition, and a correction on the downside may occur.
Different phases by RSI indicator
On the other hand, by confirming a bearish trend, the dynamic signal line crosses below the middle (50) line and reaches the lower (30) line. As long as the dynamic signal line remains or crosses below the lower (30) line, it indicates asset price is in an oversold condition.
There is no guarantee that price will change trend as it reaches oversold or overbought zones; it can remain in that phase as long as participants’ action remains the same.
Short-term trading strategy
In our short-term trading strategy, we use Parabolic SAR beside the RSI indicator. Parabolic SAR shows dots at above or below price candles to define trends. When the price movement turns to a bullish phase, a parabolic SAR dot appears below price candles and continues to appear until the trend remains intact.
Conversely, a parabolic SAR dot appears above price candles when price movement enters a bearish phase and continues to appear till the trend remains intact. This strategy works fine on any time frame; we recommend an hourly chart to apply.
Bullish trade setup
To enter buy trades, check the conditions below:
- The RSI signal line is above the middle (50) line and heading toward the upper (70) line.
- A parabolic SAR dot appears below price candles.
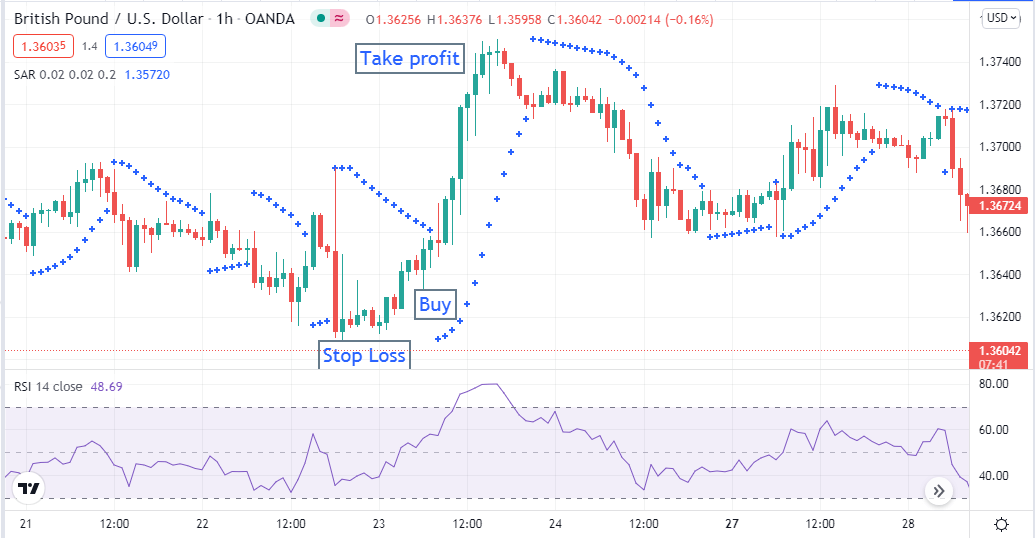
Bullish trade setup
If the conditions above are true, wait until closing the current bullish candle and place a buy order — place stop loss below the recent swing low with a buffer of 5-10pips. Close the buy order when the Parabolic SAR dot appears above price candles.
Bearish trade setup
To enter sell trades, check the conditions below:
- The RSI signal line is below the middle (50) line and heading toward the lower (30) line.
- A parabolic SAR dot appears above price candles.
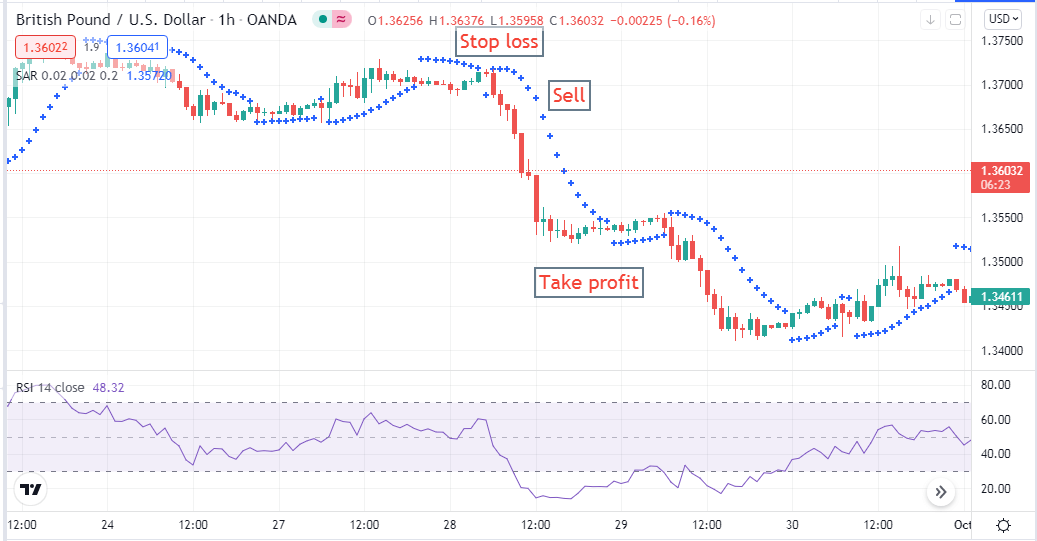
Bearish trade setup
If the conditions above are true, wait until closing the current bearish candle and place a sell order — place stop loss above the recent swing high with a buffer of 5-10 pips. Close the sell order when the Parabolic SAR dot appears below price candles.
Long-term trading strategy
You can place long-term trades by using the RSI indicator. We use two exponential moving averages besides the RSI indicator in our long-term trading strategy.
We use a red EMA (9) and a green EMA (21) to confirm our entry and exit positions. This combination of the RSI indicator and EMA signal lines makes a complete trading method. This strategy works fine in any time frame chart; we recommend the daily chart to apply.
Bullish trade setup
This strategy confirms a bullish signal when:
- The red EMA line crosses above the green EMA line.
- The RSI dynamic signal line is above the middle (50) line and heading toward the upper (70) line.
Bullish trade setup
If the conditions above are true, wait for the current bullish candle to close, then place a buy order. Initial stop loss will be below the recent swing low with a buffer of 10-15pips.
Close the buy position when:
- The red EMA line crosses below the green EMA.
- The RSI dynamic signal line moves toward the middle (50) line from the upper (70) line.
Bearish trade setup
This strategy confirms a bearish signal when:
- The red EMA line crosses below the green EMA line.
- The RSI dynamic signal line is below the middle (50) line and heading toward the lower (30) line.
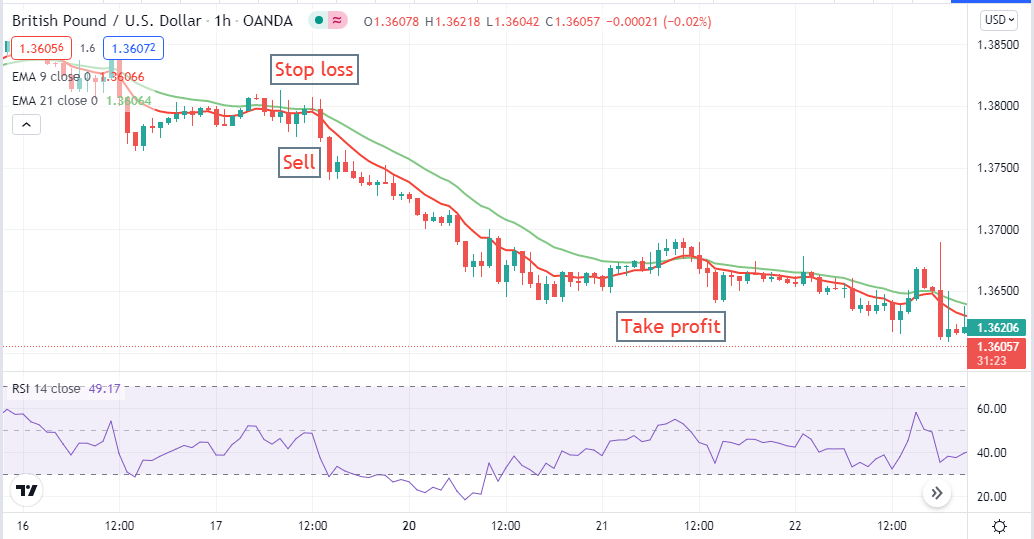
Bearish trade setup
If the conditions above are true, wait for the current bearish candle to close, then place a sell order. Initial stop loss will be above the recent swing high with a buffer of 10-15pips.
Close the sell position when:
- The red EMA line crosses above the green EMA.
- The RSI dynamic signal line moves toward the middle (50) line from the lower (30) line.
Final thought
Finally, now you know all the basics about the Relative Strength Index indicator. The RSI indicator works fine with many financial assets. You can use it with a combination of many other technical indicators such as Parabolic SAR, EMAs, Bollinger Bands, MACD, etc. We suggest doing sufficient practice at the demo trading before starting real trading with any trading method.


Comments