
Trading with the trend is an injunction you will often receive from traders and authors anywhere online, from blogs, video streaming sites, forums, etc. We all have our interpretations of what a trend means. Many traders use moving averages to define it, while others utilize price action.
This article takes a simplistic approach to trade the trend continuation wave as presented on that website. Then they utilize an entry method called three-point turn to enter the trade. A three-point turn is a name they give to the 1-2-3 pattern.
What is the trend continuation wave?
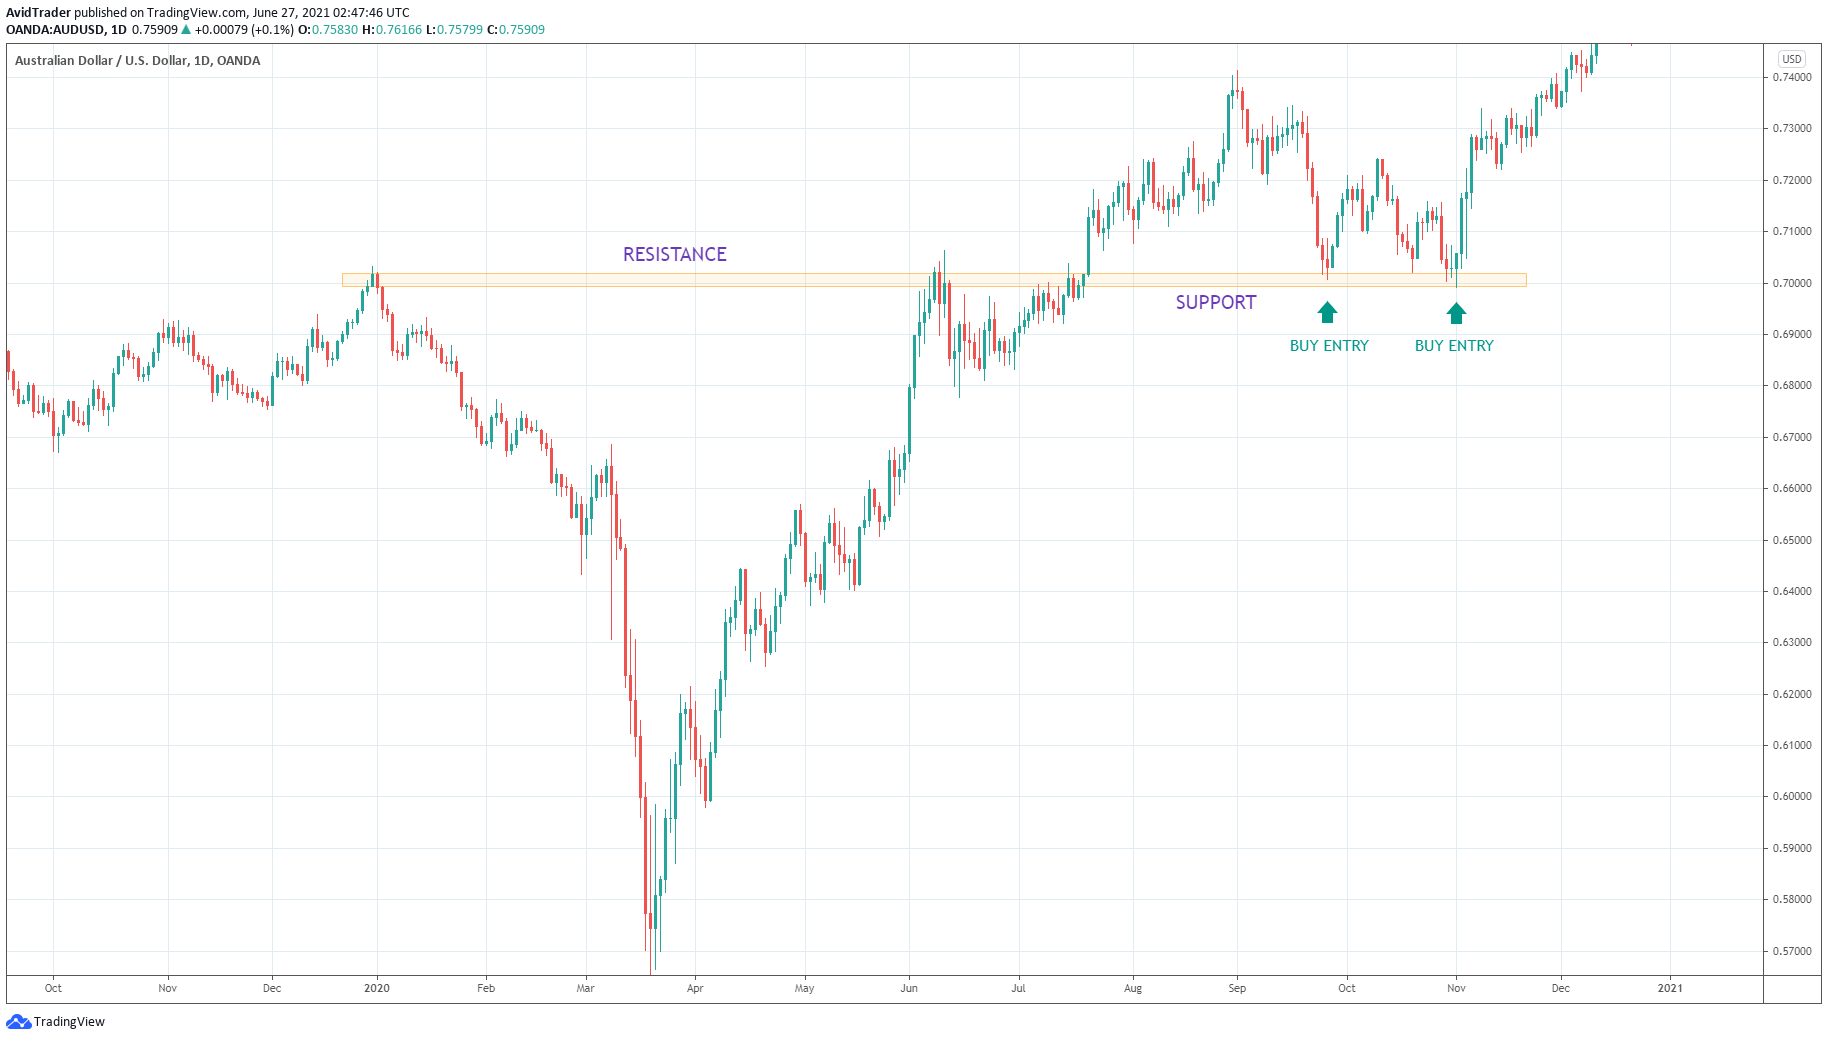
Most traders look for the break-and-retest setup. The latter setup is fairly known in the trading community as a reliable trading opportunity. It is in line with the widely recognized concept that previous support can turn into later resistance and vice versa.
Refer to the AUD/USD daily chart above. It shows an excellent example of the break-and-retest setup. The area of support and resistance is self-explanatory. We draw it at the significant swing points.
However, what happens when price breaks support or resistance during retest?
Of course, you will pass up the trade and look for another trade opportunity. However, had you been aware of it, there is still hope for a trend play as long as the price does not break the trend structure.
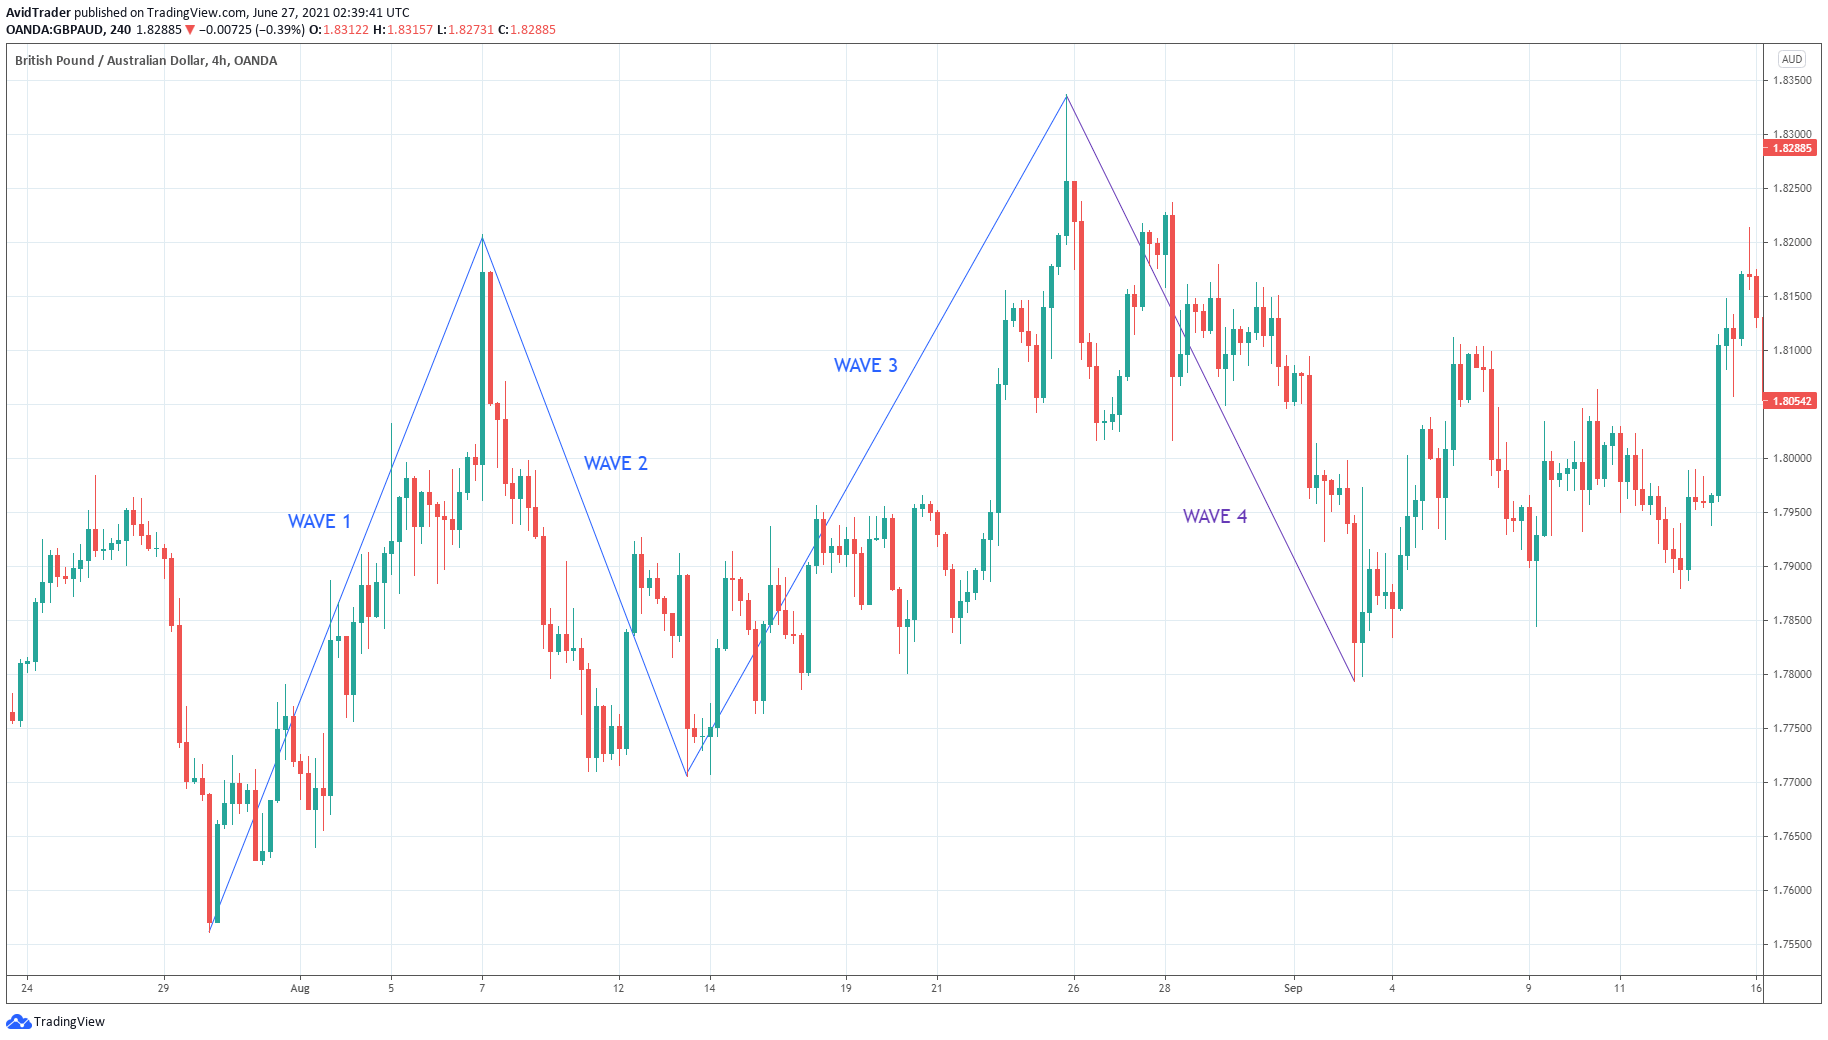
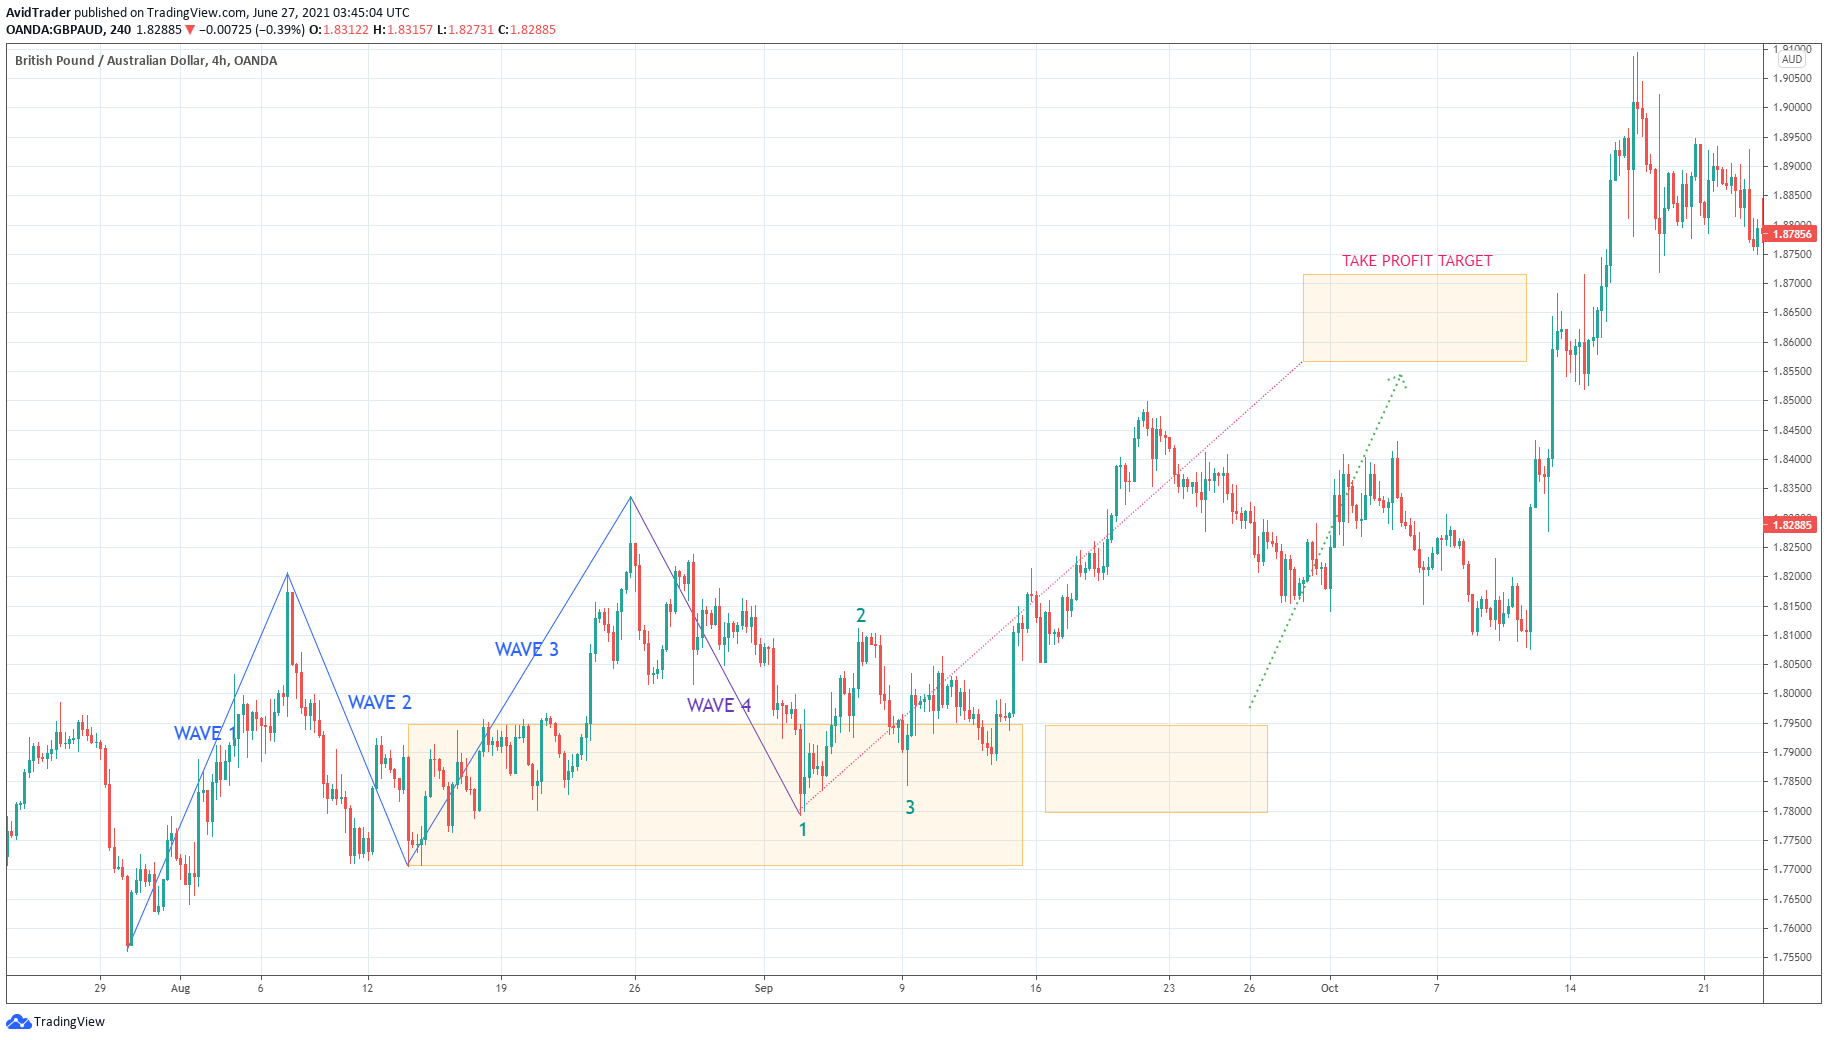
Refer to the above GBP/AUD H4 chart. It shows a bullish market through the lens of price action. As long as the market structure defined by higher high and higher low is in place, the trend is intact.
The above chart is a representation of the trend continuation wave pattern. As you can see, the wave comprises four waves. Wave one and three are impulses, while wave two and wave four are corrective. However, there is an essential dynamic between waves two and four that you must understand.
We outline the crucial differences below:
- Wave four is more significant than wave two.
- Wave two is just a correction of wave one.
- Wave four is a correction of the whole structure composed of three waves (waves one, two, three).
- Wave four is more significant in importance than wave two in terms of predictive power. There is a greater chance of a trend continuation to the upside after wave four than wave two.
A closer look at the trend continuation wave
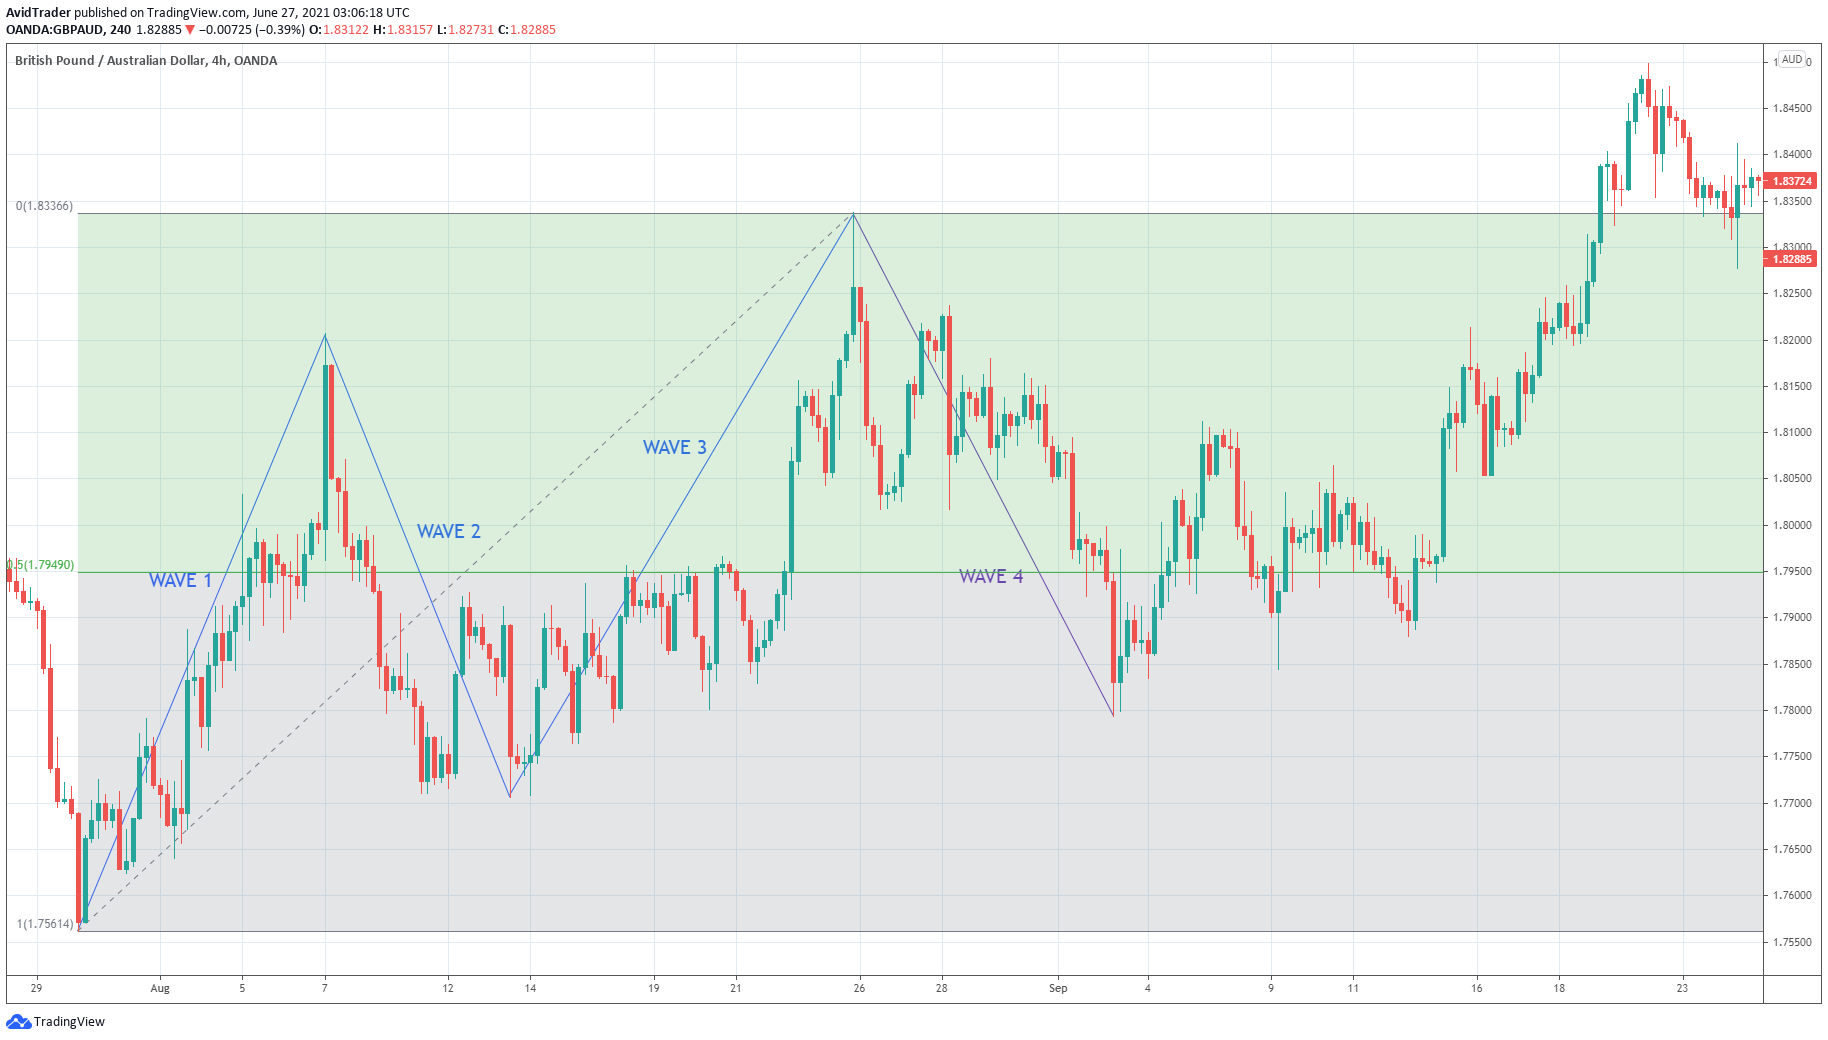
We can make our identification of the trend continuation wave more precise by making measurements. Refer again to the above chart. Here we use the Fibonacci retracement tool with nothing but the 50% retracement. We put the first anchor point of the fib tool at the starting point of wave one and the second anchor point at the ending point of wave three.
The purpose of this is to determine where wave four might end as it begins to form. Therefore, wave four is a retracement of the previous three waves and not simply a pullback of the previous wave (wave three).
When wave four touches the 50% retracement point of the whole 1-2-3 wave structure, you can already tell that a trend continuation wave pattern is in the works. The next thing to do is wait for wave four to stabilize and show signs of reversal.
How to trade the trend continuation wave
To make the chart cleaner, we replace the Fibonacci tool with a rectangle in the above chart. The 50% retracement of the whole structure aligns with the upper boundary of the rectangle. We anchor the lower edge to the endpoint of wave two. Usually, we do not want prices to get past this point. Otherwise, the uptrend structure of higher high and higher low is broken.
After wave four entered the rectangle, the price made a strong reaction by bouncing upward. This shows that this area has strong support. There are many ways to enter a trade with the trend continuation wave pattern.
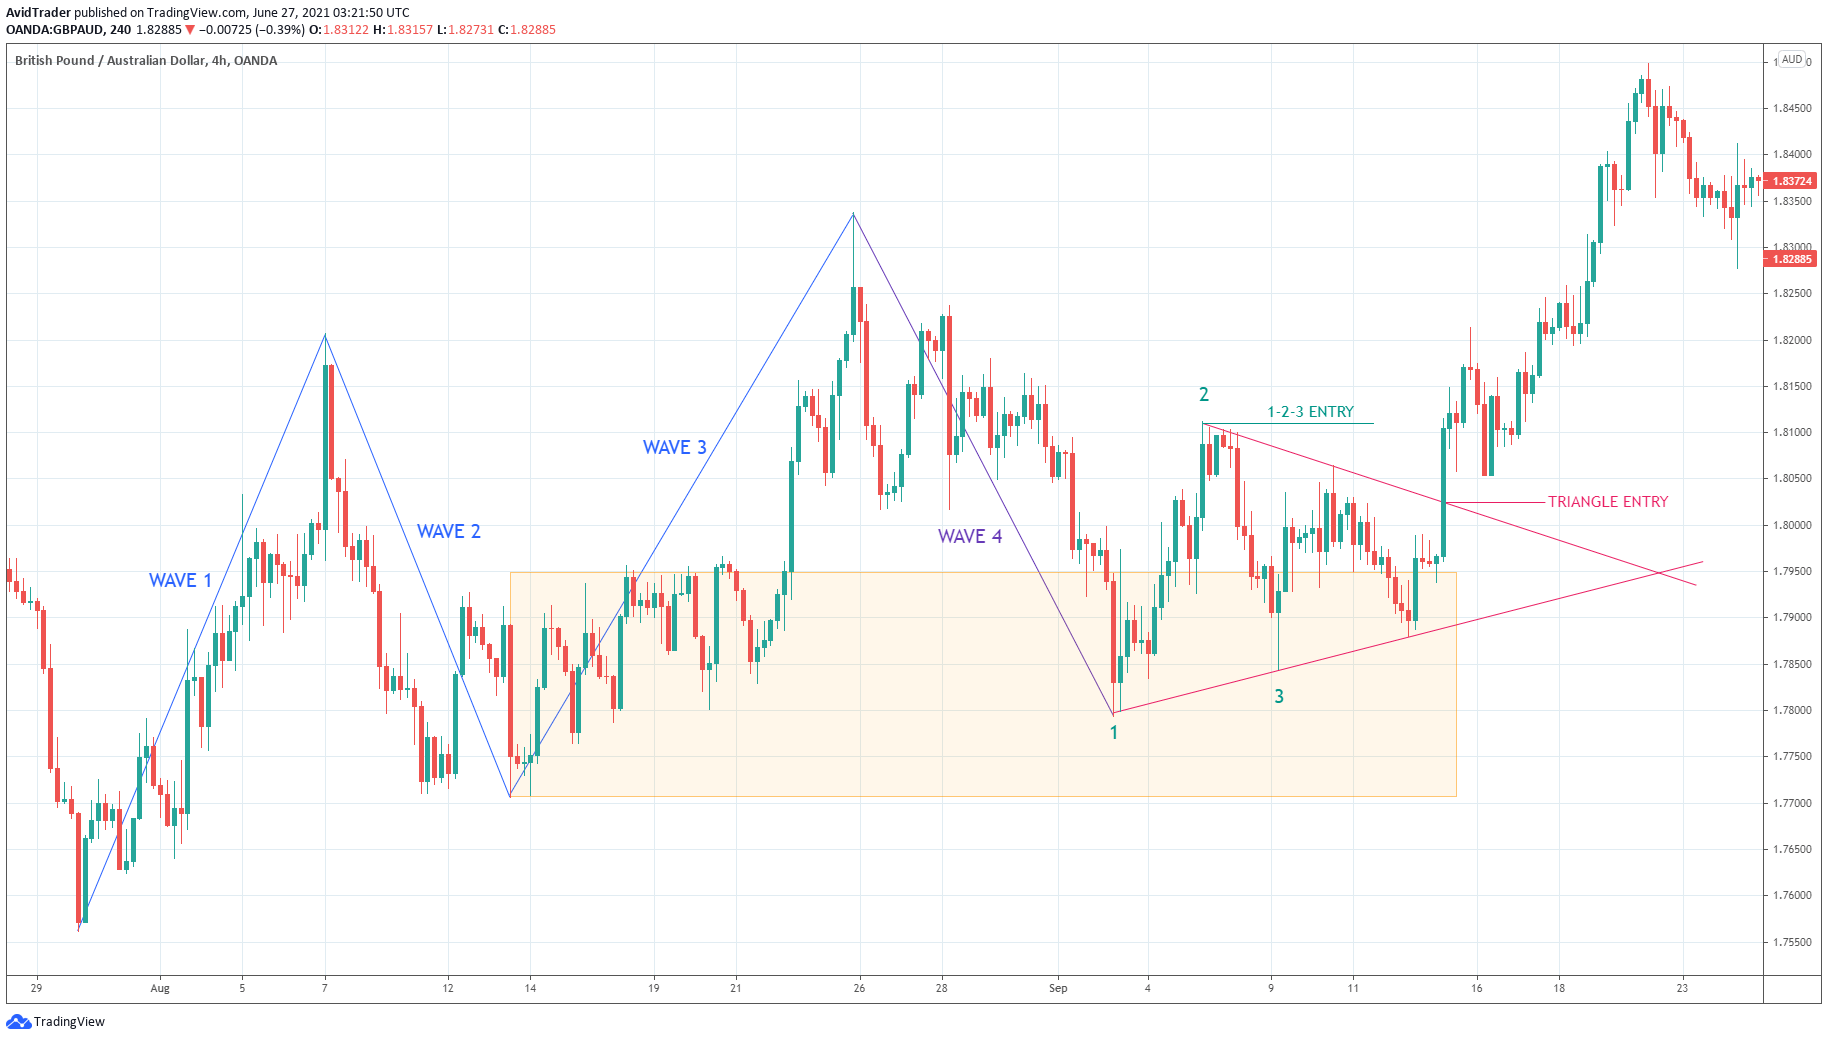
We offer two entries below:
- 1-2-3 pattern
- Triangle
Your first entry option is the bullish 1-2-3 pattern that forms as a price reaction when it tests the support area. Use a buy stop order at point 2 to enter the market. This entry is logical in this scenario, though not optimal. A better entry comes later when price forms a symmetrical triangle. Your entry comes about when the price starts breaking out above the triangle. So this gives you a better entry price than the 1-2-3 pattern does.
Apart from the two entries provided in the previous paragraph, there are other options you can use. This includes bullish divergence using MACD, TDI, RSI, stochastic, or another indicator. Another excellent entry is a slight trend continuation wave that forms at the end of wave four.
However, it would be best to use multiple time frame analysis to see the miniature pattern in a lower time frame. A candlestick pattern is also a viable entry option.
Trend continuation wave exit
The next logical question is this: where would you put your stop loss and take profit? The best “stop” location is point three, padded at least with the spread at entry time. On the other hand, you have more leeway as to how to take profit. Here you can use a trailing stop or a fixed reward-risk ratio.
However, you do not have to look elsewhere for an exit strategy because the trend continuation wave contains one. This strategy is uncommon and quite complex, but it is good working. The above GBP/AUD H4 chart shows such an example.
Determining the take profit price follows this process:
- Draw a trend line from the starting point of wave one to the ending point of wave three.
- Copy this line and align its beginning point with the ending point of wave four. This is the projected line.
- Get the difference between the 50% retracement point and endpoint of wave four. Use a box or a rectangle for this purpose.
- Copy this box and add it to the ending point of the projected line in step two. The take-profit objective is the upper boundary of the copied box.
If you have taken this trade, it will take time before your trade hits the target. Your long wait is not in vain, however. You could have gained around 700 pips for this trade! That is a decent amount of gain, to begin with.
Final thoughts
Now you have another price action strategy that you can add to your trading repertoire. Spend time analyzing your charts to look for entries using the trend continuation wave. This might take your trading to another level. What makes it very attractive is the potential for a high reward over the risk per trade.


Comments