
Ichimoku cloud is a sophisticated trading indicator that can provide an accurate price direction using its multiple components:
- Tenkan Sen
- Kijun Sen
- Spans
However, it was built for the stock market that needs a small change in settings before crypto trading. The following section will see the complete Ichimoku trading guide, including the setting and example.
What is the crypto-optimized Ichimoku cloud strategy?
This strategy applies to the stock market, where the indicator setting comes from the number of trading days in a month. The Ichimoku cloud is a complex indicator; it needs a deep knowledge of every tool with settings.
Let’s see the primary setting for the Ichimoku cloud setting for the crypto market.
| Tool name | Default value | Crypto-optimized value |
| Tenkan Sen | 9 | 10 |
| Kijun Sen | 26 | 30 |
| Senkou Span A | ||
| Senkou Span B | 52 | 60 |
| Cloud displacement | 26 | 30 |
| Lagging Span | 26 | 30 |
Now move to a trading chart of BTC/USD and implement these settings on the Ichimoku indicator.
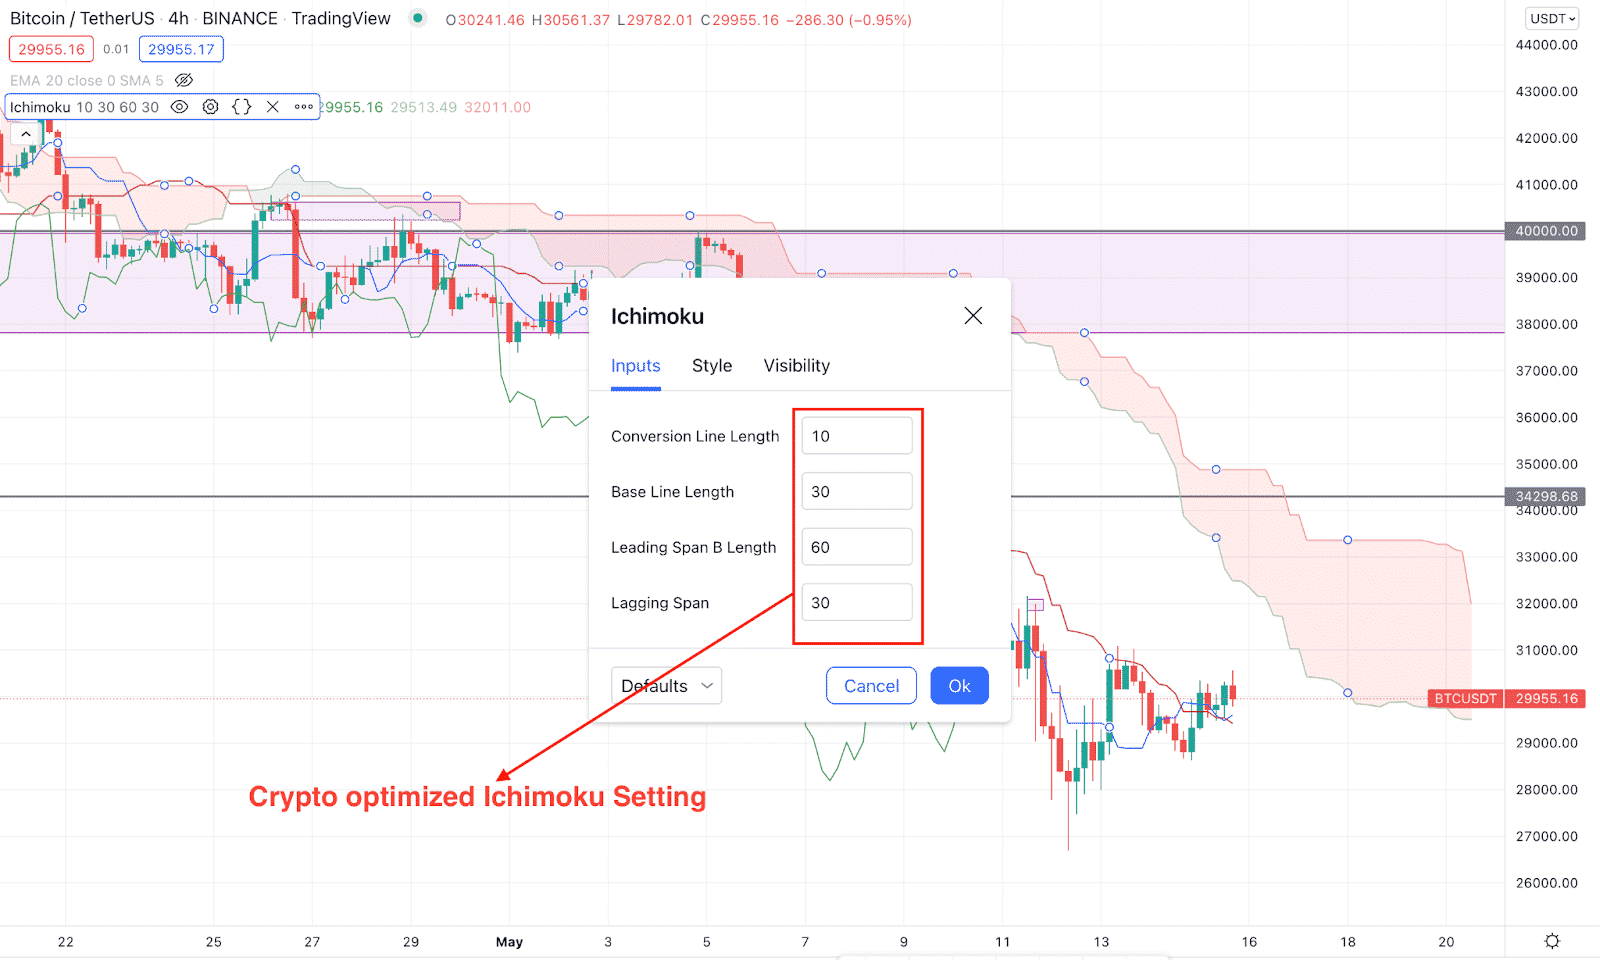
Crypto optimized Ichimoku setting
How to trade using the crypto-optimized Ichimoku?
The main reason for changing the Ichimoku value is that the crypto market runs 24/7 with no weekends. In the default setting, the indicator is optimized for the stock market, where the number of trading days in a month is 26, as used in Tenkan Sen. Moreover, the Leading Span B length was changed to 60 to cover two months.
The basic trading approach using the crypto-optimized Ichimoku strategy is anticipating the crypto price movement based on all Ichimoku tools. The Dynamic Tenkan Sen and Kijun Sen work as dynamic support and resistance to the price, while the cloud is the ultimate barrier to a trend. Moreover, the future price action can be determined using the future cloud’s thickness and direction.
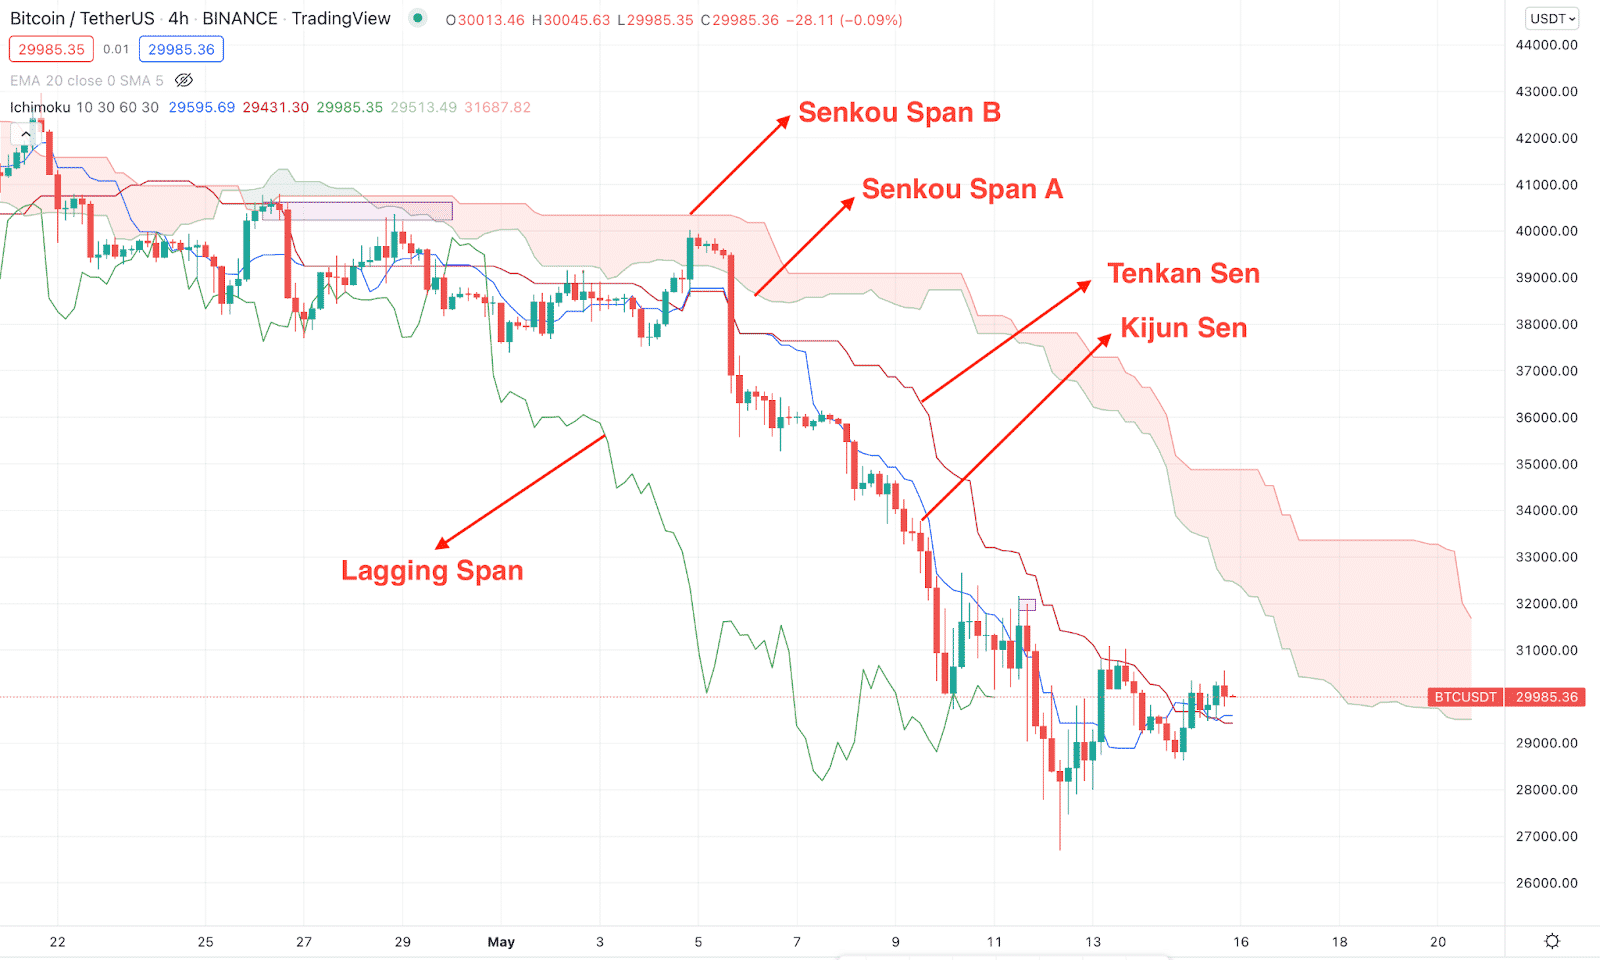
Ichimoku elements
A short-term trading strategy
In this method, we will use the intraday trading approach using the Ichimoku cloud, where the primary aim is to find where the long-term trend is heading. After that, we will wait for a minor correction in the lower-time frame chart and open trades.
Bullish trade scenario
It is applicable when the long-term outlook of the crypto market is bullish. In that case, the daily trend should show buy signals by trading above any support level.
Entry
Before opening a buy trade, make sure to follow these steps:
- The long-term daily or H4 price should remain above the Kumo Cloud, indicating a bullish long-term direction.
- The price moves lower in the 15 minutes chart but reverses from the Cloud area.
- The bullish trade is valid once there is an M15 candle above the Kijun Sen.
Stop loss
The conservative stop loss is below the Kumo Cloud, while the aggressive stop loss is below the immediate swing low.
Take profit
The first take profit is the near-term swing high, but further profit possibility is valid if the buying pressure from the entry price is impulsive.
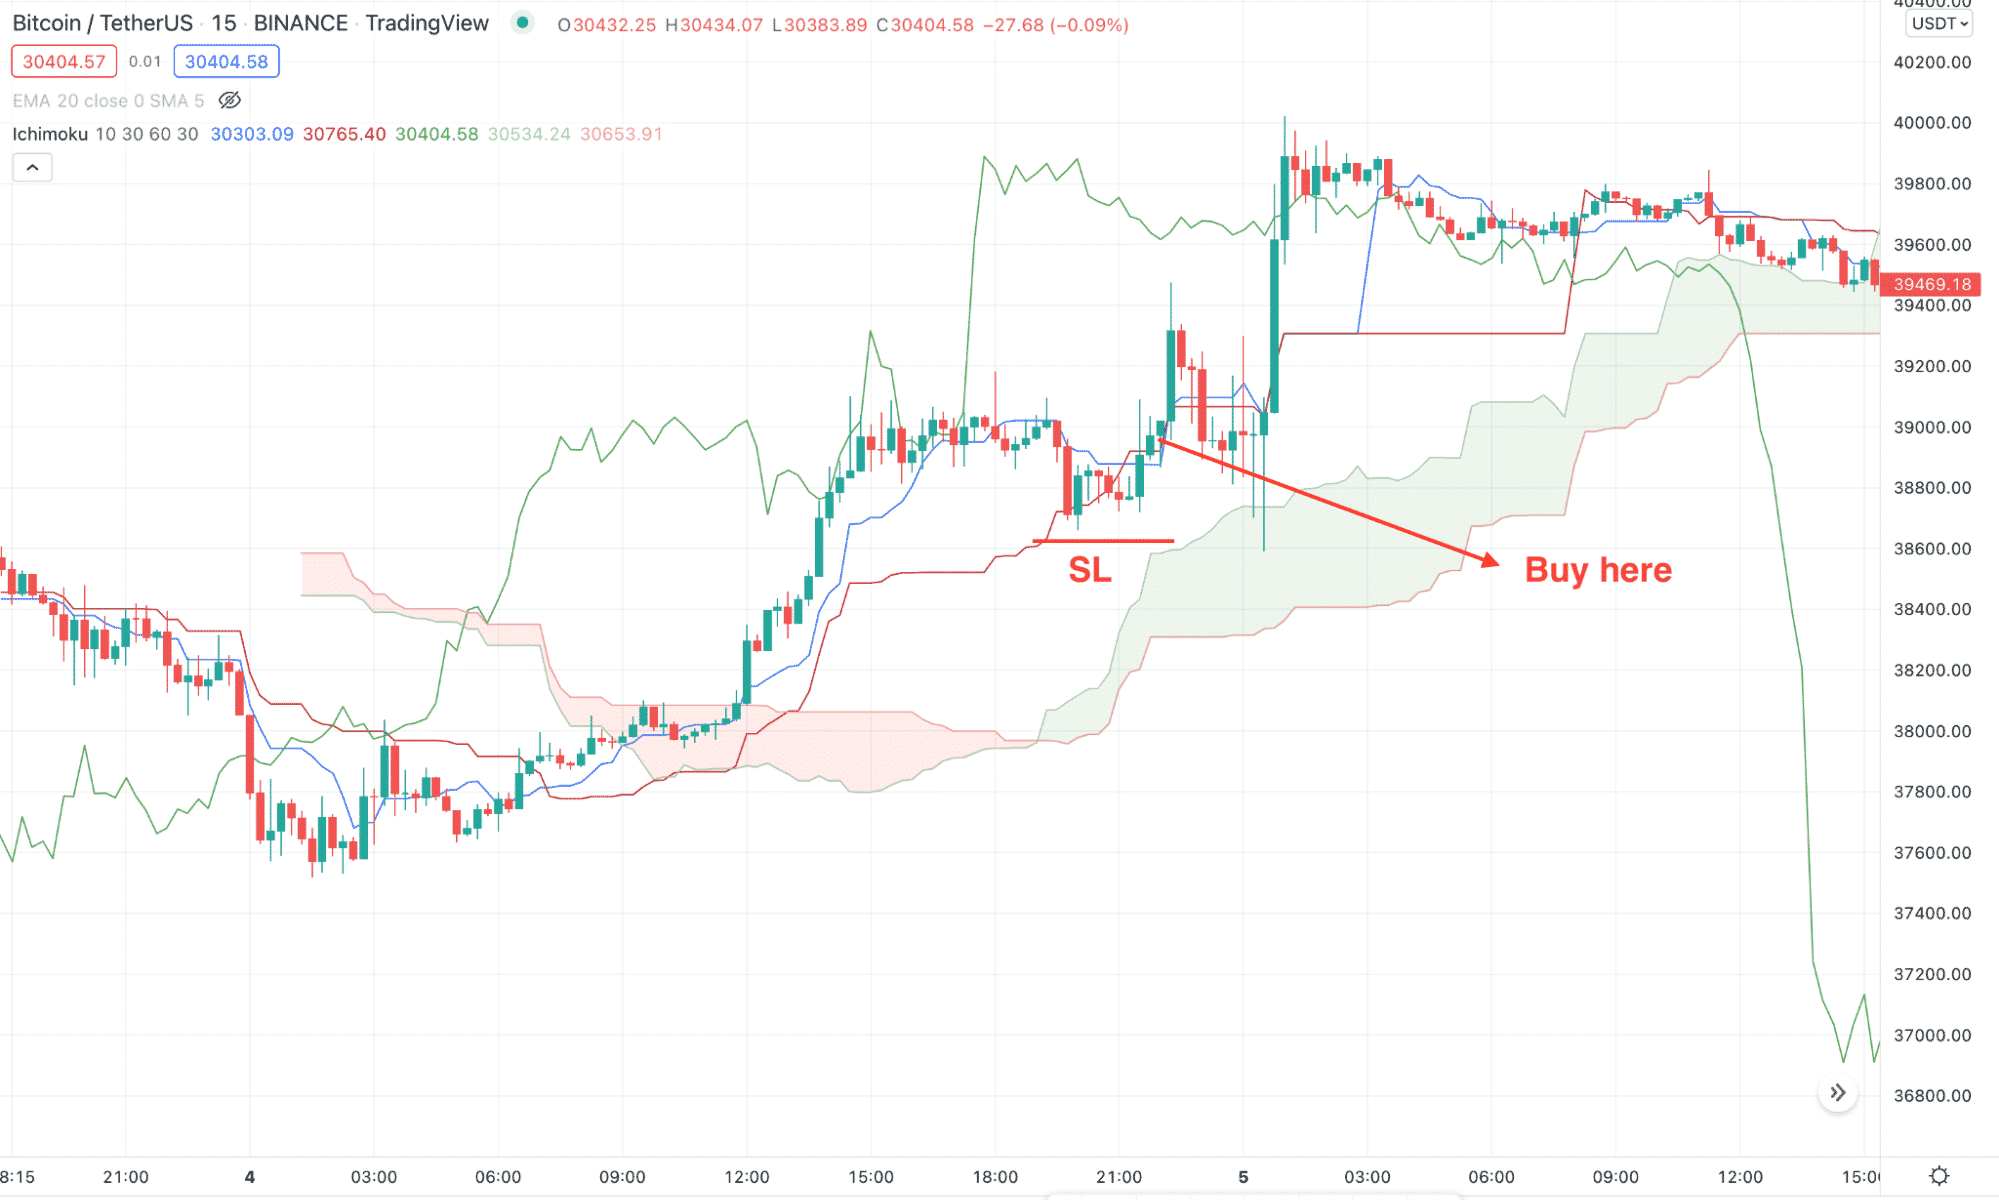
Short-term buy trade
Bearish trade scenario
The bearish short-term trade is applicable when the long-term outlook of the crypto market is bearish.
Entry
Before opening a bearish trade, make sure to follow these steps:
- The long-term daily or H4 price should remain below the Kumo Cloud, indicating that the long-term direction is bearish.
- The price moves higher in the 15 minutes chart but reverses from the Cloud area.
- The bearish trade is valid once there is an M15 candle below the Kijun Sen.
Stop loss
The conservative stop loss is above the Kumo Cloud, while the aggressive stop loss is above the immediate swing high.
Take profit
The first take profit is the near-term swing low, but further profit possibility is valid if the long-term trend remains strongly bearish.
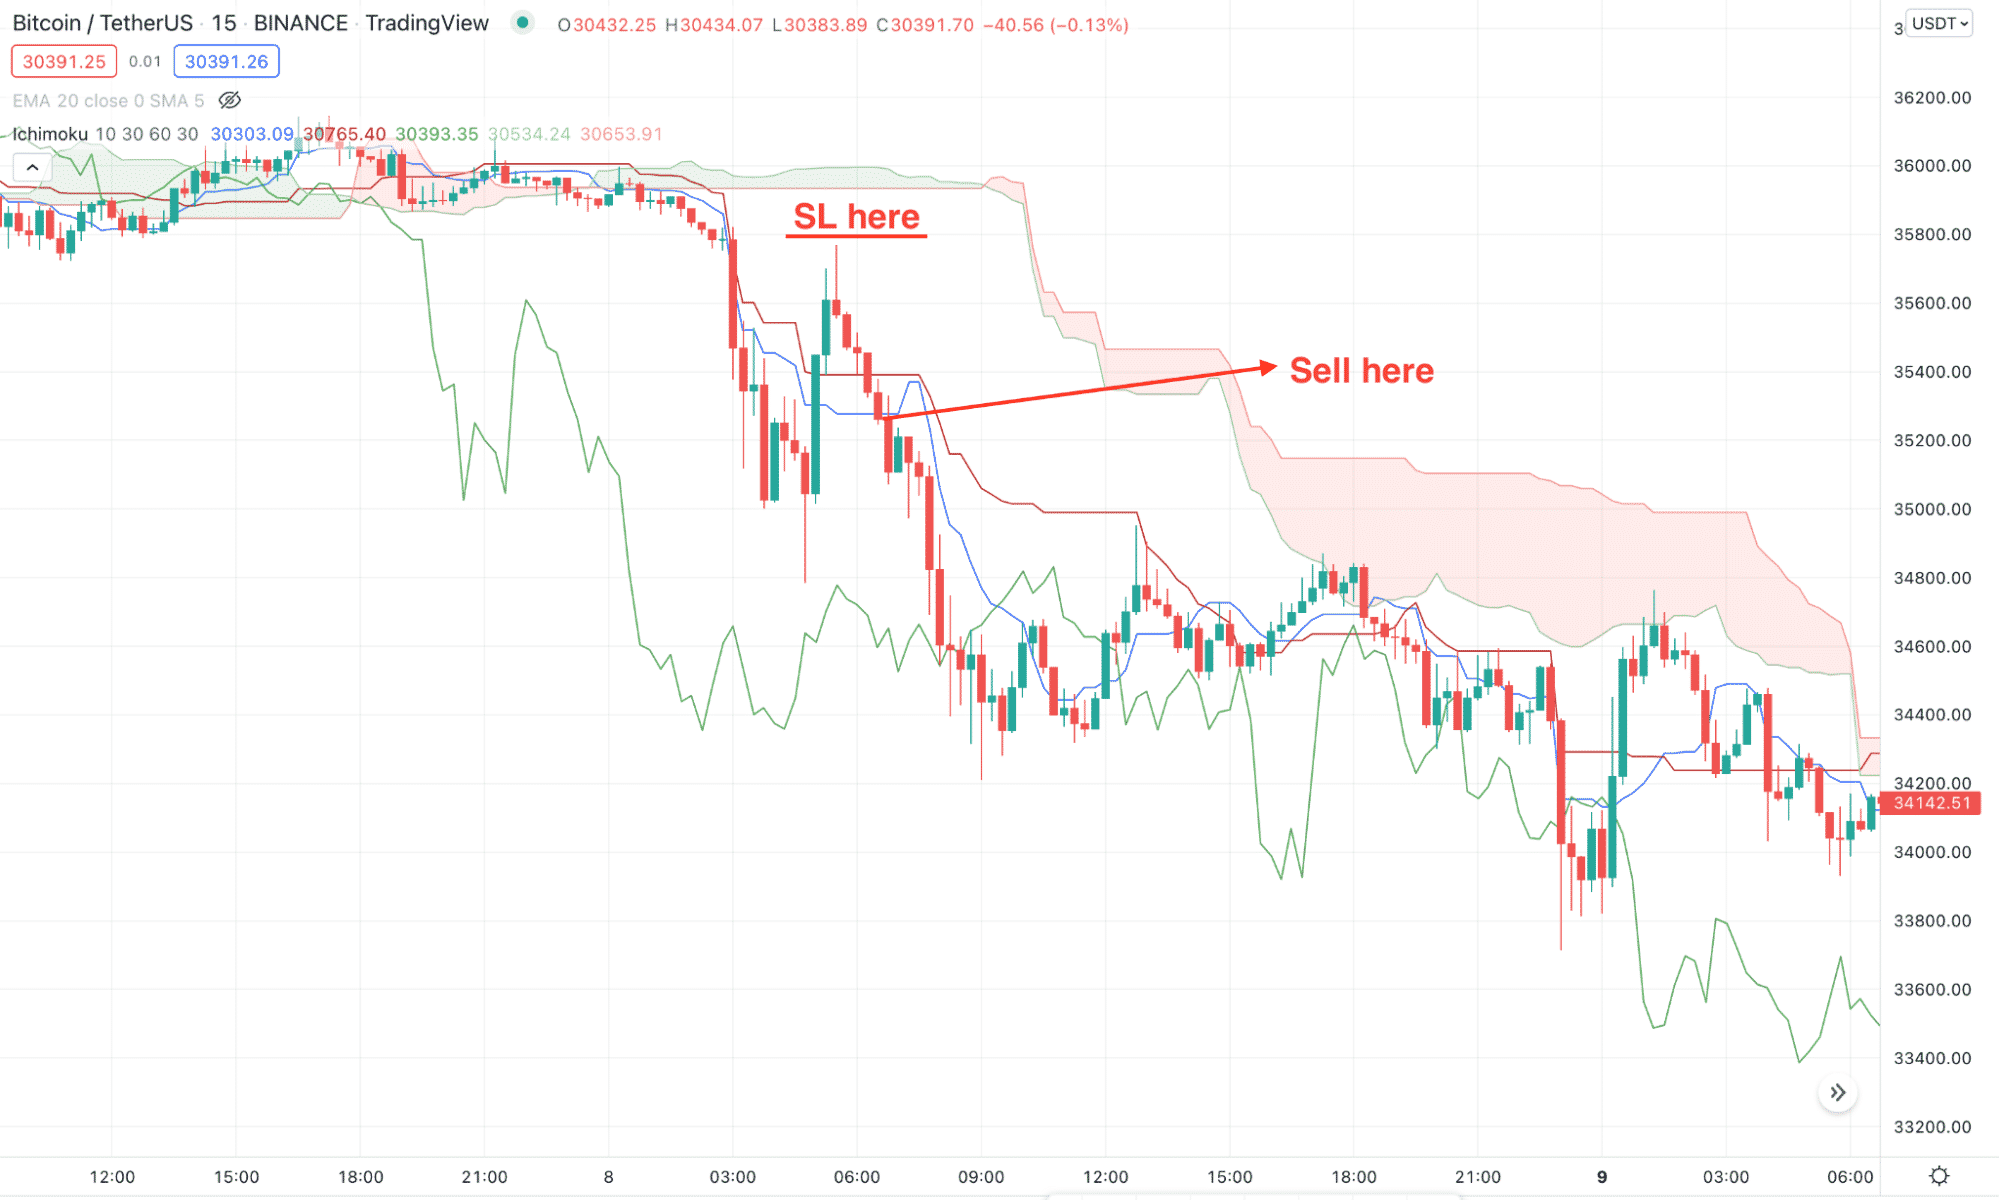
Short-term sell trade
A long-term trading strategy
After finding a solid breakout from the Kumo Cloud in the long-term trading strategy, we will find bullish signals in the daily chart.
Bullish trade scenario
The bullish trade scenario needs a confirmation of trend change by shifting its direction from the Kumo Cloud. Later on, investors should open the trade after finding a considerable correction.
Entry
The bullish trading entry is valid once these conditions are present in the daily chart:
- The daily trend moves higher above the Kumo Cloud, indicating that the market trend shifted from bearish to bullish.
- The future cloud is bullish where the Senkou Span A is above the Senkou Span B.
- After making a new swing high, the price comes low and is rejected from the Dynamin Kijun Sen.
- The bullish trade is valid once the price shows a bullish rejection from the Kijun Sen line and closes with bullish momentum.
Stop-loss
The primary stop-loss is below the near-term swing low, but the buying sentiment may alter if the price moves below the Kumo Cloud.
Take profit
You can take 50% of the profit if the price moves 100% of the stop loss, but further buying possibility is valid if the buying pressure from the entry area is impulsive.
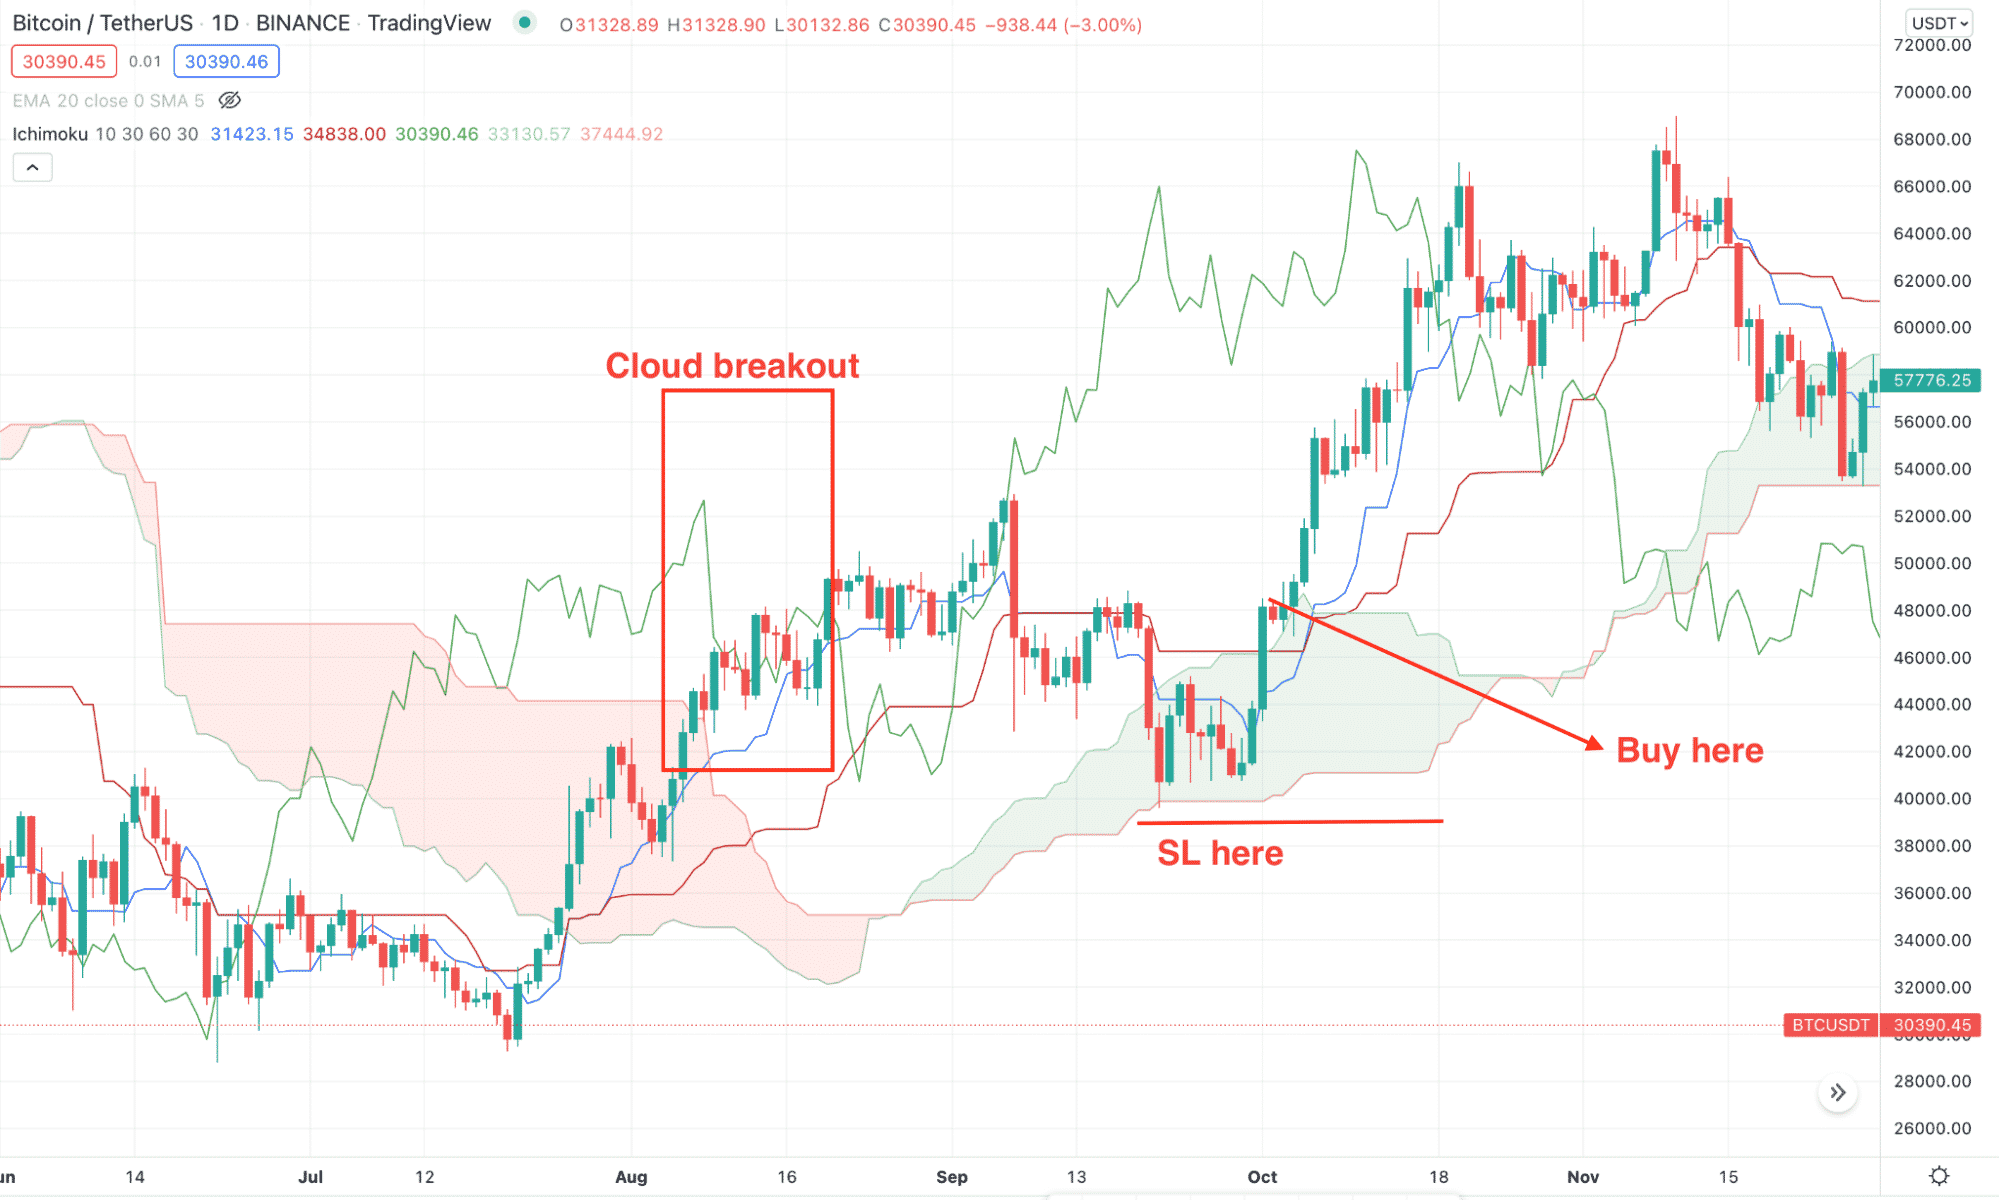
Long-term buy trade example
Bearish trade scenario
The bearish trade scenario needs a confirmation of trend change by shifting its direction from the Kumo Cloud on the downside.
Entry
The sell trading entry is valid once these conditions are present in the daily chart:
- The daily trend moves lower below the Kumo Cloud, indicating that the market trend shifted from bullish to bearish.
- The future cloud is bearish where the Senkou Span A is below the Senkou Span B.
- After making a swing low, the price moves higher and is rejected from the Dynamin Kijun Sen.
- The sell trade is valid once the price shows a bearish rejection with a candle close.
Stop-loss
The primary stop-loss is above the near-term swing high.
Take profit
You can take 50% of the profit if the price moves 100% of the stop loss, but further profit is valid if the selling pressure is impulsive.
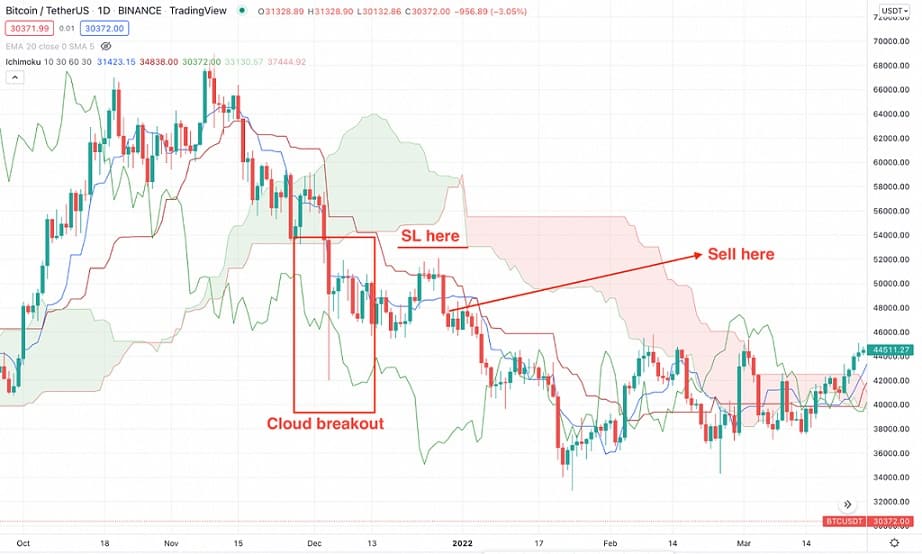
Long-term sell trade example
Pros and cons
| 👍 Pros | 👎 Cons |
|
|
|
|
|
|
Final thoughts
In the above section, we have seen how to set the crypto-optimized Ichimoku indicator with live trading examples. We need to ensure that every trading entry is unique in the financial market and requires the same attention as before. Therefore, utilizing the Ichimoku strategy with a better trade management environment would provide the maximum output from the market.


Comments