
If you want to anticipate the future price of a forex pair, you can do it by observing its past price. Technical analysis uses several tools that are built with logic and work as a vital element in trading. Parabolic SAR is a popular technical indicator to FX and stock traders. It is working as a core component. It is a way to analyze the market without looking at what is happening at the macro level.
Using indicators for successful trading involves particular skills. This article contains all about the Parabolic SAR indicator you need before using it. It includes examples of strategies with trading charts.
What is the Parabolic SAR?
This tool considered Parabolic SAR as a “stop and reversal” system. It is a program known as an indicator that can say what the market may move in the coming hours or days. It was invented by the person who made the RSI indicator. You can do it with this element to know how long the price may move or where the opposite party may come.
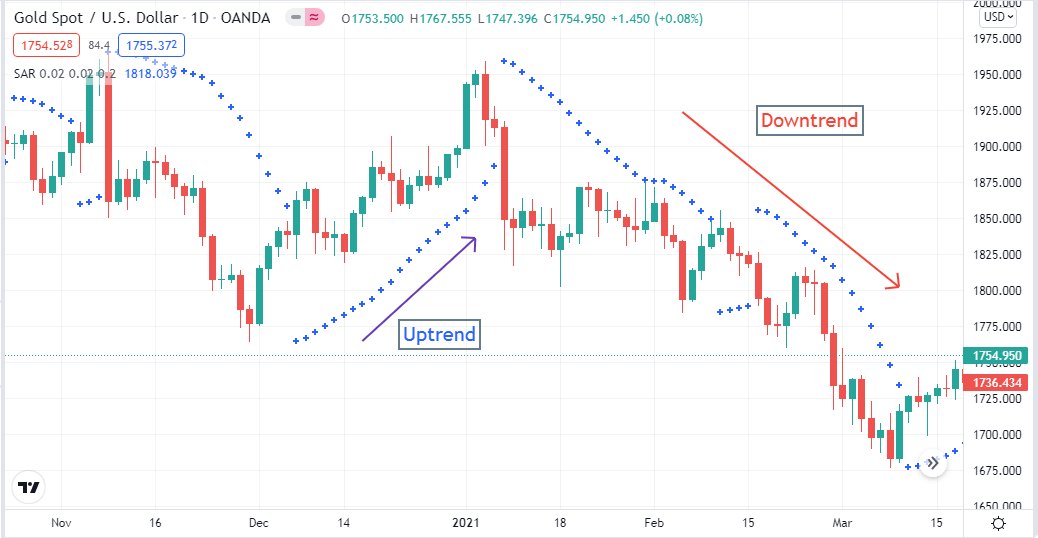
Different directions by PSAR in the 1-day chart of gold
This tool indicates different price directions by creating dots at different sides of price candles. In a bullish context, Parabolic dots will remain below candles. Conversely, dots will remain above price candles, indicating bearish price movement of the asset price. Price direction changes and the dots switch the position. So Parabolic SAR is so simple to understand and an easily adaptable technical indicator.
How to calculate the Parabolic SAR?
The calculation formula for rising Parabolic SAR has some difference with falling PSAR. The procedure is as below:
- RPSAR=Prior PSAR +
- [Prior AF(Prior EP-Prior PSAR)]
- FPSAR=Prior PSAR −
- [Prior AF(Prior PSAR-Prior EP)]
where:
- RPSAR = Rising PSAR
- AF = Acceleration factor starts at 0.02 and increases by 0.02, up to a maximum of 0.2, each time the extreme point makes a new low (falling SAR) or high (rising SAR)
- FPSAR = Falling PSAR
- EP = Extreme Point
Parabolic SAR trading strategies
You can trade with only Parabolic SAR as it generates complete trading ideas with exit and entry points. It is not wise to make trading strategies that depend on one indicator, as different indicators calculate differently and, in some cases, work with different types of market data. We suggest making strategies with parabolic SAR with other tools like MA’s, MACD, and RSI.
Parabolic SAR with moving average strategy
Moving averages (MA) are the most common indicator that traders use to make decisions for a long time. So when you combine these two, the parabolic SAR and MA values of any asset, you will get exceptionally accurate trading positions. We use different MAs of different periods to get potential trading positions in various time frame charts.
Short-term strategy
This part will show you how to trade with the combination of MAs and the Parabolic SAR in short-term trading. Firstly, check parabolic SAR, then MAs for confirmation. We use MAs of 21 and 8 periods in an hourly chart, beside Parabolic SAR.
Bullish trade setup
When the Parabolic SAR dot appears below the price candle, the price direction may be shifting to a bullish phase. For more confirmation, check the MAs. When the 8 MA or the red signal line crosses above the 21 MA or the blue signal line, that confirms buyer domination at the asset price. Wait until the next bullish candle above MA signal lines, then place a buy order.
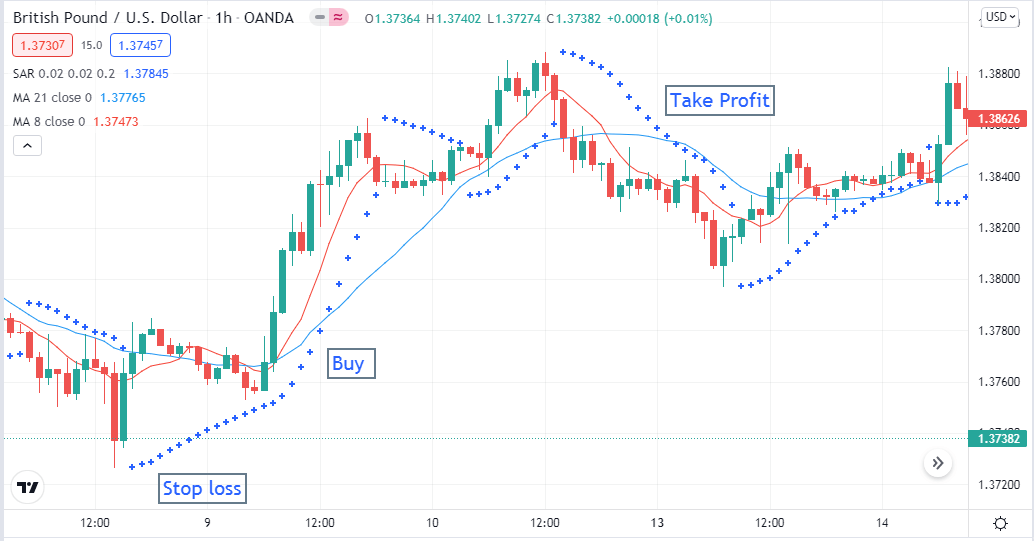
Short-term bullish trade setup
Initial stop loss will be below the recent swing low with a buffer of 5-10pips. Continue the buy order till the trend remains intact. Close the order when the Parabolic dot appears above price candles, and the opposite crossover happens between the MA signal lines.
Bearish trade setup
Check the Parabolic SAR dot that appears above price candles. For more confirmation, wait until the red MA line crosses below the blue MA line. Wait till the next bearish candle form, then place a sell order. Initial stop loss will be above the recent swing high with a buffering of 10-15pips.
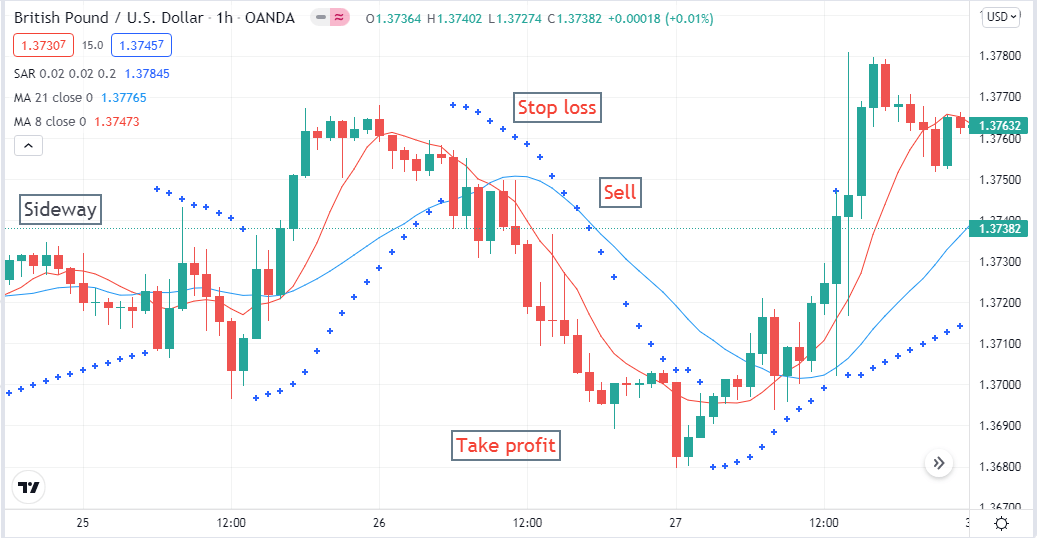
Short-term bearish trade setup
Close the sell order when PSAR dots appear below price candles, and the opposite crossover occurs between MA signal lines.
Long-term strategy
We use MAs of 50 and 21 with Parabolic SAR at the daily chart to get long-term trading positions.
Bullish trade setup
Match the reading of the indicators PSAR dots start to appear below price candles. Check the red MA or 21 MA line cross above the blue MA or 50 MA that confirms bullish pressure on the asset price. Wait till the recent bullish candle closes, then place a buy order.
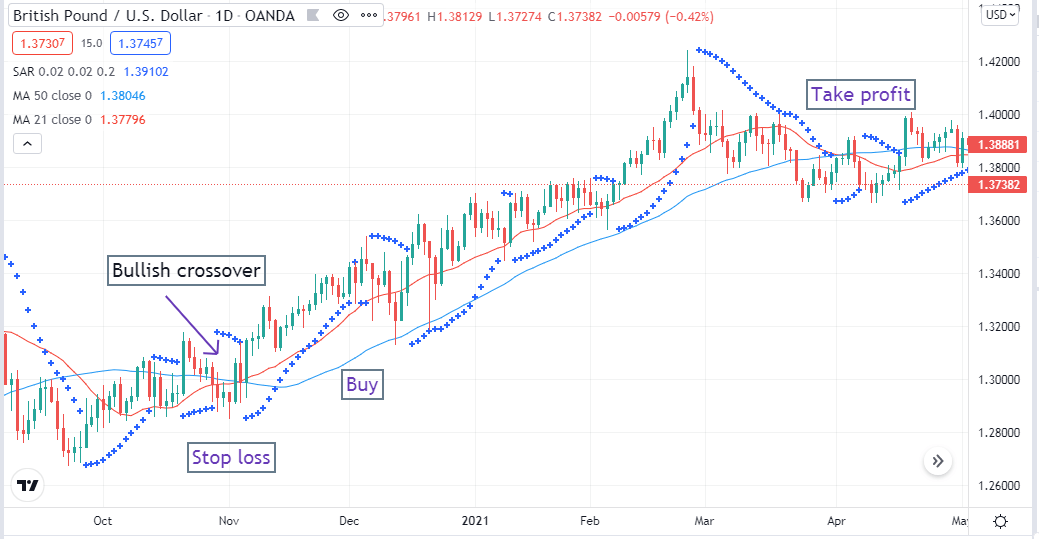
Long-term bullish trade setup
Stop loss will be below the recent swing low with a buffer of 15-20pips. The closing position is when PSAR dots appear above price candles, and the opposite crossover happens between MA signal lines.
Bearish trade setup
PSAR dots appear above price candles that indicate seller domination on the asset price. Check the MA signal lines for more confirmation. If the red MA line crosses below the blue signal line, it confirms starting a bearish trend. Wait until the current candle closes, then place a sell order.
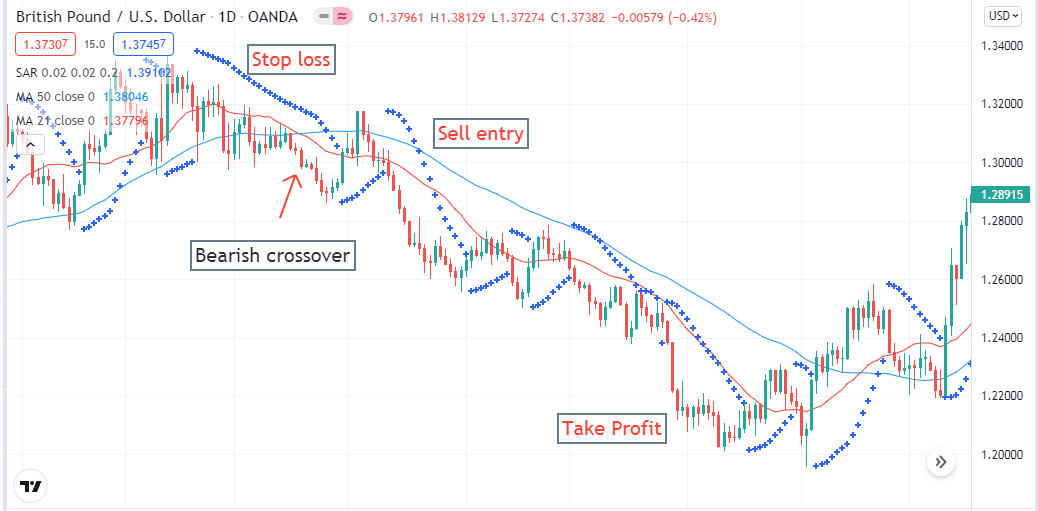
Long-term bearish trade setup
Your sell order is safe till the downtrend remains intact. Put stop loss above the recent swing high with a buffer of 15-20pips. Close the sell order when PSAR dots appear below price candles, and an opposite crossover occurs between MA signal lines.
Pros and cons of the Parabolic SAR with moving average strategy
Like all other trading strategies, this strategy also has some drawbacks with potentialities.
Pros |
Cons |
|
|
|
|
|
|
Final thoughts
These are potential trading strategies that can generate profitable trading positions. We suggest practicing these strategies on demo charts before applying them in actual trading. Check the readings from indicators before making entries. Follow money and trade management rules to reduce risks and increase profitability.


Comments