
McClellan oscillator is a trading indicator effective in finding the price momentum of a crypto trading asset. Sherman and Marian McClellan created it; thus, it has got the name ‘McClellan‘. The basic formula of the oscillator is to deduct the 39-day exponential MA out of the 19-day exponential MA of Net Advances.
According to this formula, it is a momentum indicator resembling the mechanism of MACD. Therefore, it shows trading signals from breadth thrusts, divergences, and centerline crossovers, applicable to any crypto asset and on any time frame.
If you are interested in building a trading portfolio using this indicator, the following section is for you. Here we will see the McCellan trading guide, including buy and sell methods.
What is the McClellan oscillator?
It is a market breadth indicator based on the subtraction of advanced and declined numbers. It moves in a separate trading window where the oscillator moves upward or rises from a neutral point. Besides, when the oscillator moves downward, declines are in control, and the overall market goes downwards.
However, it is almost similar to the traditional MACD for the Advance/Decline line, where the green and red zones show the current trend. If the oscillator forms a green zone above the neutral line, the market sentiment is buying. On the other hand, if the indicator shows a red zone below the neutral line, investors should focus on sell trades only.
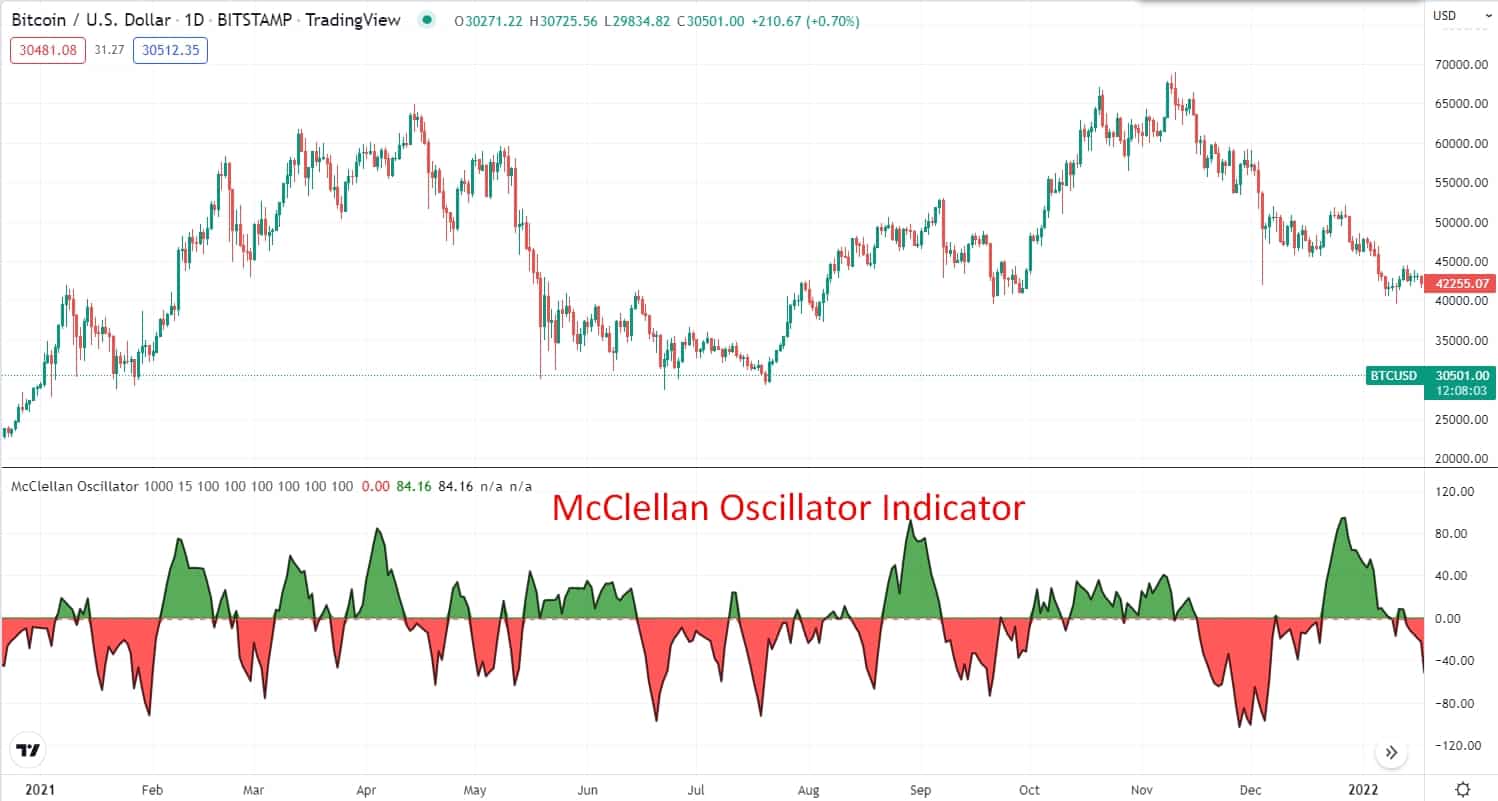
Indicator on the chart
How to trade?
This oscillator is a market breadth-based indicator. It may help investors to find where the price is heading for a particular asset. Moreover, analysts can combine other technical tools for assessing the strength of the current trend in the crypto market.
The positive and negative values represent whether average volumes are increasing or decreasing.
- It may show a bullish signal if the 39-day EMA moves below the 19-day EMA.
- On the contrary, it might provide a negative sentiment when the 39-day EMA is above the 19-day EMA.
However, a positive and advancing indicator indicates accumulated assets on the exchange. Besides, the negative and falling tool indicates the assets being sold, and this kind of movement validates the market’s current trend.
A short-term trading strategy
Th strategy has been built based on the breakout. This trading method will add the 20 EMA indicator and this oscillator to identify the breakouts. However, this strategy will apply to the M5 and the M15 time frame.
Bullish trade scenario
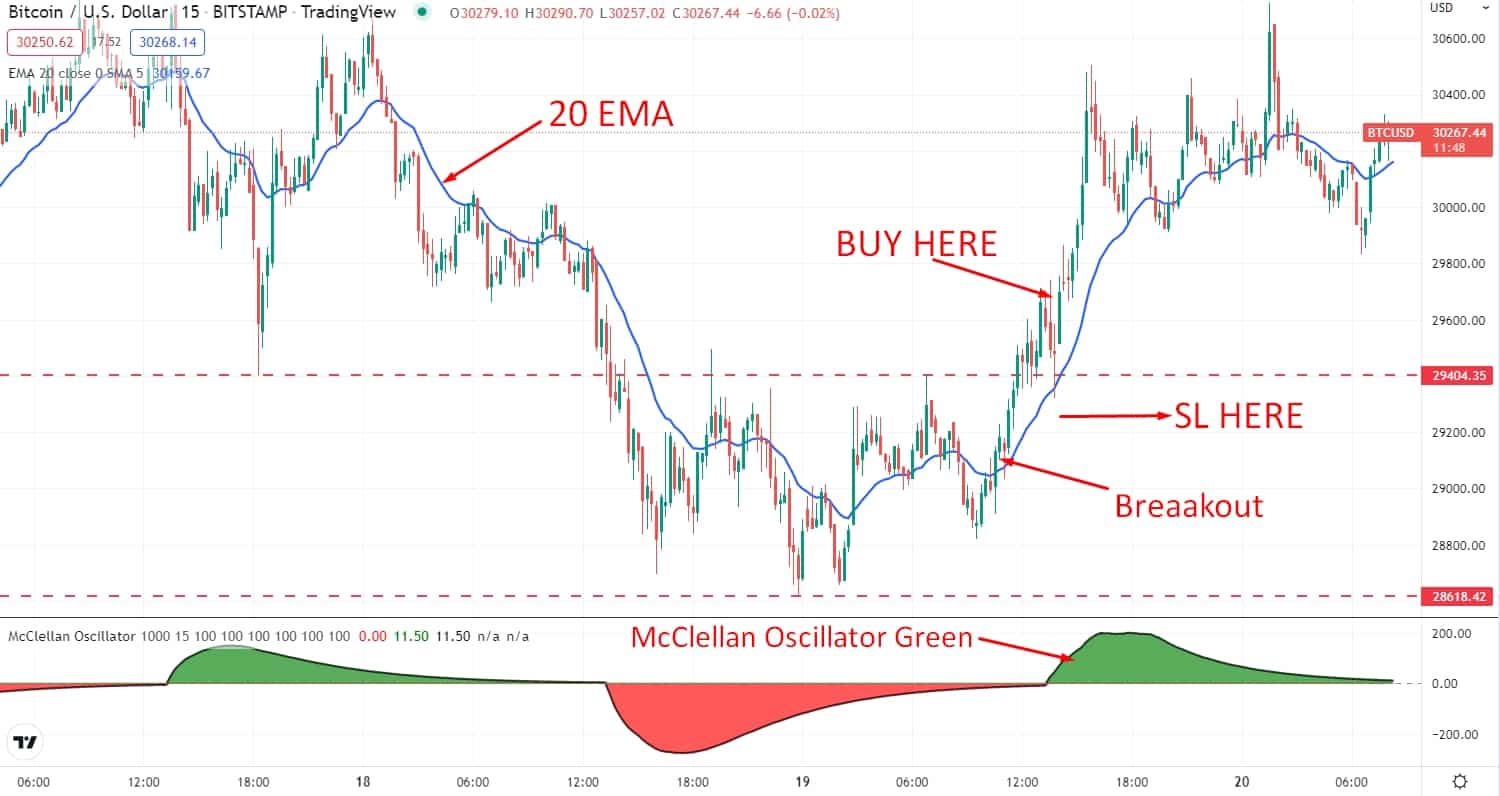
Short-term bullish trade scenario
Entry
Look for the price to break above the dynamic level from downside to the upside, and the oscillator indicator is green in color. But when the price returns to the dynamic level of 20 EMA and has a bullish candle close.
Stop-loss
Place the stop loss order below the dynamic level of 20 EMA with at least a 5-10 pips buffer.
Take profit
Take the profit by calculating at least a 1:3 risk/reward ratio. Otherwise, you can take the profit when the price breaks below the 20 EMA.
Bearish trade scenario
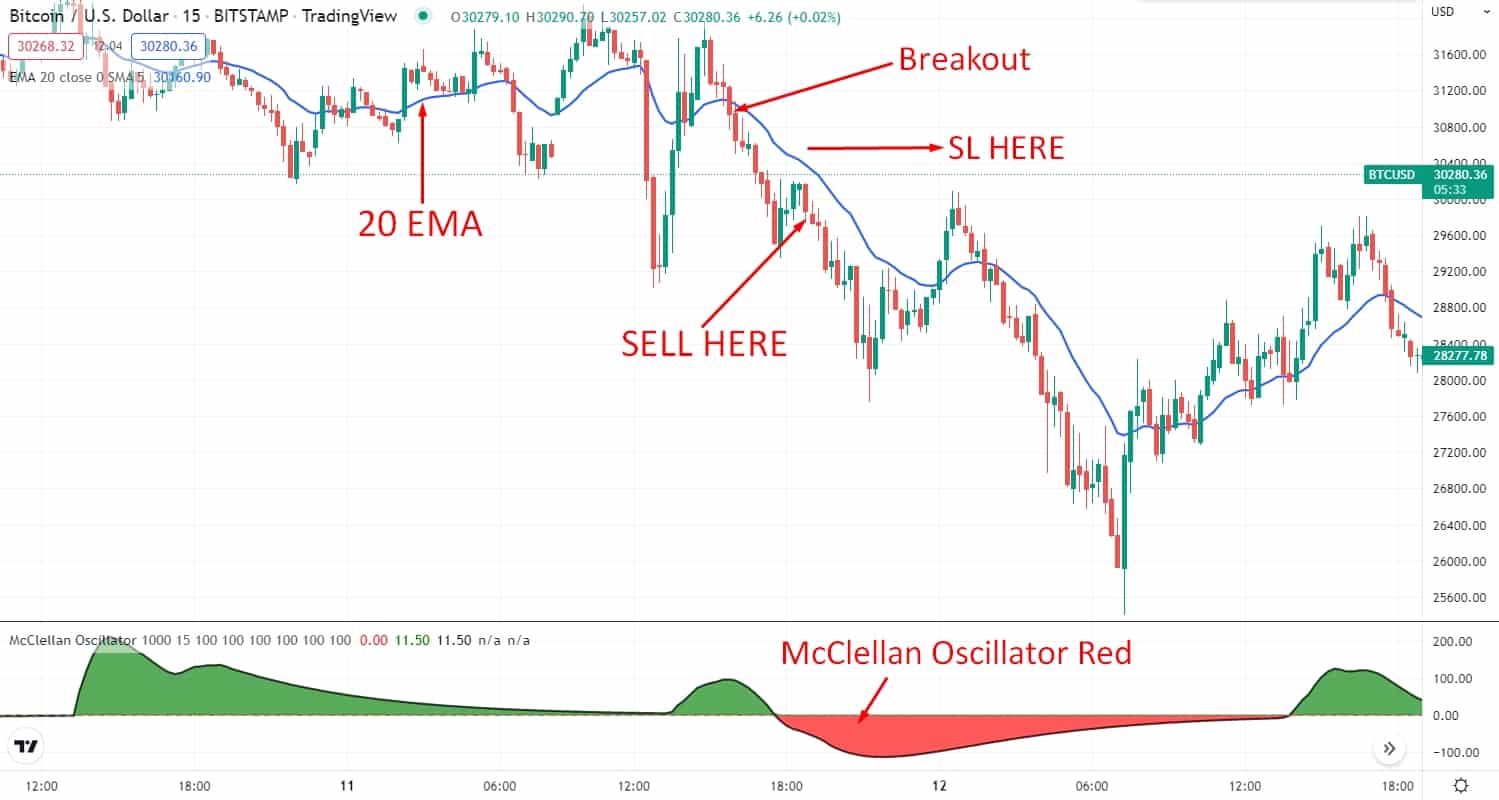
Short-term bearish trade scenario
Entry
Look for the price to break below the dynamic level from upside to the downside, and the oscillator indicator is red. Sell when the price returns to the dynamic level of 20 EMA and has a bearish candle close.
Stop-loss
Place the stop loss order above the dynamic level of 20 EMA with at least a 5-10 pips buffer.
Take profit
Take the profit by calculating at least a 1:3 risk/reward ratio. Otherwise, you can take the profit when the price breaks above the 20 EMA.
A long-term trading strategy
This strategy has developed based on the market trend. In this trading strategy, we will add the 21-period EMA and the 50-period EMA along with the indicator. However, this strategy will apply to the H4 and the D1 time frame.
Bullish trade scenario
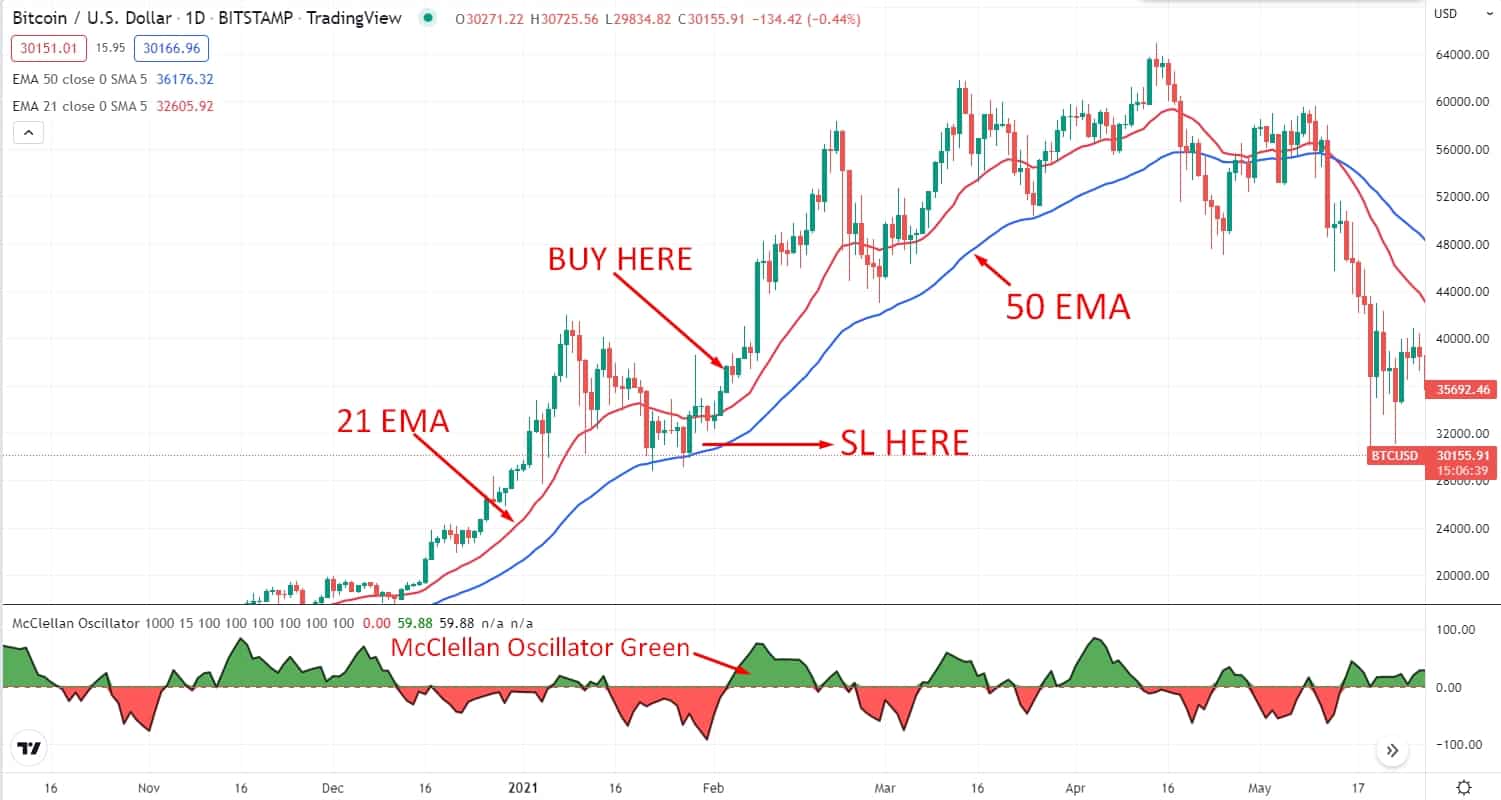
Long-term bullish trade scenario
Entry
In the bullish market, look for the price to retrace back to the 21 EMA and 50 EMA after an impulsive bullish move. Open a buy trade when the price had an impulsive bullish candle close above the 21 EMA.
Stop-loss
Place the stop loss order below the 50 EMA with at least a 10-15 pips buffer.
Take profit
Take the profit by calculating at least a 1:3 risk/reward ratio. Or else, you can take the profit when the 21 EMA crosses below the 50 EMA.
Bearish trade scenario
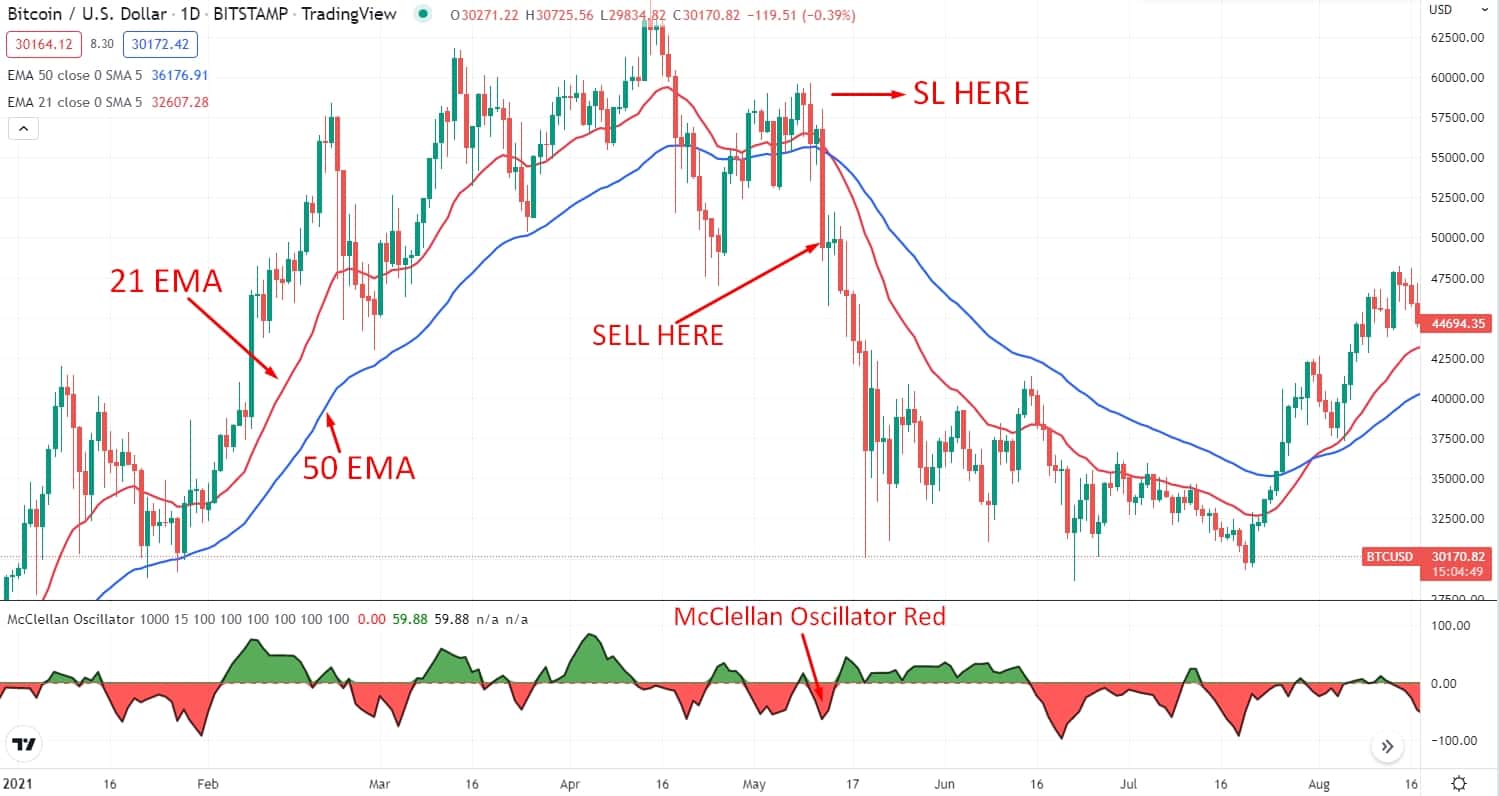
Long-term bearish trade scenario
Entry
Look for the price to retrace back to the 21 EMA and 50 EMA after an impulsive bearish move. Open a sell trade when the price had an impulsive bearish candle close below the 21 EMA.
Stop-loss
Place the stop loss order above the 50 EMA with at least a 10-15 pips buffer.
Take profit
Take the profit by calculating at least a 1:3 risk/reward ratio. Or else, you can take the profit when the 21 EMA crosses above the 50 EMA.
Pros & cons
| 👍 Pros | 👎 Cons |
|
|
|
|
|
|
Final thoughts
Finally, the market is constantly moving at the end of the day, so the calculations of the McClellan oscillator. It also goes the same with the various technical indicators. Since the oscillator keeps on providing values without giving you the chance to take any action, you must be able to evaluate the true value in case you are keen to understand the market by exploiting the indicator.


Comments