
You need to follow proper strategies to be a successful trader when it comes to trading. Selecting appropriate trading strategies enables making constant profitable trading positions and reduces the number of losing trades.
Every successful trader who participates in the financial market must follow specific strategies to deal with the price movement.
However, there are many strategies you can find by surfacing the internet; all of them do not involve the same potentiality, profitability, or complete method. This article describes the 8,13,21 EMA strategy, one of the best absolute methods for FX trading.
What are the best indicators in forex trading?
When you want to define the best indicators, you have to know what this tool is. Indicators are mathematical terms that work with market data from various angles and show the market condition.
Trading indicators work with several factors such as historical data, market patterns, price action, participant’s actions, news events, etc. Indicators show results in the price charts or an independent window. It’s common among financial traders to create trading strategies by combining trading indicators and tools.
You can group indicators into four sections such as volatility indicators, trend indicators, momentum indicators, and volume indicators. The most common, popular, and best indicators moving average convergence divergence (MACD), Moving averages (SMA, EMA), Ichimoku Kinko Hyo, Parabolic SAR, Average True Range (ATR), Bollinger Bands, etc.
What is 8, 13, 21 EMA?
Moving averages are one of the best indicators for the financial market. You can use the MA indicator for analyzing several financial markets such as forex, stocks, commodities, etc.
There are four types of moving averages:
- Simple
- Exponential
- Smoothed
- Weighted
You can calculate moving averages by opening or closing candles of specific periods. Moreover, you can customize the periods of moving averages. Easy applications and unique features make this indicator so popular.
EMA or exponential moving average is one kind of moving average that shows the most satisfactory results to identify trends. 8, 13, and 21 are the different period measures of EMA signal lines.
In our strategies:
- The red one is EMA 8
- The blue is EMA 13
- The green is EMA 21
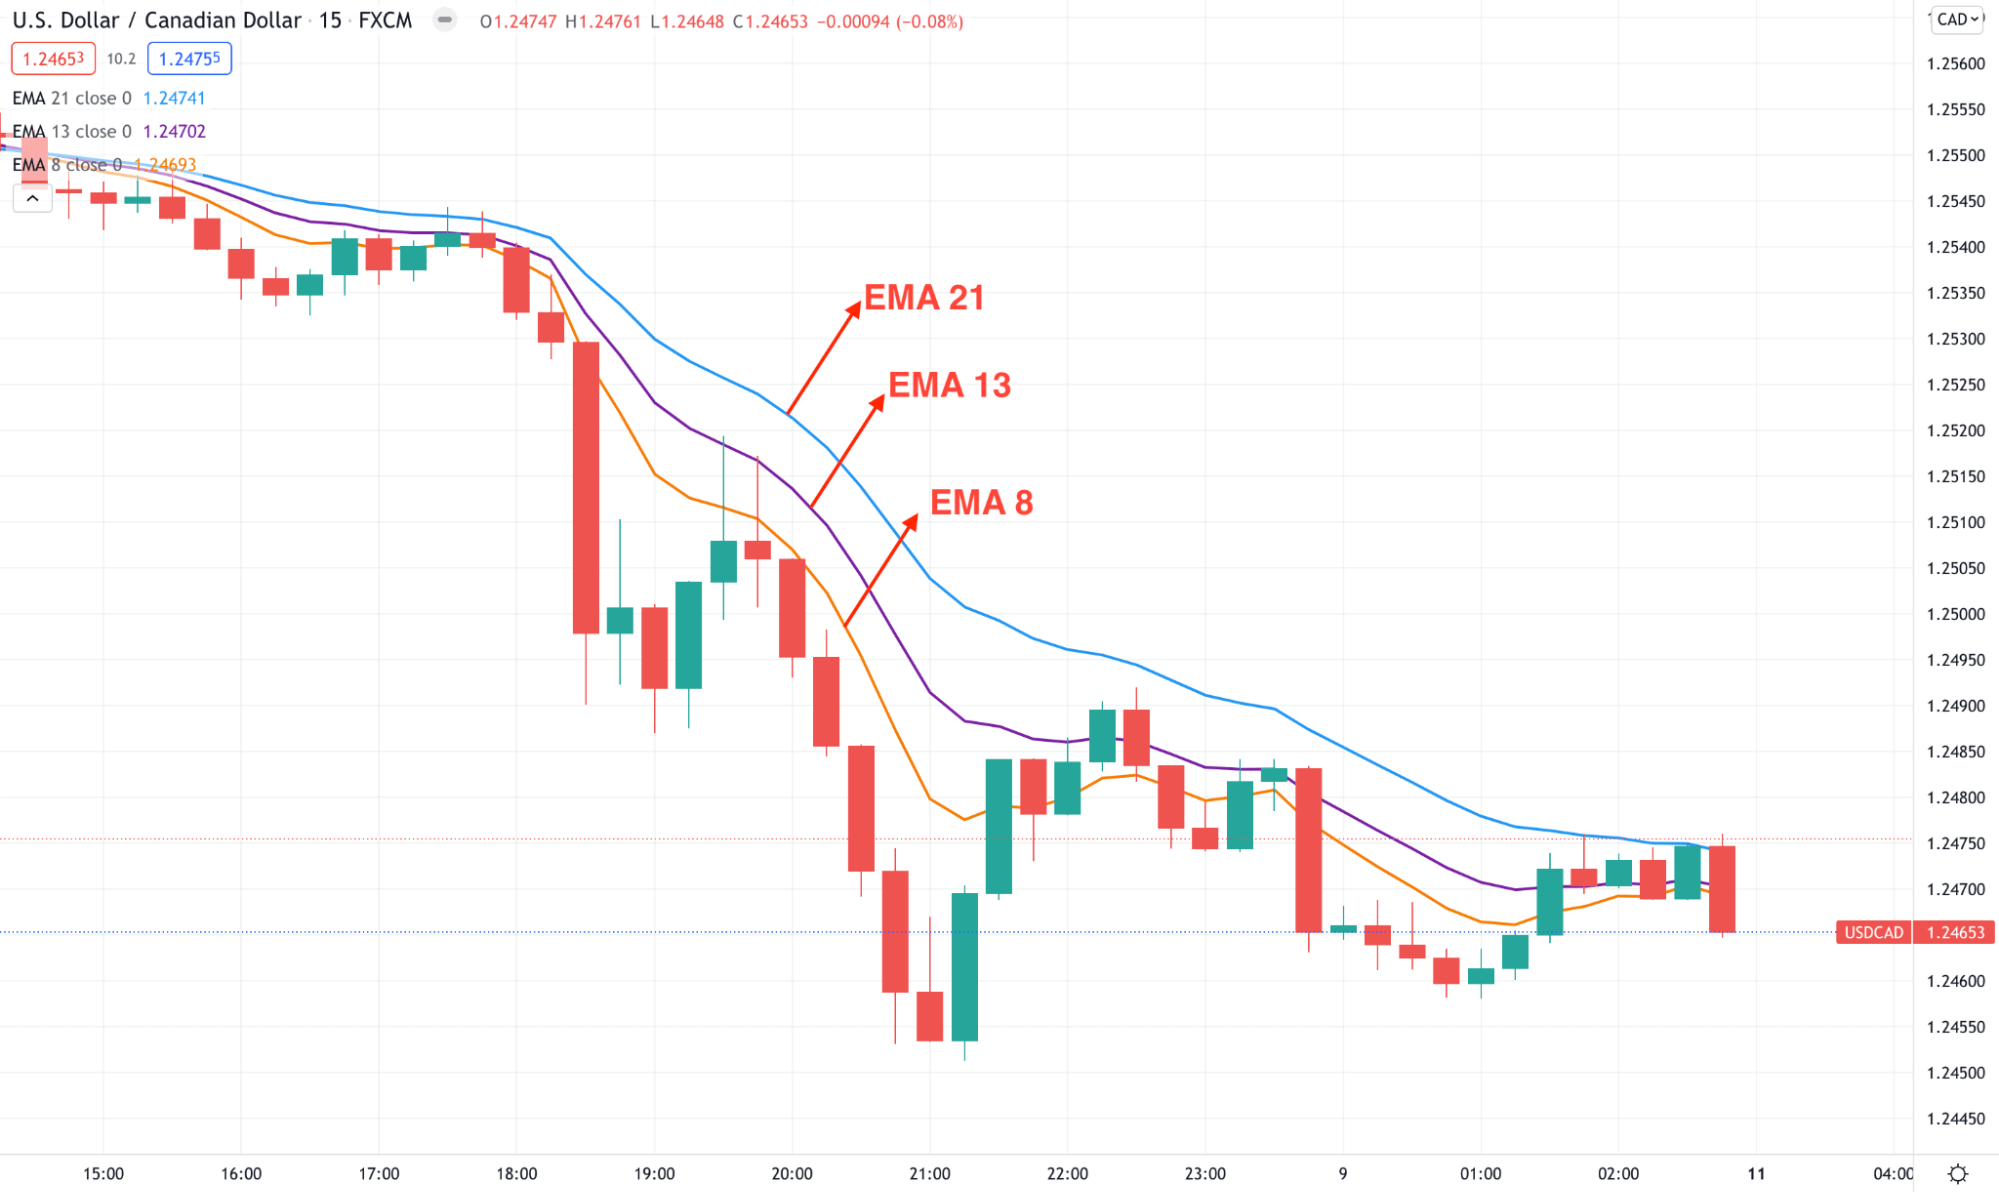
EMA 8, 13,21
What is the best strategy with 8, 13, 21 EMA combinations?
Trading strategies depend on traders’ skills and expectations.
- For example, a short-term trader may seek a trading strategy that will enable frequent trading positions.
- A long-term trader may seek a trading strategy that allows them to catch and hold trades for longer periods.
Three different periods (8,13, 21) EMA will help you to identify trends at the beginning when it starts to form. It works fine at any time frame chart of the financial assets. You can create a complete trading strategy by using these EMA signal lines. For more accuracy, you can combine these EMA signal lines with other technical indicators such as parabolic SAR, MACD, RSI, etc.
Short term trading strategy
In our short-term trading strategy, we use the combination of 8, 13, 21 EMA and parabolic SAR. This strategy will work fine in the hourly chart of any forex pair. We suggest choosing currency pairs or trading assets that involve sufficient volatility if you want to make frequent trading positions.
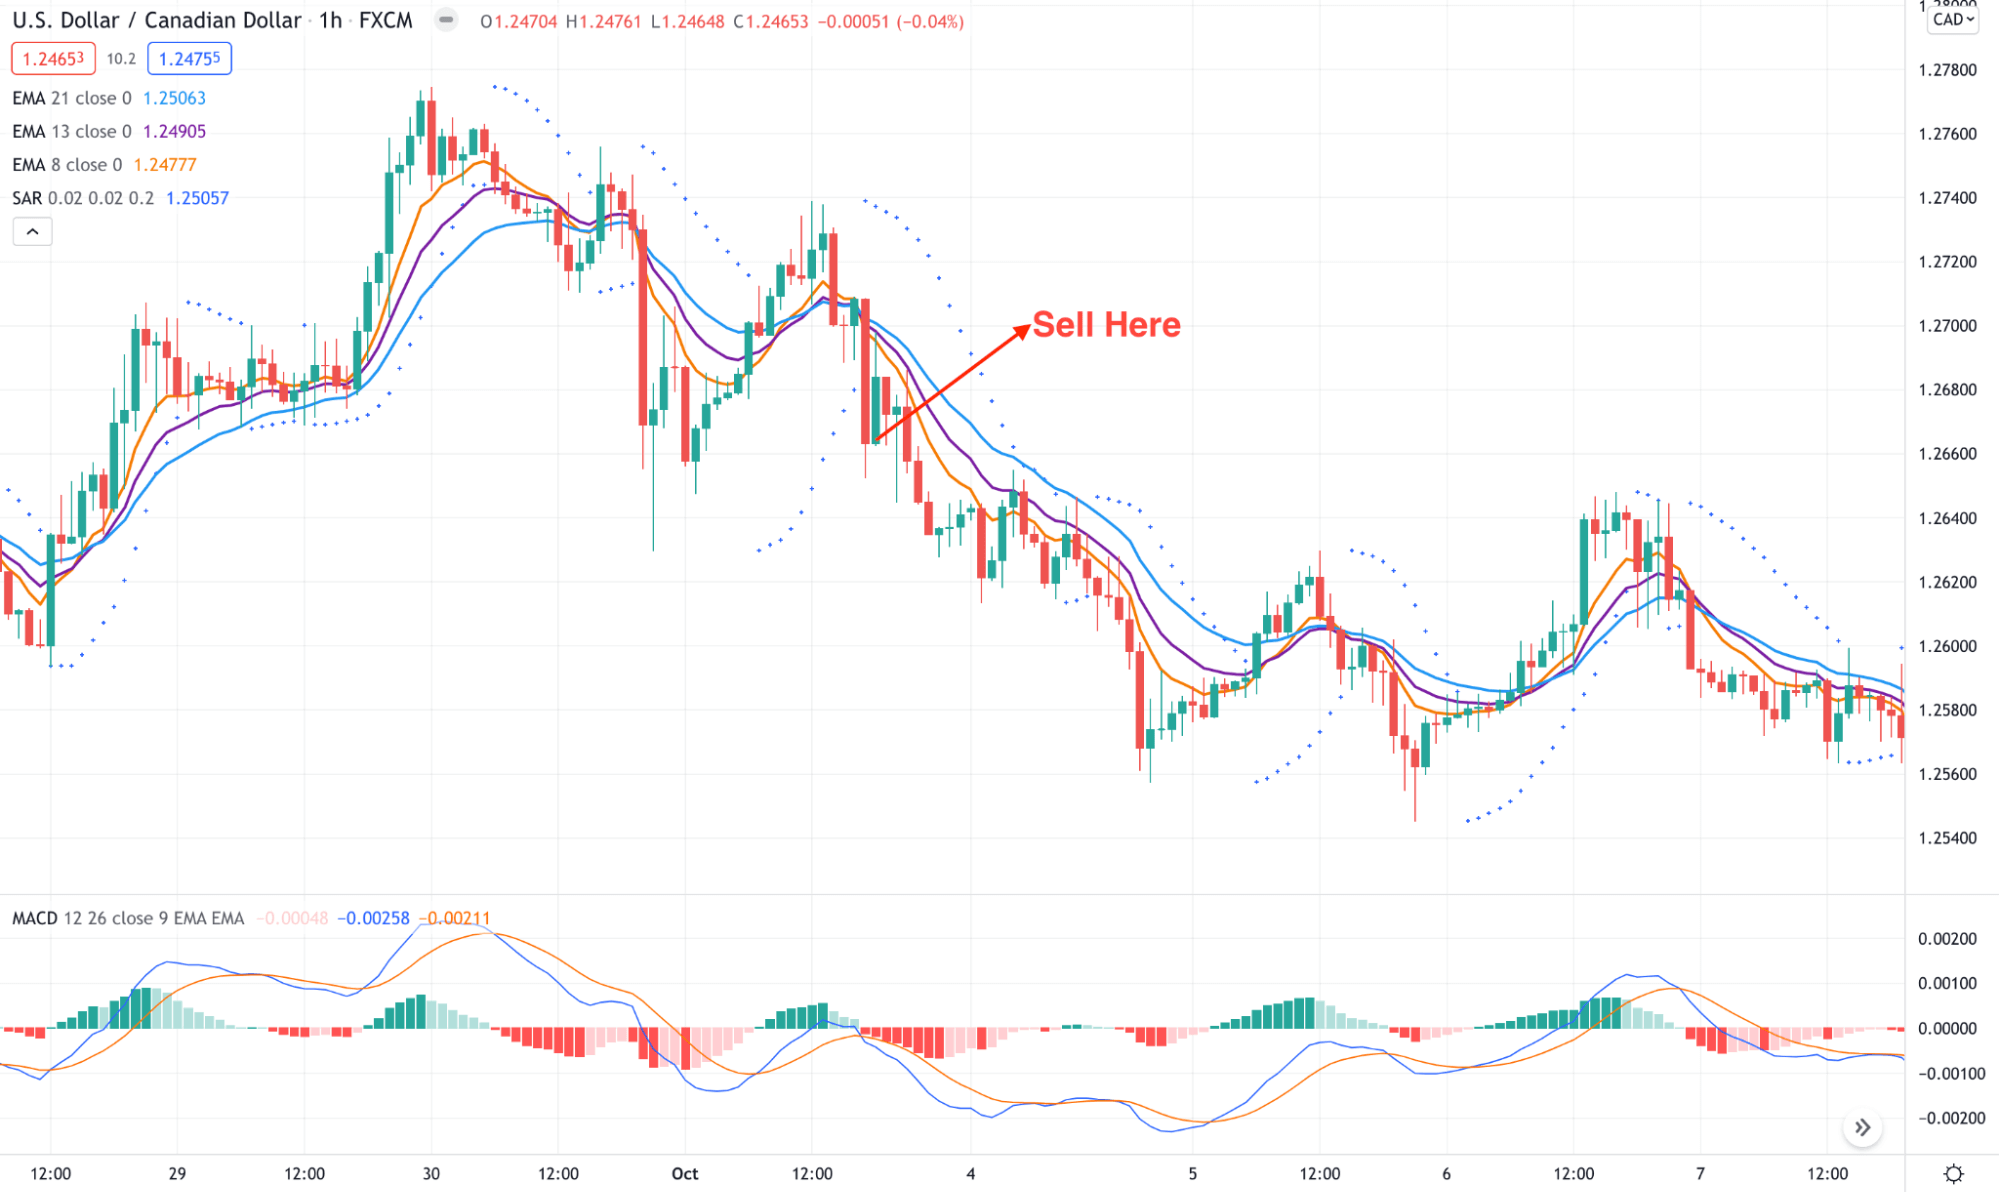
Colors are different for EMA signal lines. EMA 8 is red, EMA 13 is blue, and EMA 21 is green. When the price movement shifts to a bullish phase, the red EMA will first cross above the other two, then the blue EMA will cross above the green EMA. When both the red and blue EMA signal lines cross above the green EMA, it indicates fully bullish price movement on the asset price. The exact opposite crossover occurs between the EMA signal lines when the price movement shifts to a bearish trend. Parabolic SAR indicates the trends by signal dots. Those dots change states and continue to appear on the same side till the trend remains intact.
Bullish trade setup
Enter buy orders when these conditions are true:
- The orange (8) EMA line crosses above the blue (21) and purple (13) signal line.
- The blue (13) signal line crosses above the green (21) signal line.
- The parabolic SAR dot appears below price candles.
Check all these conditions above are true, then place a buy order. Put an initial stop loss will be below the recent swing low with a buffer of 2-10pips.
Close the buy position when:
- The orange (8) EMA crosses below both other blue (21) and purple (13) EMA lines.
- Parabolic SAR dot appears above price candles.
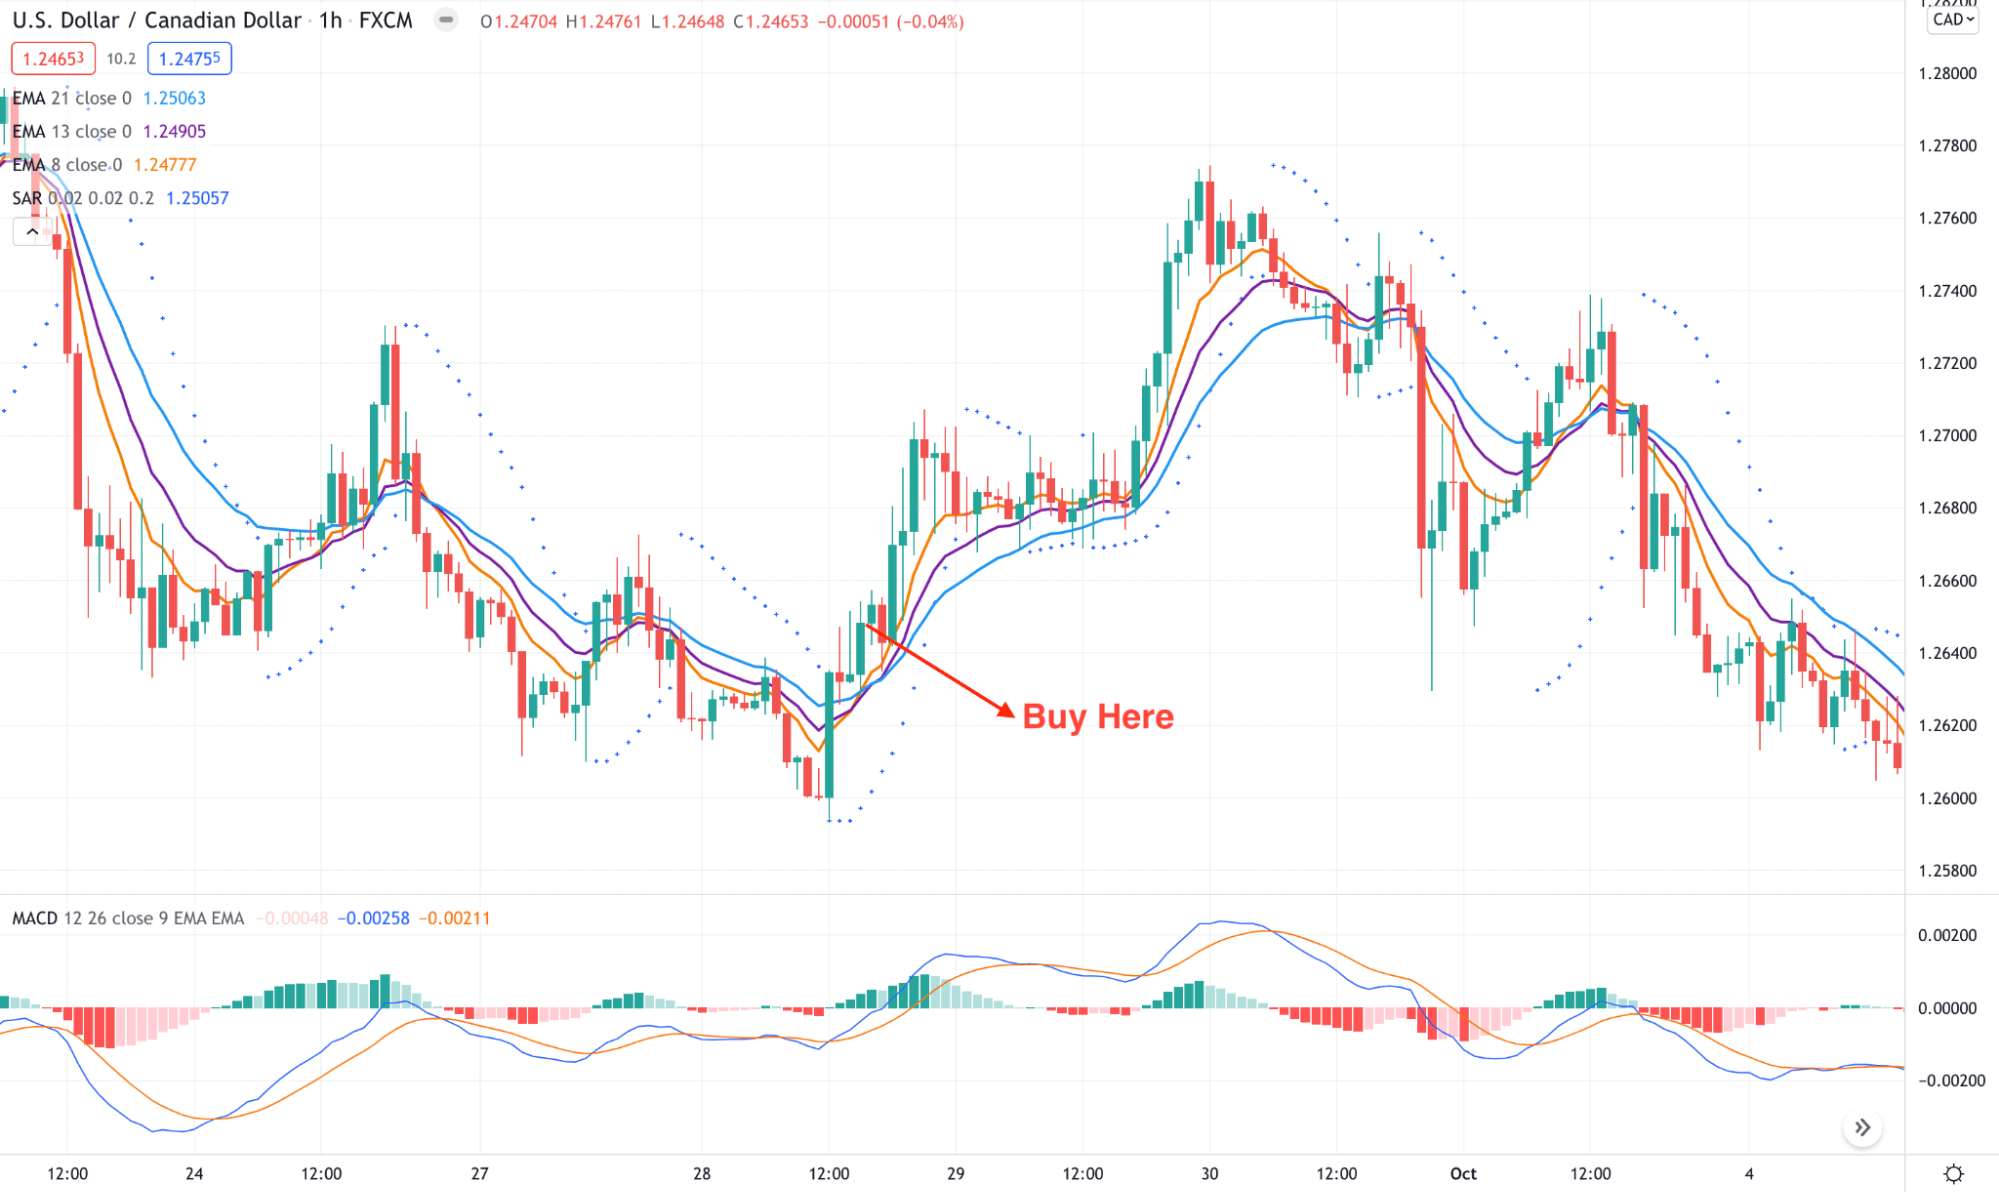
USD/CAD H1 chart
Bearish trade setup
Enter sell orders when these conditions are true:
- The orange (8) EMA line crosses below the blue (21) and purple (13) signal lines.
- The blue (13) signal line crosses below the green (21) signal line.
- The parabolic SAR dot appears above price candles.
Check all these conditions above are true, then place a sell order. Put an initial stop loss will be above the recent swing high with a buffer of 2-10 pips.
Close the buy position when:
- The orange (8) EMA crosses above both other blue (21) and purple (13) EMA lines.
- Parabolic SAR dot appears below price candles.
USD/CAD H1 chart
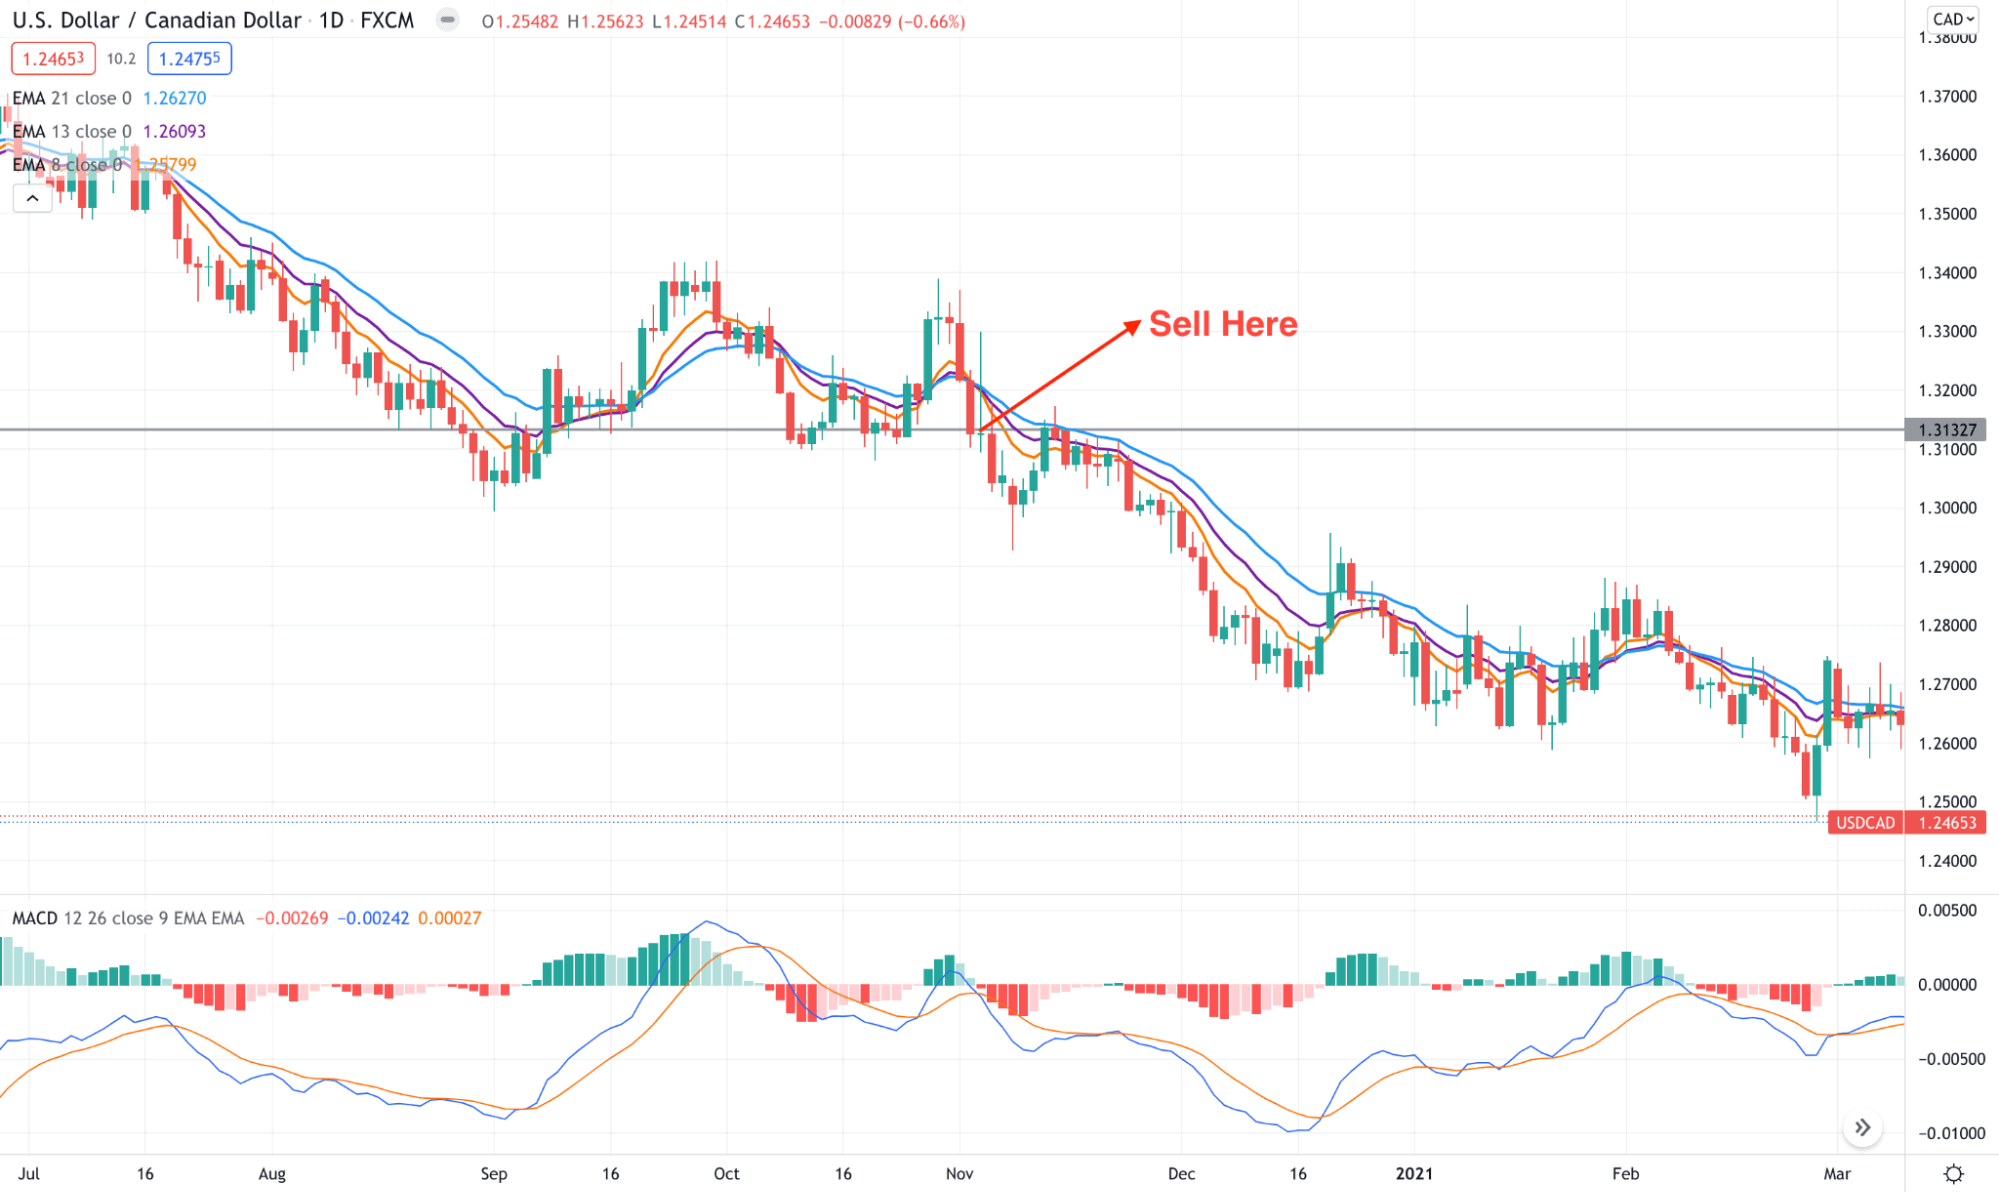
A long-term trading strategy
We use MACD in combination with 8, 13, 21 EMA lines in our long-term trading strategy. EMA lines will act the same as the short-term strategy. This strategy works fine in any time frame chart; we recommend using the daily chart.
Bullish trade setup
Enter buy order when:
- A bullish crossover occurs between the EMA signal lines.
- The blue signal line crosses above the red signal line, and both lines are heading toward the upside in the MACD indicator window.
- MACD histogram bars appear above the middle line of the MACD window.
When these conditions are true, place a buy order. The initial stop loss will be below the recent swing low.
Close the buy position when:
- MACD histogram bars appear below the middle line.
- The orange (8) EMA crosses below other EMA lines.
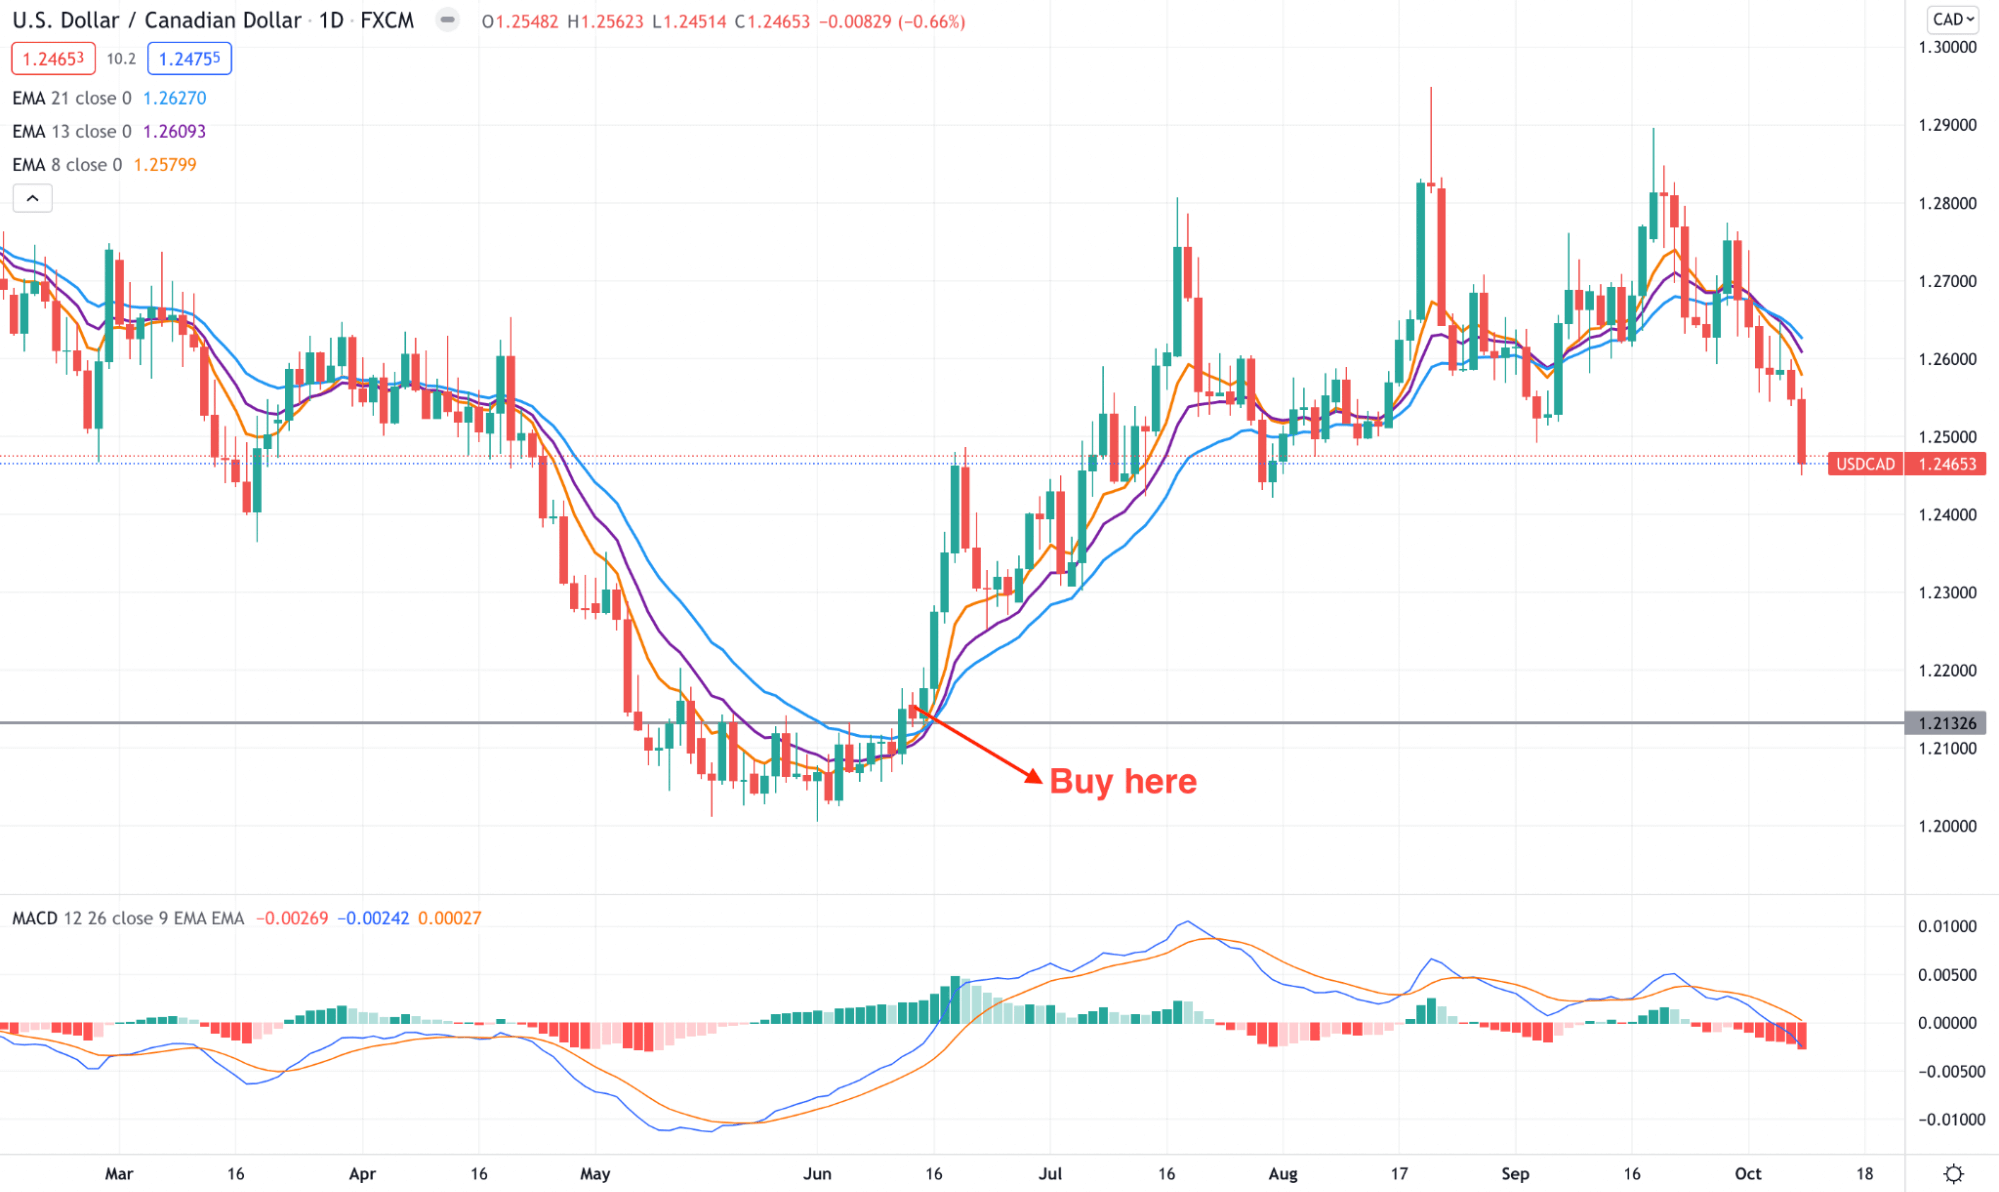
USD/CAD D1 chart
Bearish trade setup
Enter sell order when:
- A bearish crossover occurs between the EMA signal lines.
- The blue signal line crosses below the red signal line, and both lines are heading toward the downside in the MACD indicator window.
- MACD histogram bars appear below the middle line of the MACD window.
When these conditions are true, place a sell order. The initial stop loss will be above the recent swing high.
Close the sell position when:
- MACD histogram bars appear above the middle line.
- The orange (8) EMA crosses above other EMA lines.
USD/CAD D1 chart
Final thoughts
Finally, no strategy gives a 100% profitability guarantee at all times. We suggest following money and trade management rules when trading with these strategies besides practicing these at demo trading before applying them on actual trading.


Comments