
Making continuous profits in the forex market may require several trading tools and indicators. Successful traders often use technical indicators to achieve more accurate trading positions besides fundamental, sentiment, or other technical patterns.
Traders can find a considerable number of indicators on the broker-provided platform and internet. Indicators are mainly a visual representation of the market data and information. They calculate the market data in several ways and show it at the primary or independent window.
However, no marker guarantees continuous profits. It just helps determine the certain profitable levels of making entry. So traders use or choose a different type according to their trading plan.
Here we enlisted five best forex indicators commonly used and work with very basic price movement information for any forex asset.
Moving Average
Moving Average is a commonly used indicator for beginners to institutional traders. Not only forex, but investors also use this indicator for any trading assets like stocks, bonds, ETFs, etc. As the central banks and institutions drive the forex market, this is an indicator that every trader should know about the concept. So the idea of the MA is to indicate what is happening at the macro level.
Moving Average is the average price of the closing candles, representing the asset price’s overall sentiment.
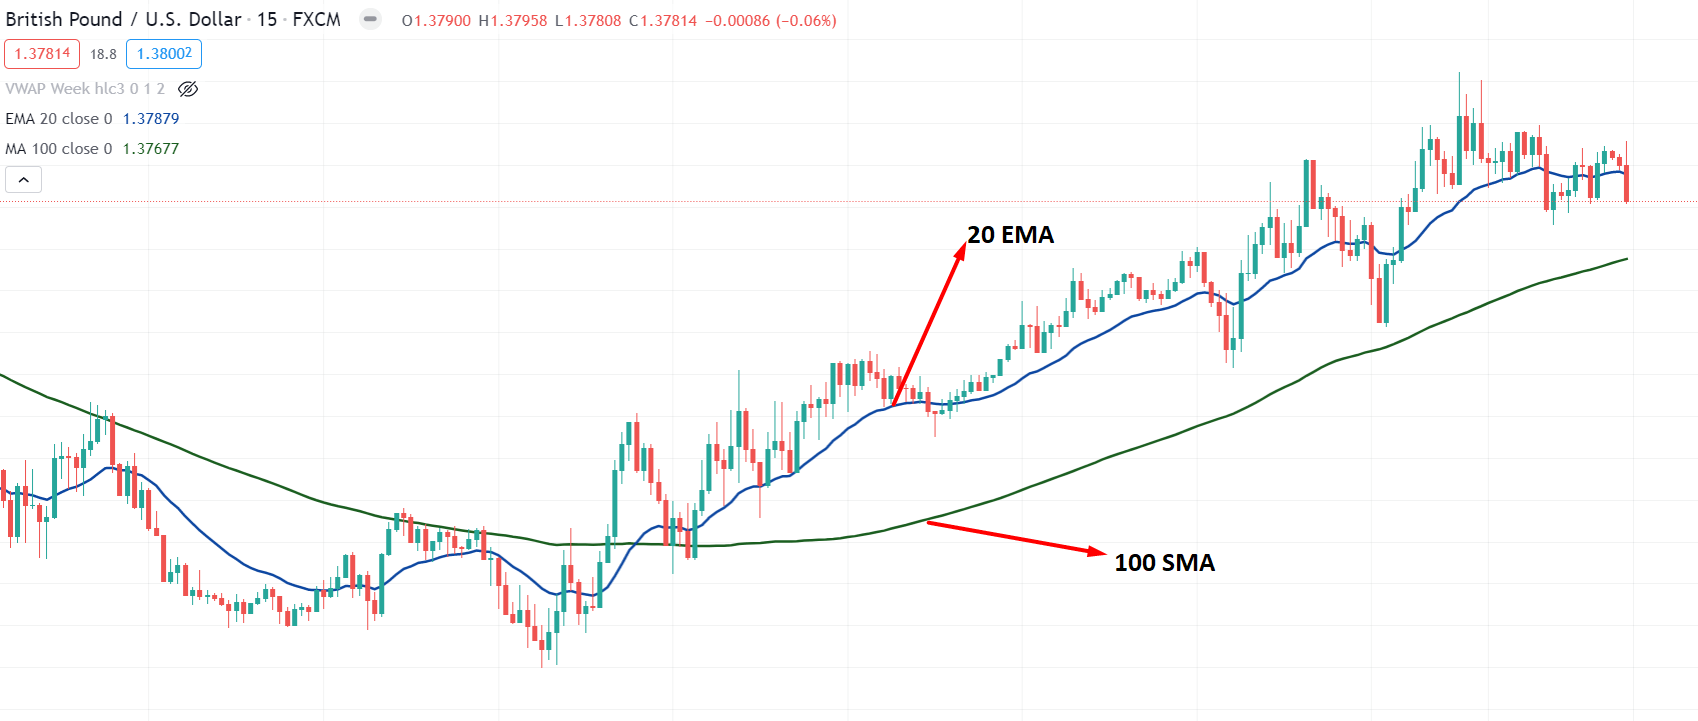
The use of the Moving Average
This fig above shows two different valued MA at the GBP/USD daily chart. The blue line is 20 SMA, and the green line is 100SMA. When the blue line crosses above the green line, the asset price is bullish, and if it crosses below the green line, then the asset price is at a downtrend.
Bollinger Bands
Bollinger Band is another commonly used indicator that has three bands to identify the volatility and range. The upper and lower band works as dynamic support and resistance levels. Price at the upper channel means the asset’s price is bullish, and the price at the lower channel means the asset price is bearish.
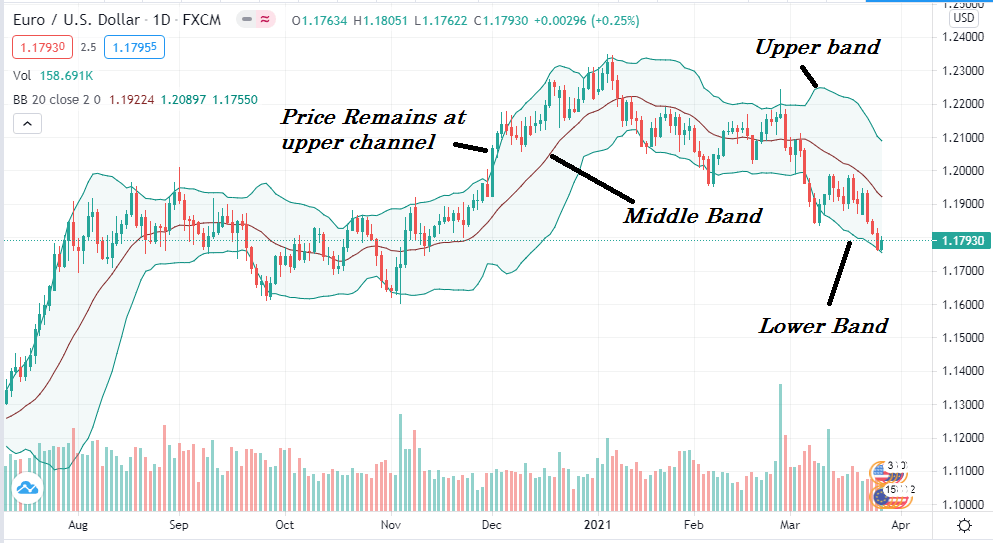
The use of the Bollinger Bands
This indicator’s use is straightforward as candles at the upper or lower band declare the overbought and oversold condition. The bands get closer if the volatility reduces and if the volatility increases, bands may expand.
So the rejection from the upper or lower band means a possible entry point. Moreover, any breakout from these levels also provides profitable trading opportunities.
Relative Strength Index
The Relative Strength Index is a popular indicator that shows the recent and historical strengths and weaknesses of the trend based on its closing price. It offers reading at an independent window within a range of 1-100. Investors mainly use this indicator to identify the reversal point of a currency pair.
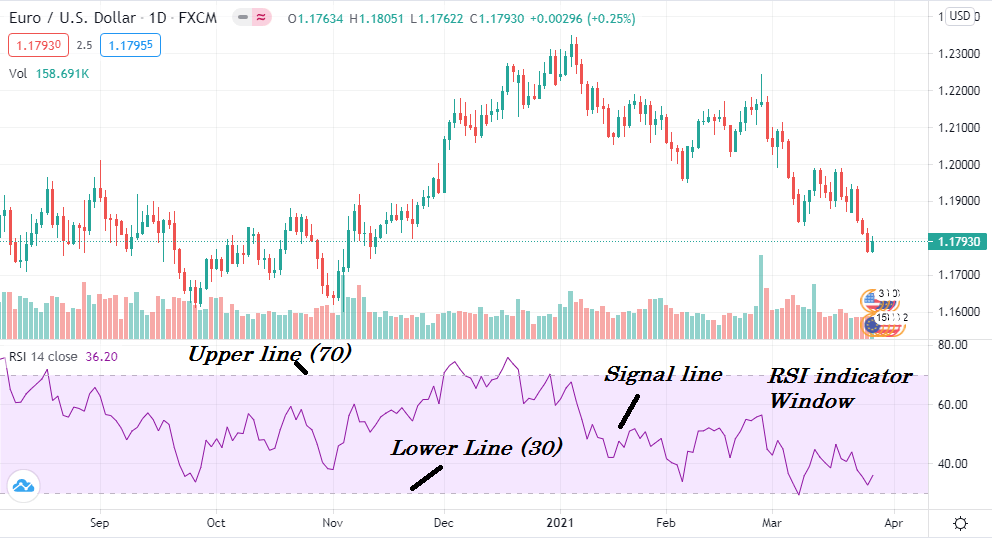
The use of the Relative Strength Index
As the figure above shows in an independent window, the RSI has a signal line, an upper and lower level marked at 70 and 30. When the signal line touches or remains above the 70 lines, the price is at the overbought condition that may indicate a possible bearish movement. Similarly, it may provide a likely bullish trend when the signal line moves below the 30 levels. This indicator shows its reading at an independent window with a middle line or zero lines, bars at both sides of that line, and a red signal line.
Moving Average Convergence/Divergence
Moving Average Convergence/Divergence is one of the simplest, trend-following, momentum-based indicators. This indicator provides both trend following and reversal indication based on the divergence, convergence, and crossovers.
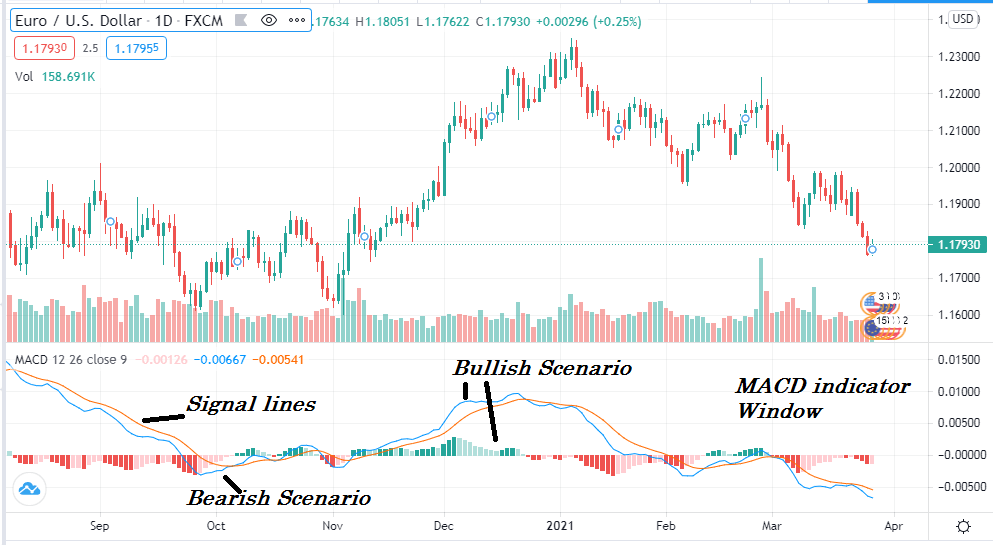
The use of the Moving Average Convergence/Divergence
When the signal lines cross above the middle line, the price becomes bullish, and when the lines below the middle — the price is bearish. Moreover, when the asset price remains at a continuous uptrend histogram starts to move higher above the zero lines. Another fact about these bars is the size that changes with the volatility. When there is a strong traders’ activity, the histogram starts to make new highs or lows, pointing to an increase in buyers’ or sellers’ activity in the price, often known as convergence.
However, the price makes new high or low in some cases, but the histogram may not follow it, creating a divergence. The divergence is a potential reversal indication of the price that most of the price action traders follow.
Parabolic SAR
The Parabolic SAR or PSAR is a form of parabolic Stop and Reverse, a well-known indicator to identify the trend direction and reversal points.
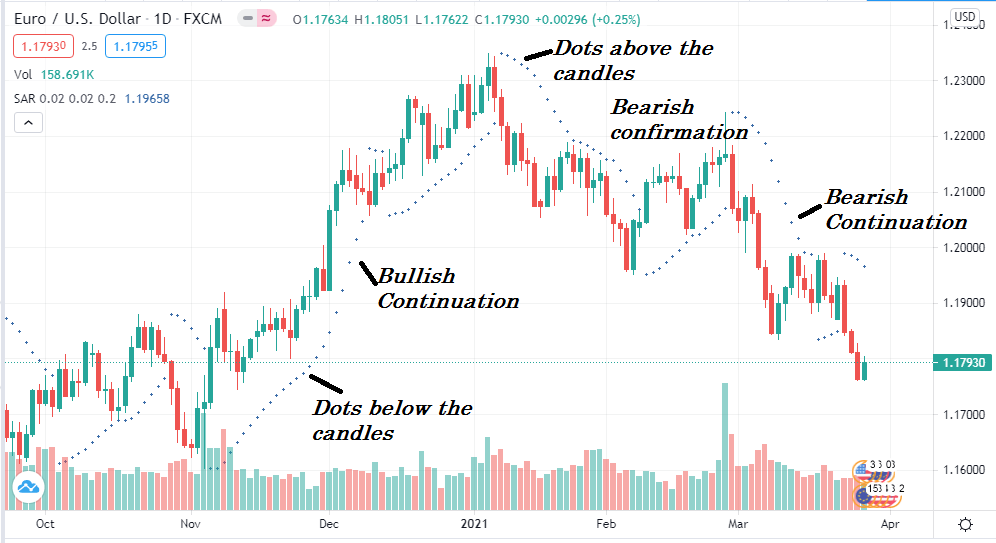
It draws dots above or below the candles where the candle is a bearish indication and below the candle is a bullish indication.
The use of the PSAR
The concept is straightforward: any price rejection from this indicator is a potential entry point. In that case, if the Parabolic Dots are below the price and show a disclaimer, we may consider it as a bullish entry. Conversely, when Dots are above the price and it is rejected from there, we may consider it as a bearish entry.
Furthermore, we can define the price volatility using the Parabolic SAR by observing the distance between Dots and the price. In a strong trend, the gap between Parabolic Dots and the price will expand, but in a corrective trend, they will squeeze.
Conclusion
Choosing the best indicators is often challenging for traders. It is not possible to define the exact price direction using indicators. Therefore, you should focus on them to meet your trading expectation with the strategy.
Whether you are a long-term or day trader, you may use technical indicators to suit your trading requirement. Some indicators may require multi-timeframe analysis to avoid unexpected turning points of the asset price. Finally, the best way is to use two more indicators on the same chart to get a clearer view of the price.


Comments