
Crossover trading is a universal and easy method that applies to nearly every financial asset such as stocks, currencies, commodities, etc. However, many crossover strategies are available there none the crossover generates the best trading ideas.
Moreover, choosing the perfect crossover depends on return expectations, trade durations, capital size, etc.
This article contains cross-trading strategies. Besides listing advantages and disadvantages, we describe short-term and long-term trading strategies through the crossover technique with chart attachments in this article.
What is the cross-trading strategy?
The moving average (MA) is a standard technical indicator for any financial trader. From novice to professional, all use trade suggestions of this indicator.
Different MAs with calculations enable traders to observe the market context in various ways that help them make profitable trade decisions. When you apply two or more different moving average lines of various lengths in your chart, those lines will suggest profitable trading positions. A unique characteristic of this indicator is unbeatable, which is the crossover.
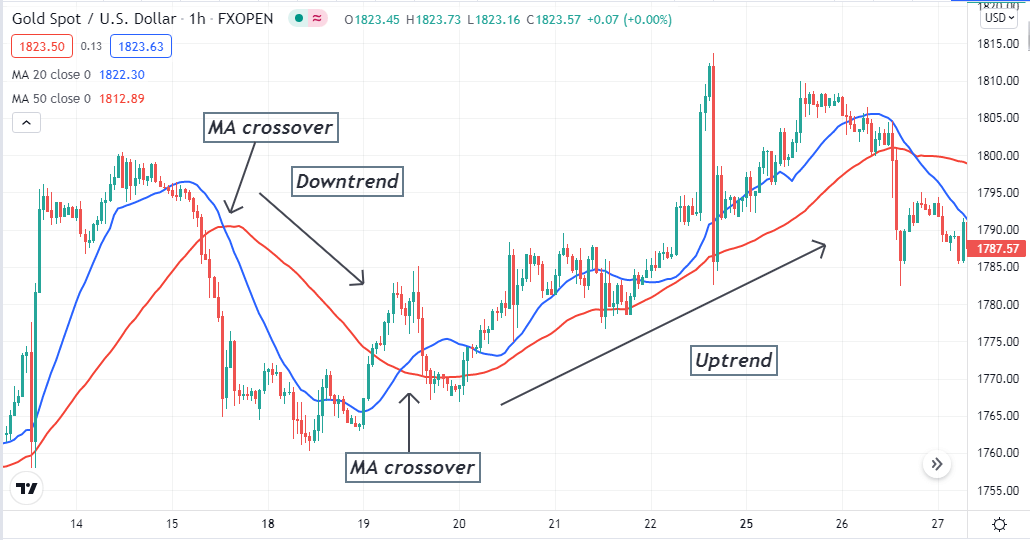
MA crossover on XAU/USD chart
When the MA line with a smaller value crosses the MA line with a higher value on the upside, it indicates a bullish pressure on the asset price. Conversely, the opposite crossover between these moving average lines signals seller domination on the asset price and a possible beginning of a downtrend. This idea is so effective that many automatic trading methods besides traditional traders use this idea to determine entry/exit points of executing trades.
How to trade using a crossover trading strategy?
Moving average is a popular indicator for its easily applicable characteristic. You can use moving average crossover to generate trade ideas. Only crossover is enough to make profitable trades constantly. Many traders use other technical indicators such as MACD, parabolic SAR, ADX, RSI, etc., to get more accurate trading positions. We will describe trading strategies below using the crossover concept.
A short-term method
In our short-term trading technique, we use three moving averages to determine the potentially profitable trading positions.
Three exponential moving averages are:
- EMA 9 (green line)
- EMA 21 (blue line)
- EMA 200 (yellow line)
The EMA 200 declares the trend, and the other two we use to identify trading positions. The green EMA crosses the blue EMA above or below signals entry/exit positions. This strategy is suitable for trading stocks, currency pairs, or commodities to generate short-term trade ideas.
We recommend using a 15-min chart of the target asset to identify potential short-term trading positions through this strategy.
Bullish trade scenario
The price creates a swing low and starts to move higher check:
- The green EMA crosses the blue EMA on the upside.
- The green EMA crosses the Yellow EMA on the upside.
- Both green and blue EMA cross the yellow EMA on the upside.
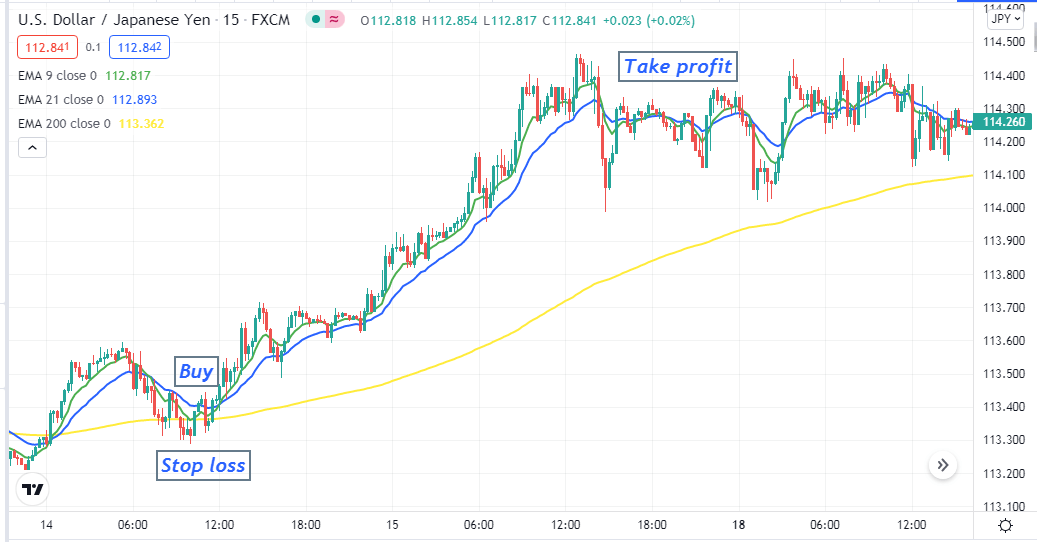
Bullish setup
Entry
When these conditions above match your target asset chart, wait until the current bullish candle closes. Then place a buy order.
Stop loss
The stop loss level will be below all those EMA lines and below the current swing low.
Take profit
Your buy order is safe till the price remains above all EMA signal lines.
Close the buy position when:
- The green EMA crosses the blue EMA on the downside.
- Both green and blue EMA come at the yellow EMA line.
Bearish trade scenario
The price creates a swing high and starts to decline check:
- The green EMA crosses the blue EMA on the downside.
- The green EMA crosses the Yellow EMA on the downside.
- Both green and blue EMA cross the yellow EMA on the downside.
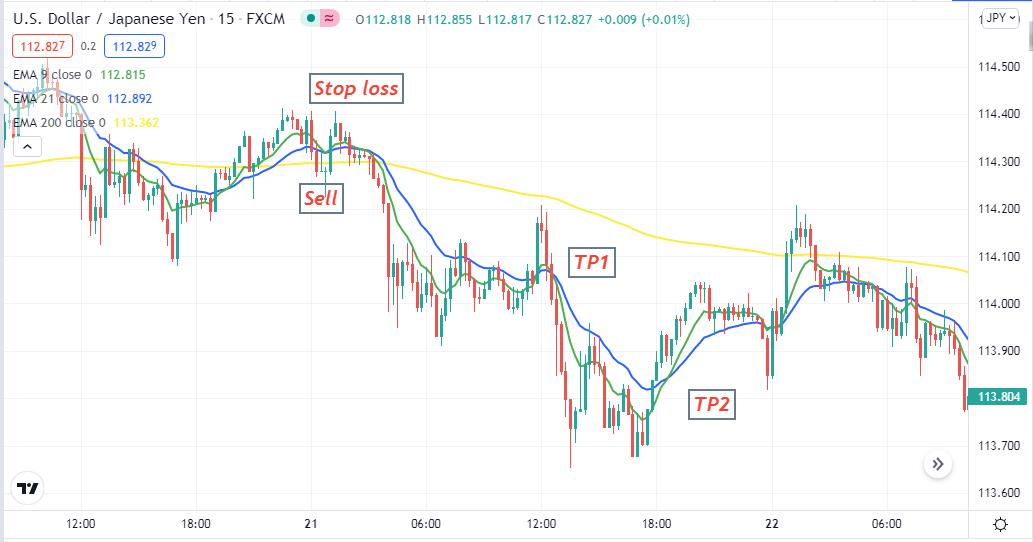
Bearish setup
Entry
When these conditions above match your target asset chart, wait until the current bearish candle closes. Then place a sell order.
Stop loss
The stop loss level will be above all those EMA lines and above the current swing high.
Take profit
Your sell order is safe till the price remains below all EMA signal lines.
Close the sell position when:
- The green EMA crosses the blue EMA on the upside.
- Both green and blue EMA come at the yellow EMA line.
A long-term method
Our long-term method involves a popular technical indicator, average movement index (ADX), besides moving average crossover. We use the golden crossover, which occurs by EMA 50 and EMA 200 signal lines.
Meanwhile, the ADX indicator declares the strength of the trend. When the dynamic line of the ADX window reaches above 20, it expresses sufficient strength of the current trend. This strategy suits any time frame chart; we recommend using an H4 or D1 chart to get the best results.
Bullish trade scenario
Check the target asset chart if:
- The green EMA (50) crosses the blue EMA (200) on the upside.
- The ADX value is above 20.
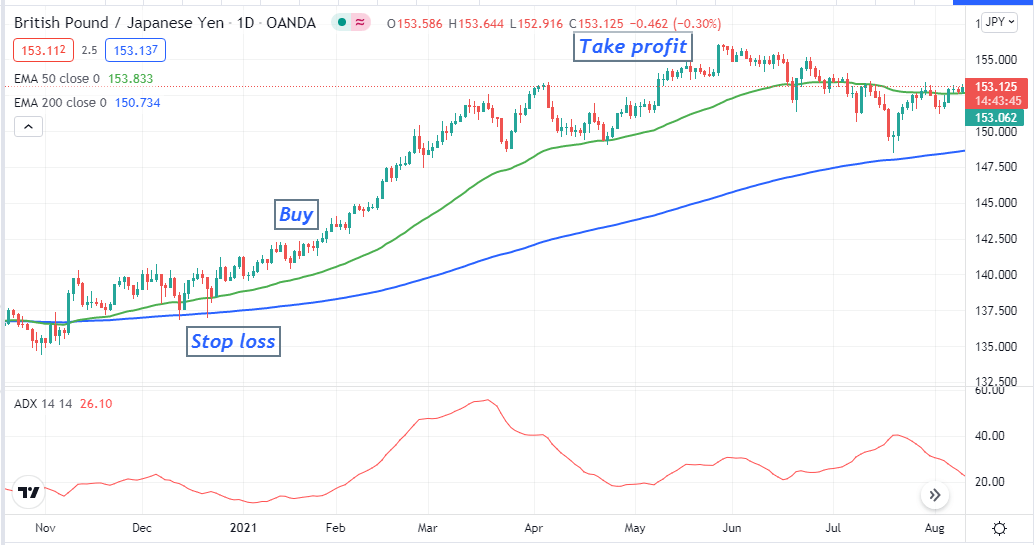
Bullish setup
Entry
Match these conditions above with your target asset chart properly, then enter a buy order.
Stop loss
The stop loss level will be below the current swing low.
Take profit
Close the buy position when the ADX value decreases and comes below 20.
Bearish trade scenario
Check the target asset chart if:
- The green EMA (50) crosses the blue EMA (200) on the downside.
- The ADX value is above 20.
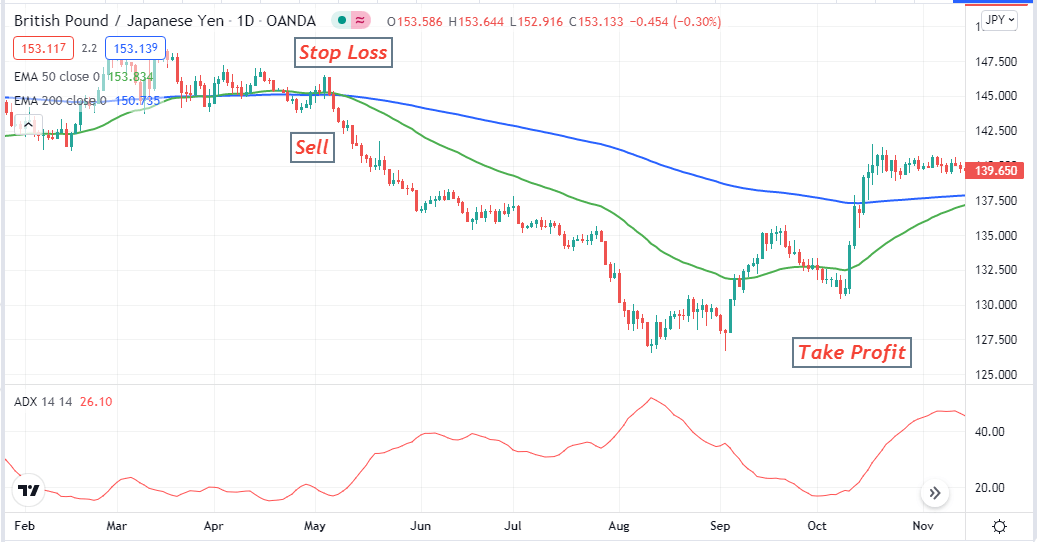
Bearish setup
Entry
Match these conditions above with your target asset chart properly, then enter a sell order.
Stop loss
The stop loss level will be above the current swing high.
Take profit
Close the sell position when the ADX value decreases and comes below 20.
Pros and cons
| Pros | Cons |
|
|
|
|
|
|
Final thought
Finally, these are the top best MA crossover trading methods that you can use to make constant profitable trading positions. We suggest using demo charts to master these concepts before applying them to real trading.


Comments