The MACD is one of the handy technical tools that we use for trend identification. It helps check the direction, trend strength and defines reversal zones.
Let’s discuss how it works and see its practical use in FX trading.
What is a MACD?
It is one of the widely popular indicators in technical analysis. It is designed so that traders can understand changes in momentum, strength, and trends. The indicator is centered on moving averages (MA), making it a credible momentum filter and tool that you can use while trading FX.
It is all about convergence and divergence.
- Convergence takes place when the two MAs move towards each other.
- Divergence occurs when the MAs move away.
History of MACD
One of the world’s reliable and straightforward technical tools was developed in the late 70s by Gerald Appel. Participants of the FX market love it because of its simplicity or the fact that it attempts to combine the best of both worlds: trend following and momentum. Though invented in the late 70s, MACD is still considered one of the most reliable technical tools in technical analysis.
So many FX, commodity, and stock traders started using this technical tool to increase their accuracy because it helps understand the trend and its strength.
Calculation of the convergence/divergence indicator
It is calculated by subtracting the 26-period EMA from the 12-period EMA. The result of that calculation gets us the MACD line.
A nine-day exponential MA of this tool is then plotted on the top of the indicator’s line. So this serves as the line that shows traders the direction of the significant trend of a particular trading instrument. In addition, it can generate buy/sell signals for trading.
- When the indicator’s line crosses above its signal line, traders may go long or buy.
- When it crosses below the signal line, traders may go short or sell.
For a fast EMA, select 12 days, and for a slow one, a period of 26 days. The formula for calculating our divergence indicator is as follows:
1) MACD = ЕМАs (P) – EMAl(P),
2) Signal = SМА (ЕМАs(P) – EMAl(P)) (signal line),
The histogram is calculated as the difference between the values of formulas (1) – (2), where:
- EMAs (P) — exponential MA with a period of 12
- ЕМАl (P) — exponential MA with a period of 26
- SMA (P) — smoothing MA with a period of nine from the difference between the other two MA
- P — usually, the close price of the period
The indicator values fluctuate from the zero value (line) and can be either positive or negative.
Method for plotting a MACD on a price chart
One of the most common trading methods in technical analysis is the MACD line crossing over the signal line:
- It generates a buy signal when the indicator’s line crosses above the signal line.
- It generates a sell signal when the indicator’s line crosses below the signal line.
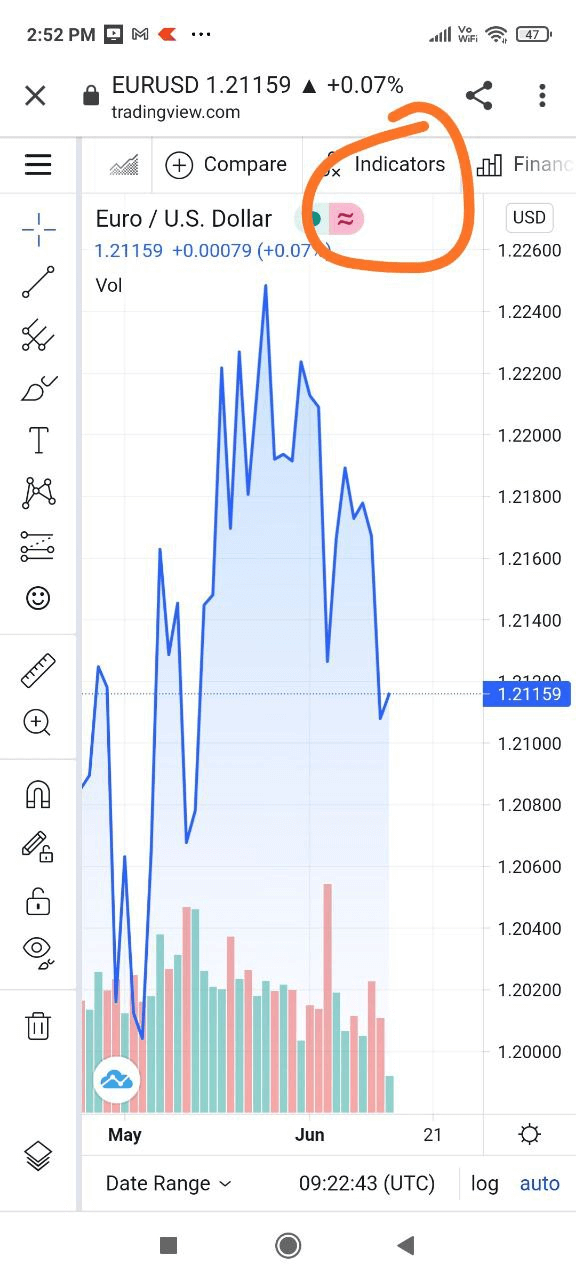
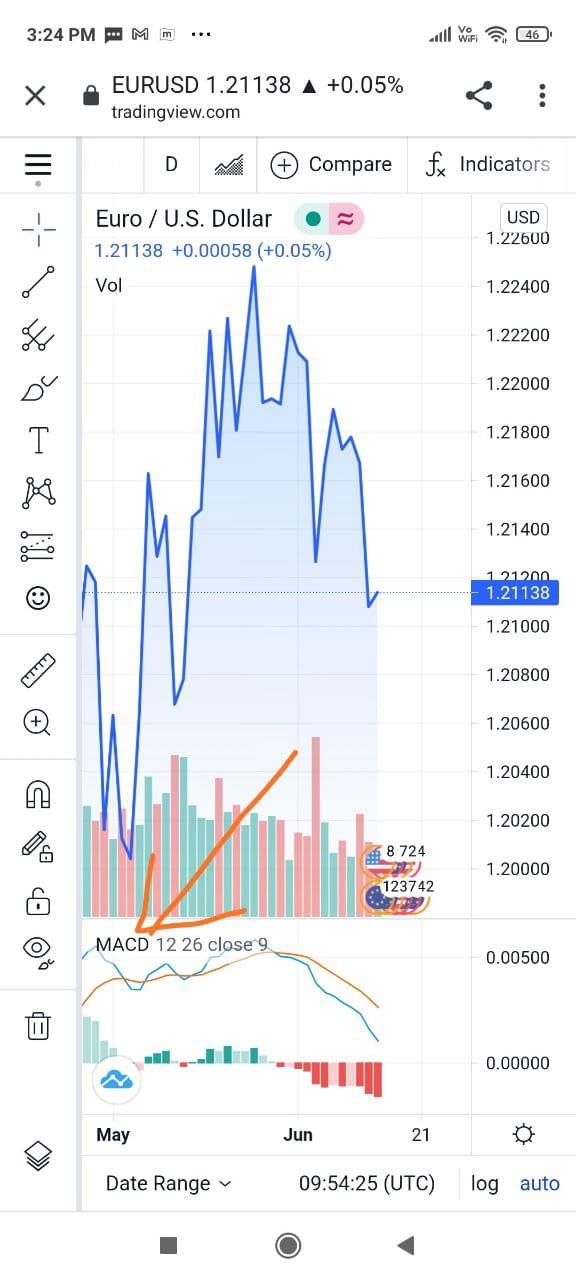
Let’s check how to plot the indicator on a chart. We are using tradingview for this demonstration.
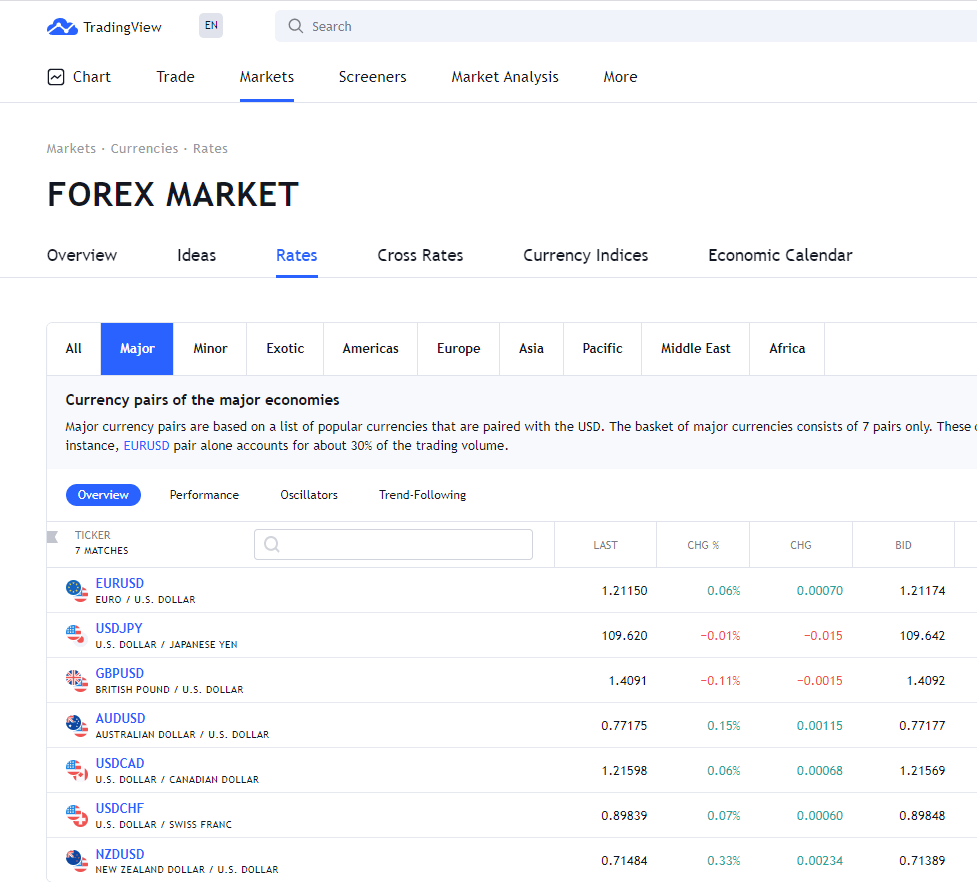
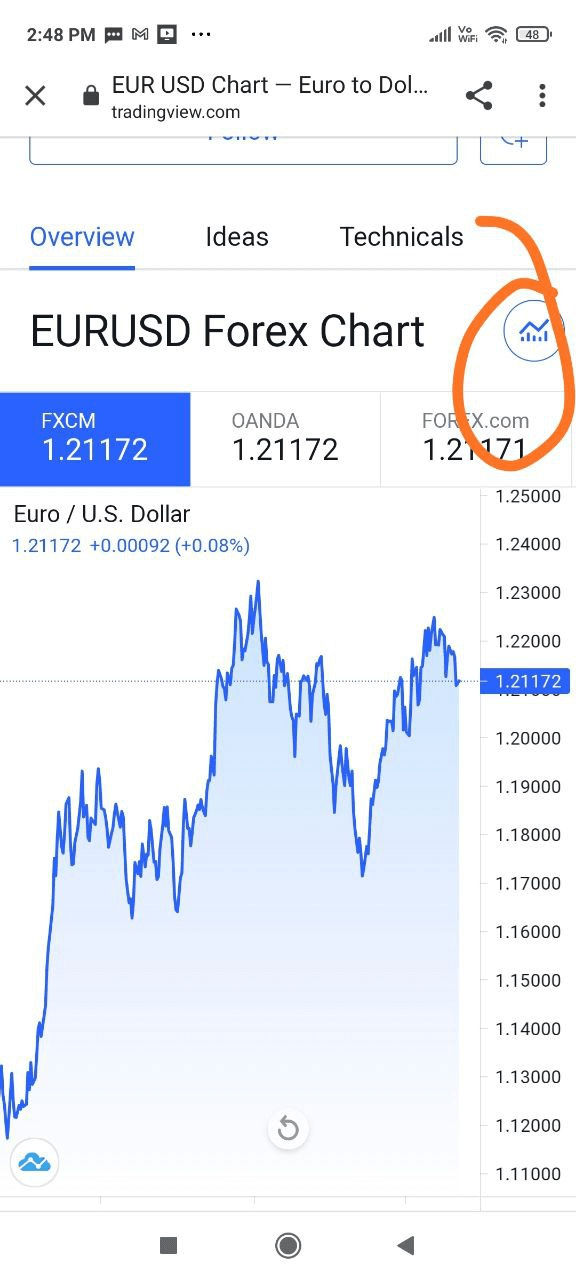
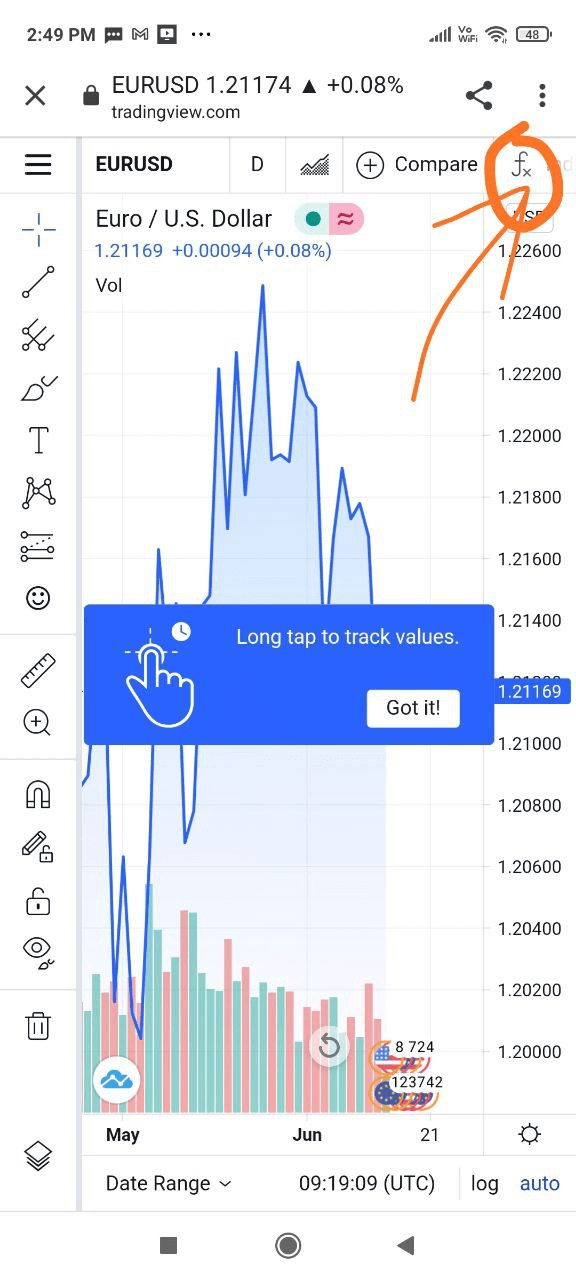
| 1st step | 2nd step | 3rd step | 4th step | 5th step |
| Click on the “markets” tab and then “forex market.” | Click on the pair you are looking for, and then on that circle, we have highlighted. | Click on the indicator tab on the top. | After clicking on the “indicator” tab, you can search whichever indicator you want to use. | Select the indicator on the bottom side of your chart. |
|
|
|
|
|
Benefits of using the indicator
It is a simple yet powerful trading indicator for identifying new trends, which helps determine if they are bullish or bearish. It also helps determine the strength and momentum of the direction and is computed on price data, plotted as a time series.
There are so many benefits of using this tool in the FX, some of which are:
- Relatively easy-to-use indicator, which resonates well with most traders.
- It gives clear buy/sell signals.
- The traders can use this indicator in combination with other tools to further enhance the accuracy.
- It offers good risk-to-reward trading setups.
When to enter and exit a trade using this tool
It is a technical tool that uses the difference between two EMAs to determine the market’s momentum and direction.
Let’s discuss a MACD crossover strategy for entry and exits, which takes place when the MACD line and the signal line intercept often indicate a change in the market trend.
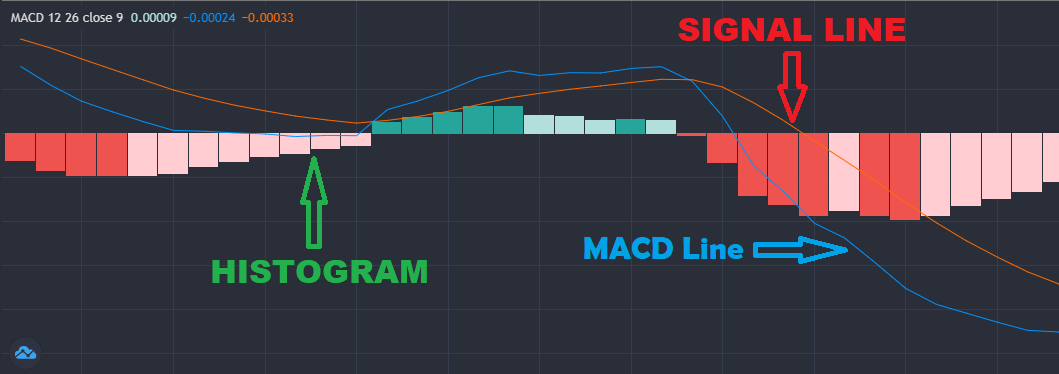
As we can see on the above image:
- The blue arrow is showing the indicator’s line.
- The red arrow is showing the signal line.
- The green arrow is showing the histogram.
A buy signal is generated when the blue line crosses above the signal line. Likewise, a sell signal will appear when the blue line crosses below the signal line. To understand this deeply, we will use an example of using this strategy.
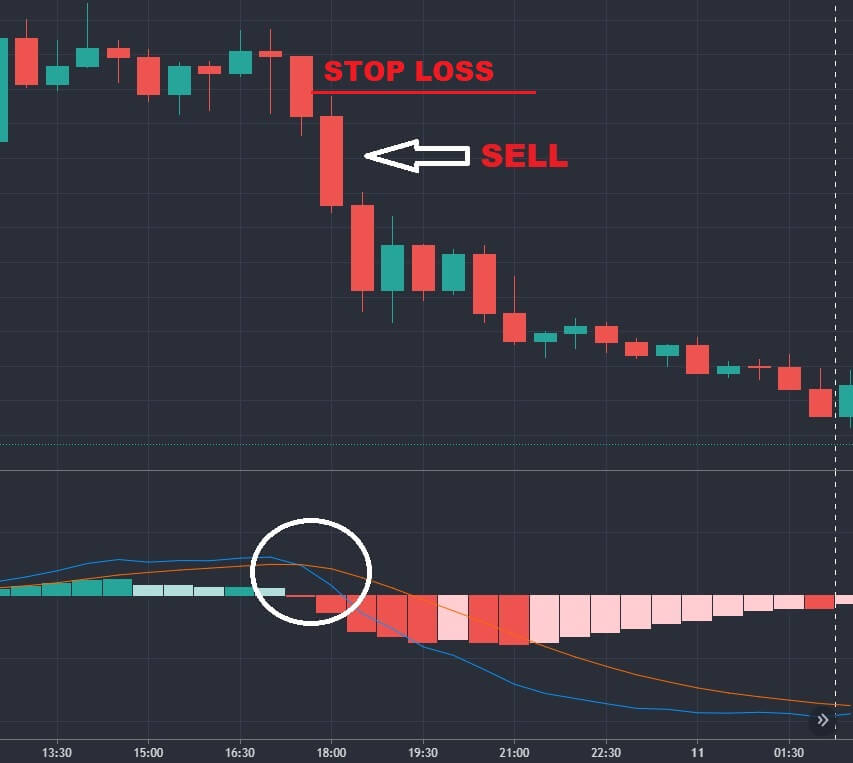
This is the hourly chart of the EUR/GBP currency pair. As we can see in the image above, the MACD line has crossed the signal line from above, generating a sell signal. Therefore, we will go short on the signal candle, and we will place a stop-loss order on the top of the signal candle.
For-profit booking, we must use a 1:3 risk to reward ratio, or we can exit the trade if the blue line crosses the signal line from below — vice versa for buy signals.
How to become successful in trading with this indicator?
- Remember that it is also a lagging indicator, and all its signals to a greater/lesser extent lag behind the price on the chart.
- To use this indicator to the maximum, combine its trend and oscillating settings.
- Divergence will show you the most robust and most reliable sign of an imminent trend reversal.
- Having comprehended the rules for reading the price of charts, your profit in trading will become an inevitable event, with or without indicators.


Comments