
The multiple time frame analysis allows traders to get the overall outlook of the price from a different angle.
- Long-term traders use higher time frames
- Short-term traders use lower time frames
Therefore, if you know this system, you can easily anticipate all types of trader activity in the price.
The FX is the world’s biggest financial market, where most market movers are central banks and financial institutes. However, institutional traders play a vital role in every financial market that pays in more extended time frames.
- Long-term trading views always provide a better outlook of the price
- Short-term traders can make a profit from swing levels, which is a way to boost profitability
Therefore, if you can merge the higher and lower time frames outlook, you can make a good profit from the market. But, first, let’s have a look at the complete trading process.
What is multiple time frame analysis?
It is a process to anticipate the price movement of a financial instrument based on the price outlook in different periods.
- Swing and position traders usually use higher time frames and take their profits weekly or monthly
- Big investors who want a significant gain from the market invest in a bearish market
When the price of a financial instrument becomes lower with immense upside potential, investors spend a lot of money on it. On the other hand, swing traders join later based on swing levels from the order building phase.
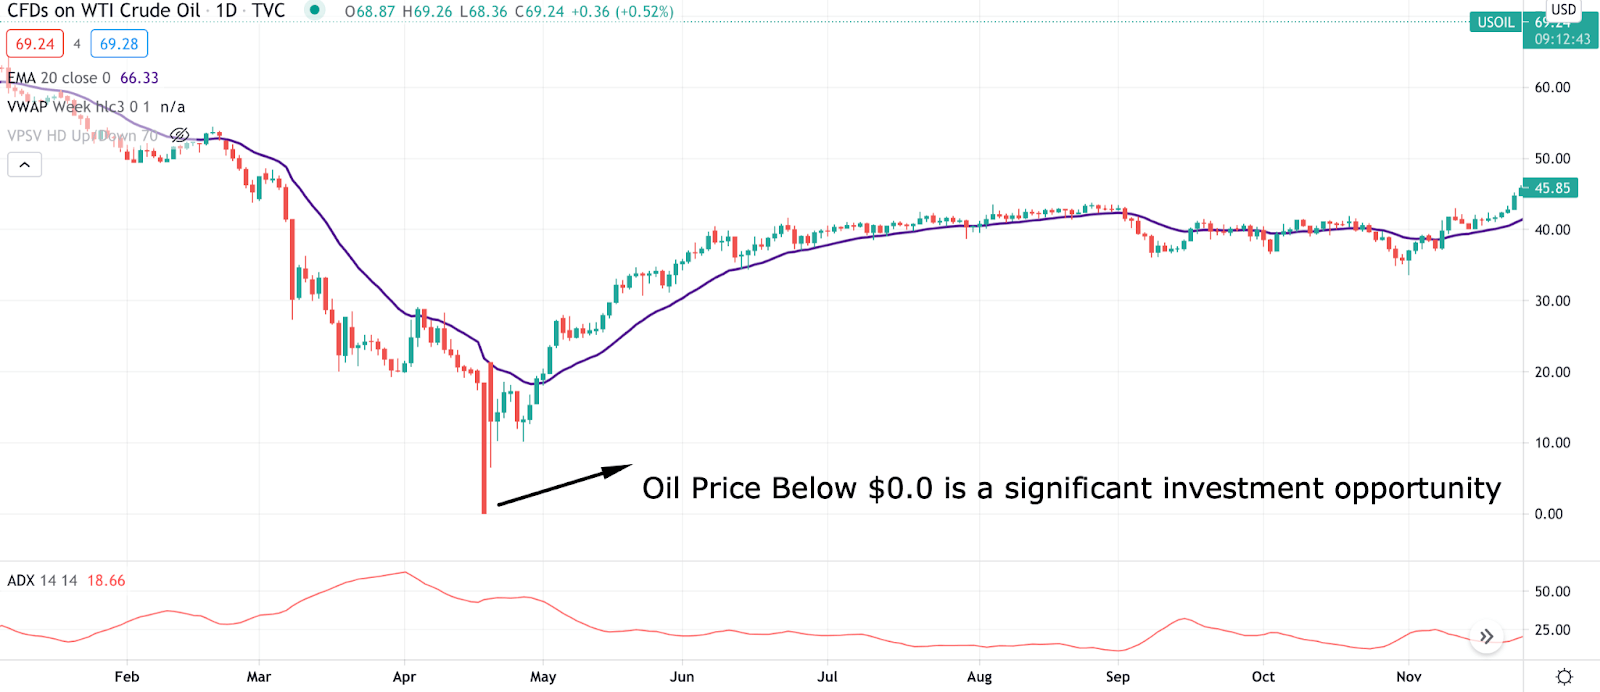
Here we can see the example of a higher time frame trading in crude oil.
- Its price was down below the $0.0 level as soon as the global pandemic came with lockdown as shutdown.
- In this situation, big investors came and invested in oil.
- Big investors usually trade daily or weekly.
On the other hand, swing traders wait for big players to come and join their direction from swing levels. Let’s look at an example.
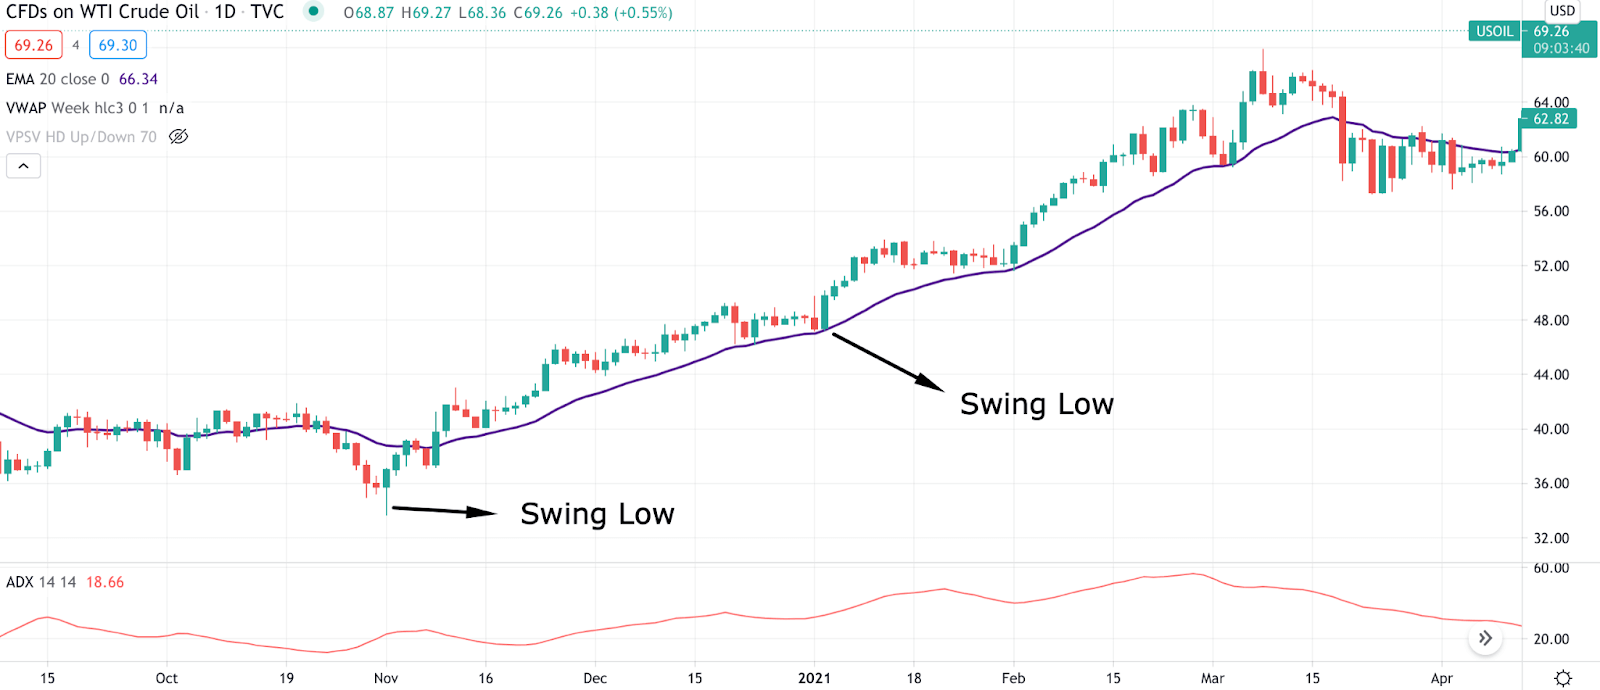
On the other hand, short-term traders follow the intraday price direction without any intervention of a higher time frame. If a trader can combine these, they can generate a good profit from the market.
Predict a buy trend using multiple time frame analysis
In this section, we will see how to generate a buy trading strategy using this analysis in a step by step approach:
Step 1: Find buy direction
- First, we have to find a buy market, and the buying market comes from a prominent trader’s direction.
- If the price moves up from any critical support level daily or weekly, we can consider the price direction as bullish solid.
- Therefore, we will focus on buy trades and ignore all sell setups.
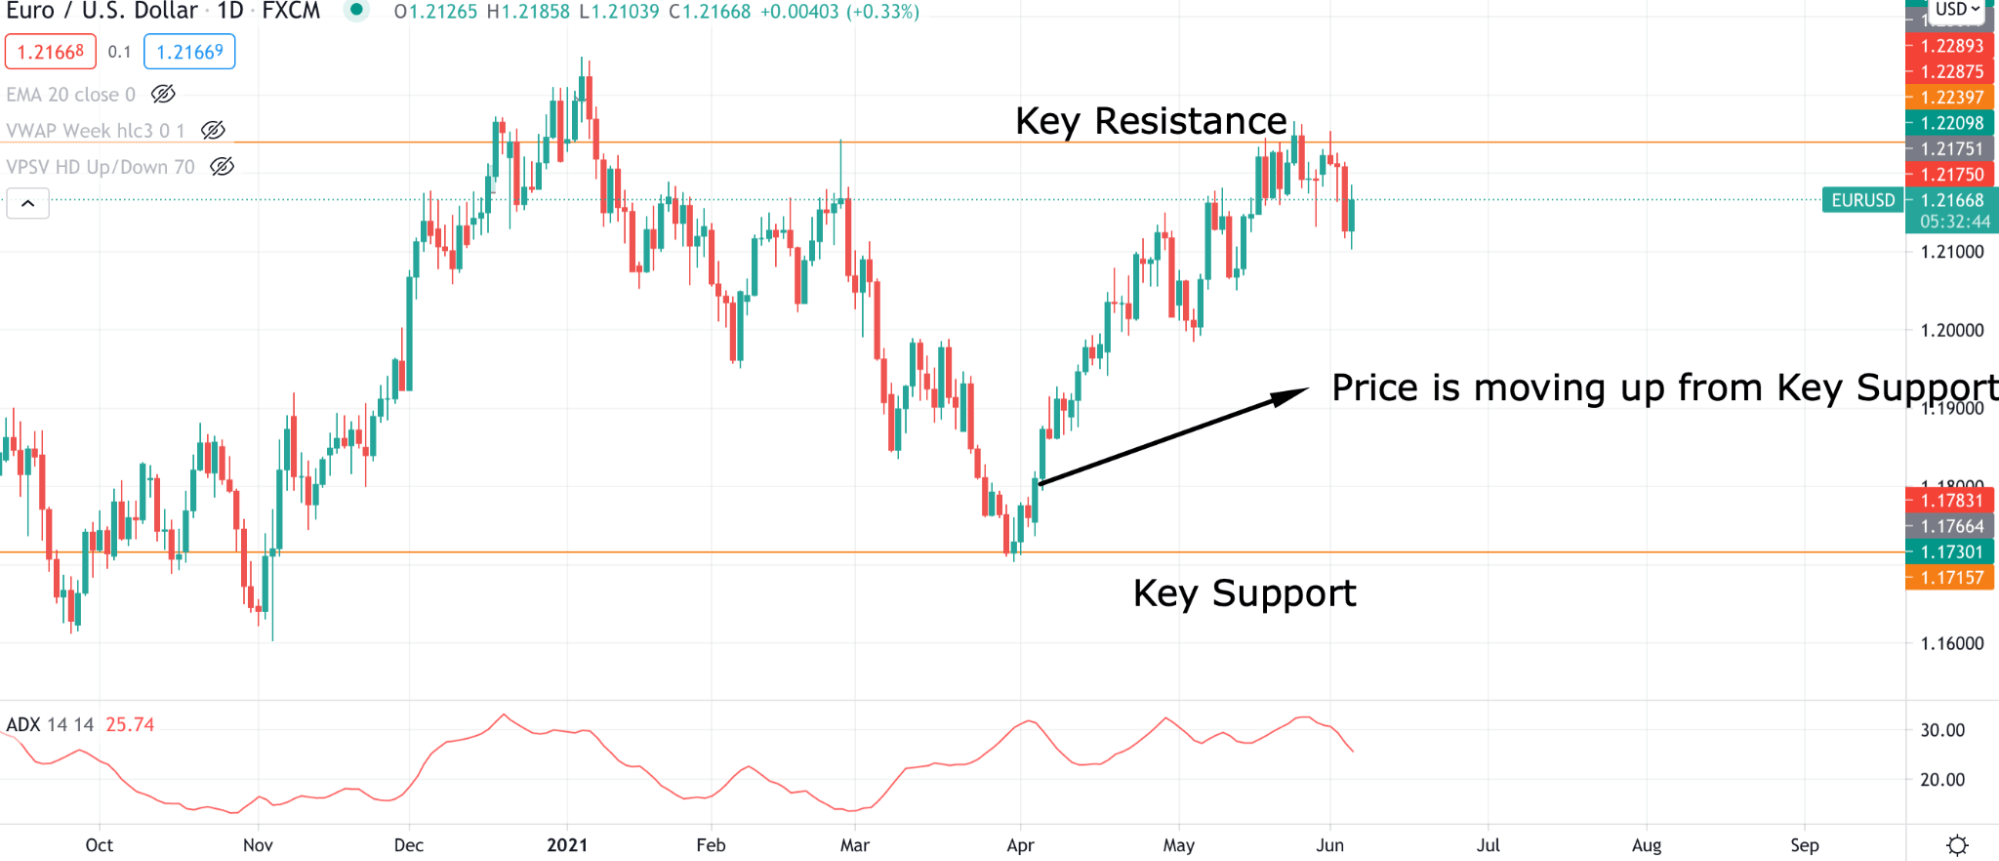
Here we can see the daily chart of EUR/USD, where the price is moving up from the key support level.
Step 2: Find price direction
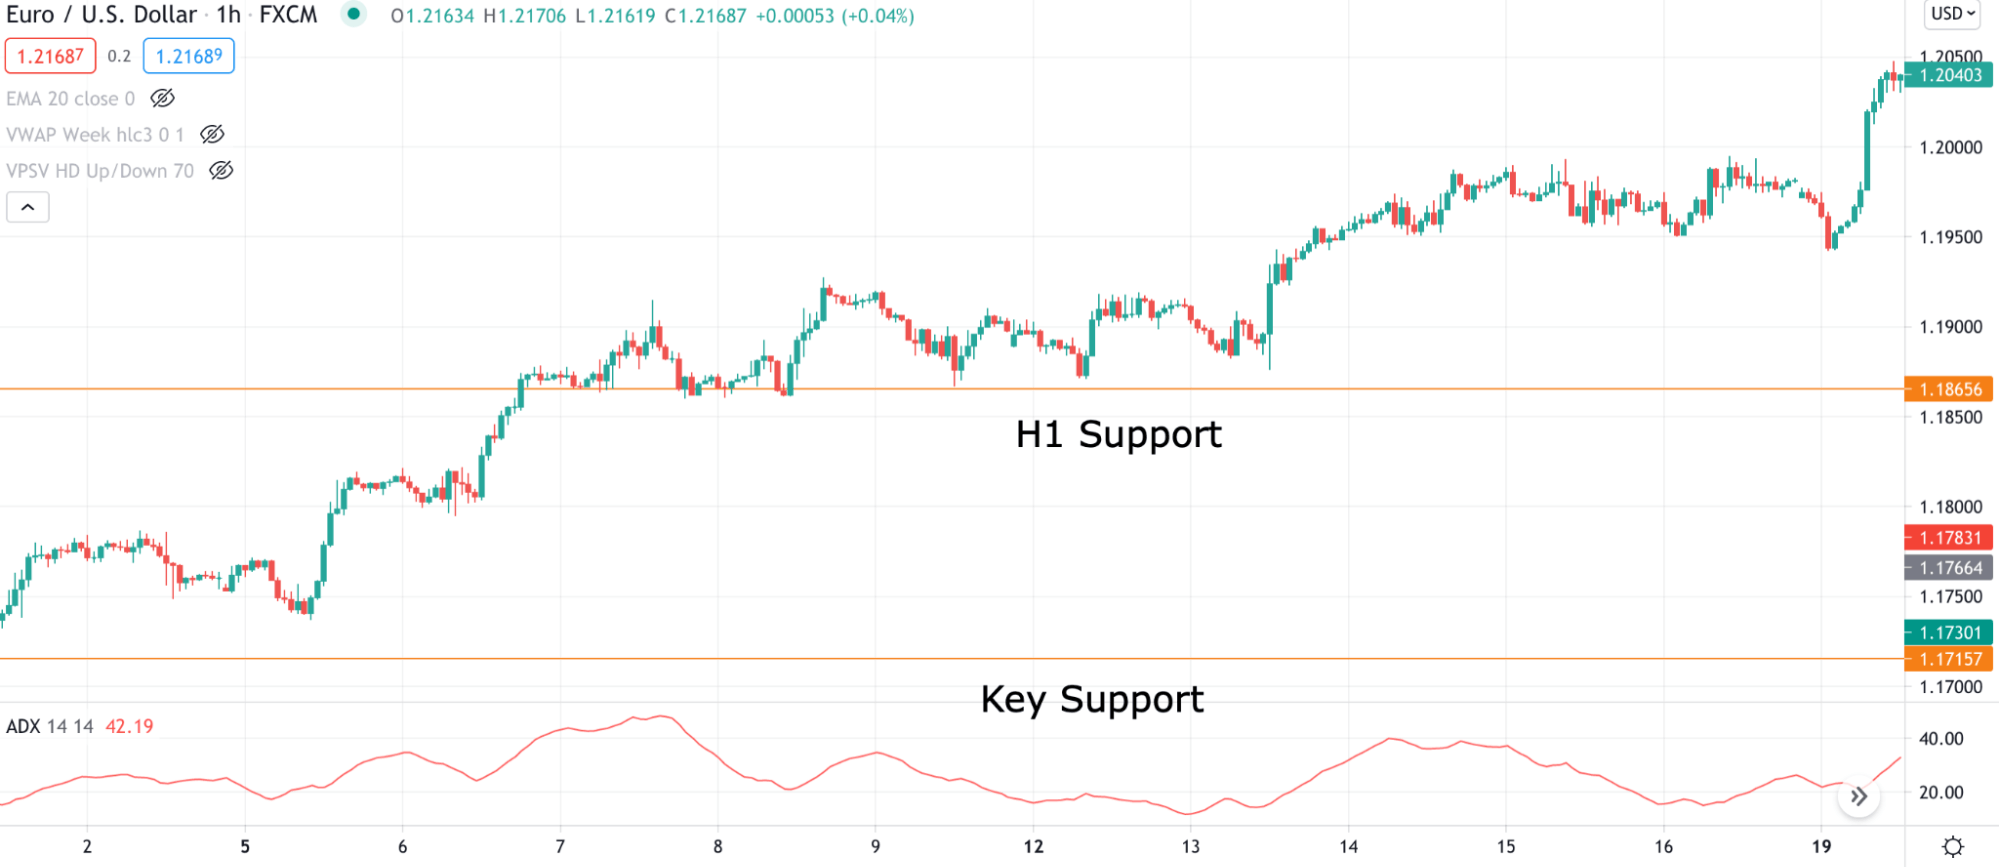
The second condition is to match the lower time frame’s direction with the higher time frame. We will use the H1 or M15 time frame as a lower one and find appropriate support and resistance levels on the H1.
Once the price moves up from the H1 support, we will enter the trade.
Step 3: Entry and exit
After H1, we should wait for a good time. Here the best time to enter the trade is during the London and US session.
During this duration, find a five minutes time frame to break above from the dynamic 20 EMA. As soon as the price starts to move higher, enter the trade and set the stop loss below the candle low with some buffer.
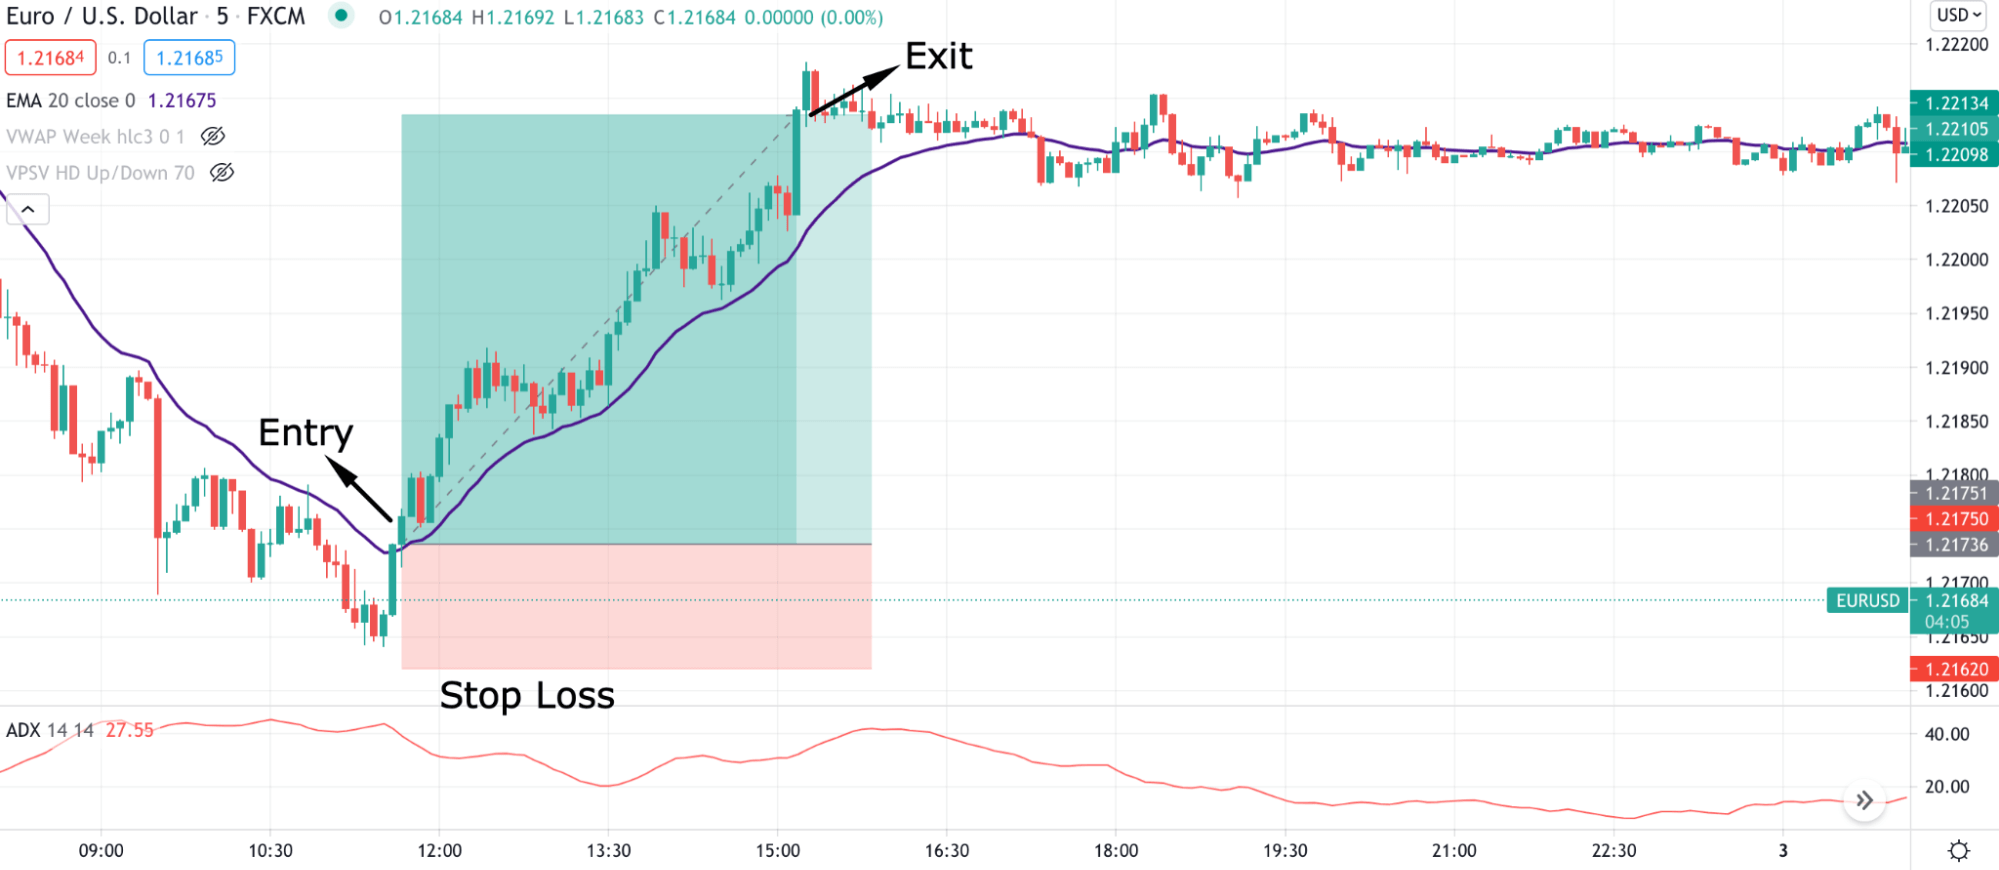
After moving 1:1, set the stop loss at breakeven and wait for a good swing level to close the trade altogether.
Predict a sell trend using multiple time frame analysis
In this section, we will see how to generate a sell trade using this analysis in a step by step approach:
Step 1: Find the sell direction
First, we have to find a bearish market by ensuring that long-term traders follow the sell direction.
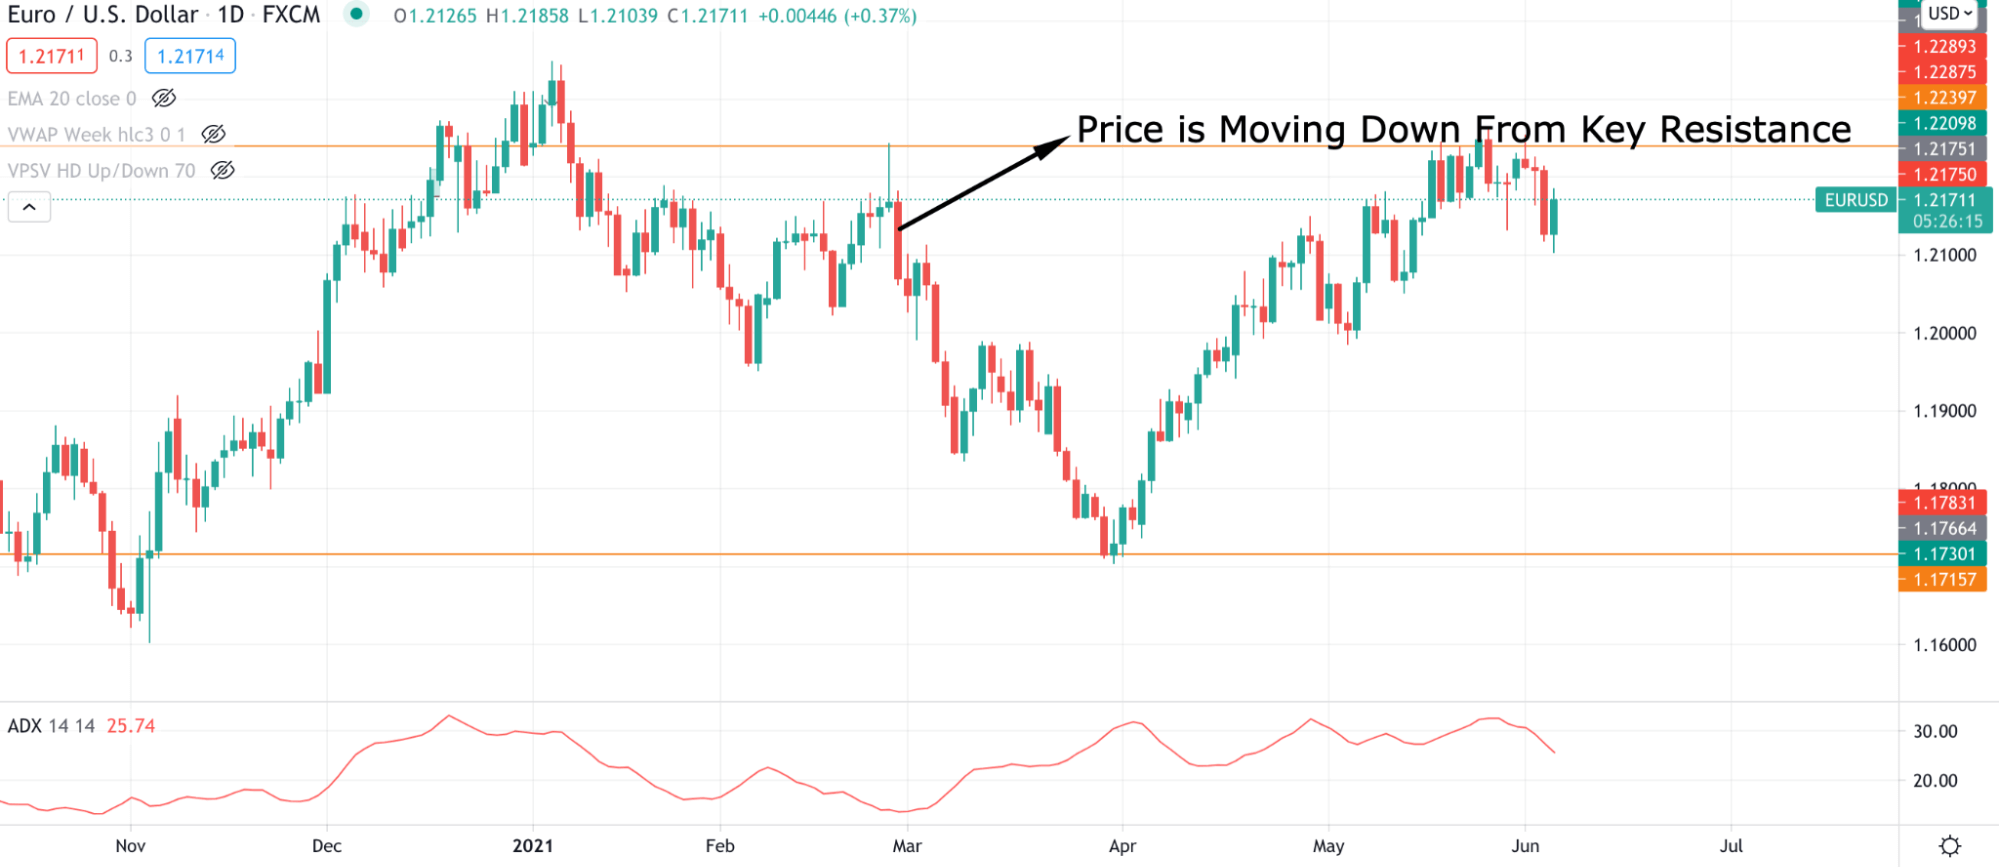
If the price moves down from any critical resistance level daily or weekly, we can consider the price direction as strongly bearish. Therefore, we will focus on sell trades and ignore all buy setups.
Step 2: Find price direction
In step 2, we should match the lower time frame direction with the higher time frame. As a lower time frame, we will use the H1 or M30 time frame and find appropriate support and resistance levels on the H1.
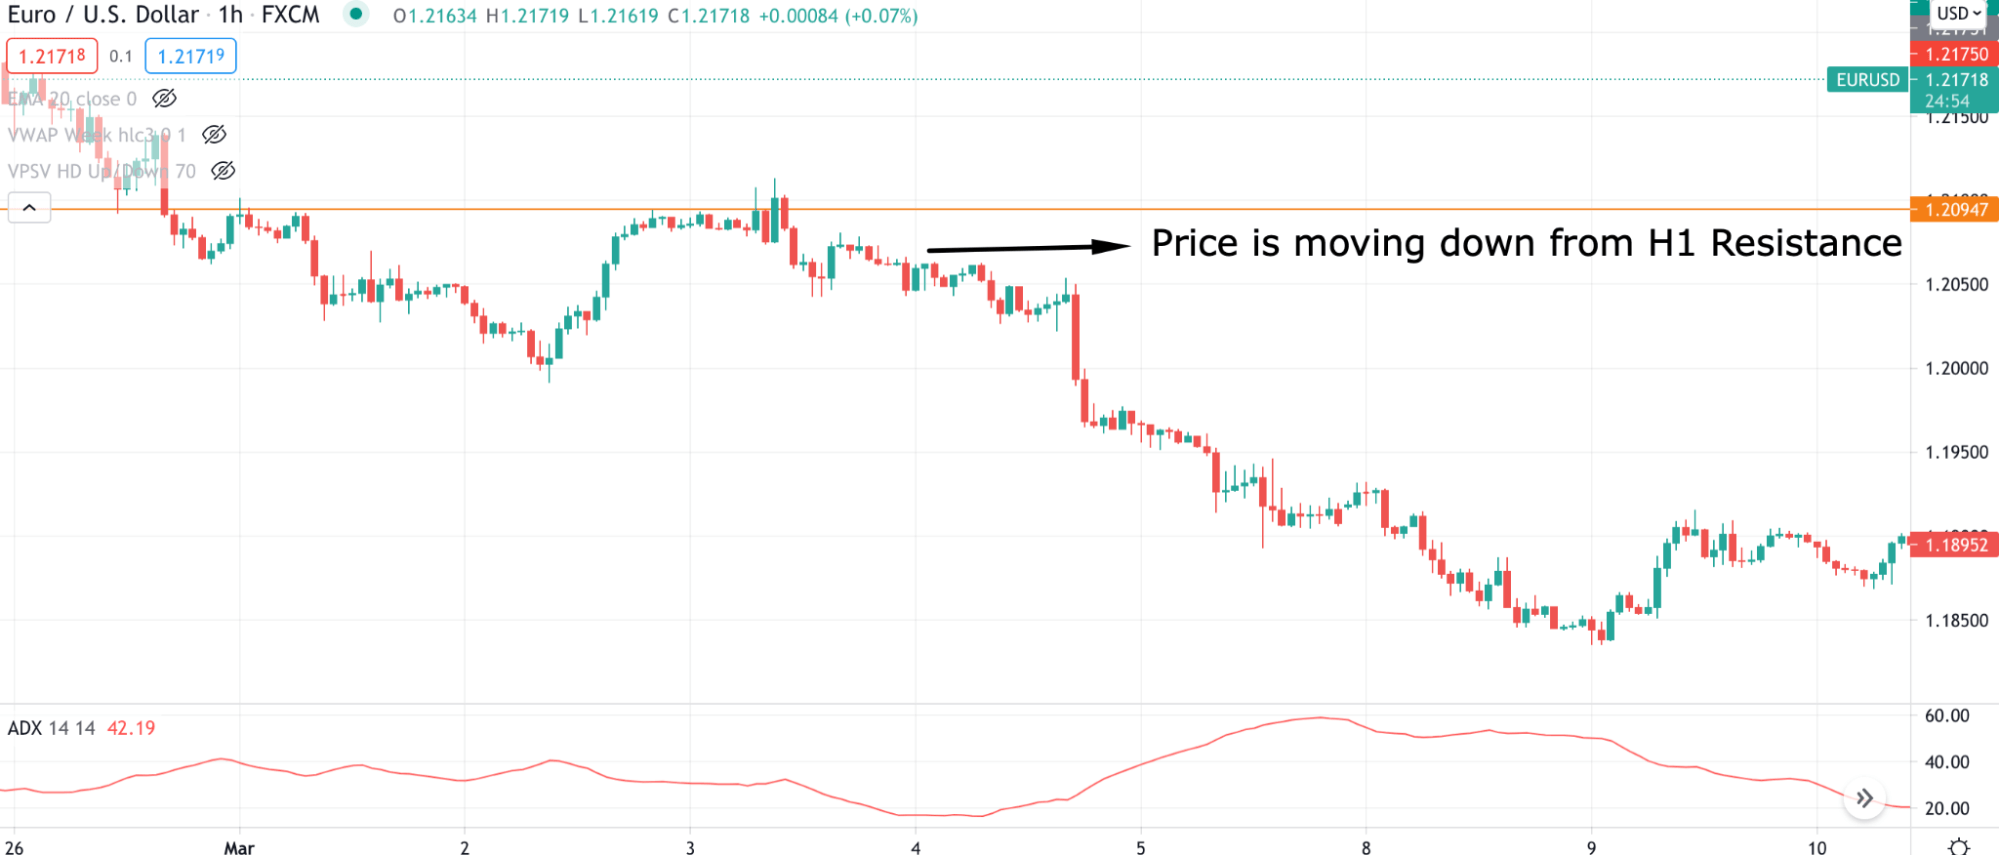
Once the price moves down from the H1 resistance, we will enter the trade.
Step 3: Entry and exit
After H1 direction waits for the best time to enter the trade is during the London and US session.
During this duration, find a 5 minutes time frame to break below from the dynamic 20 EMA. As soon as the price starts to move lower, enter the trade and set the stop loss above the candle low with some buffer.
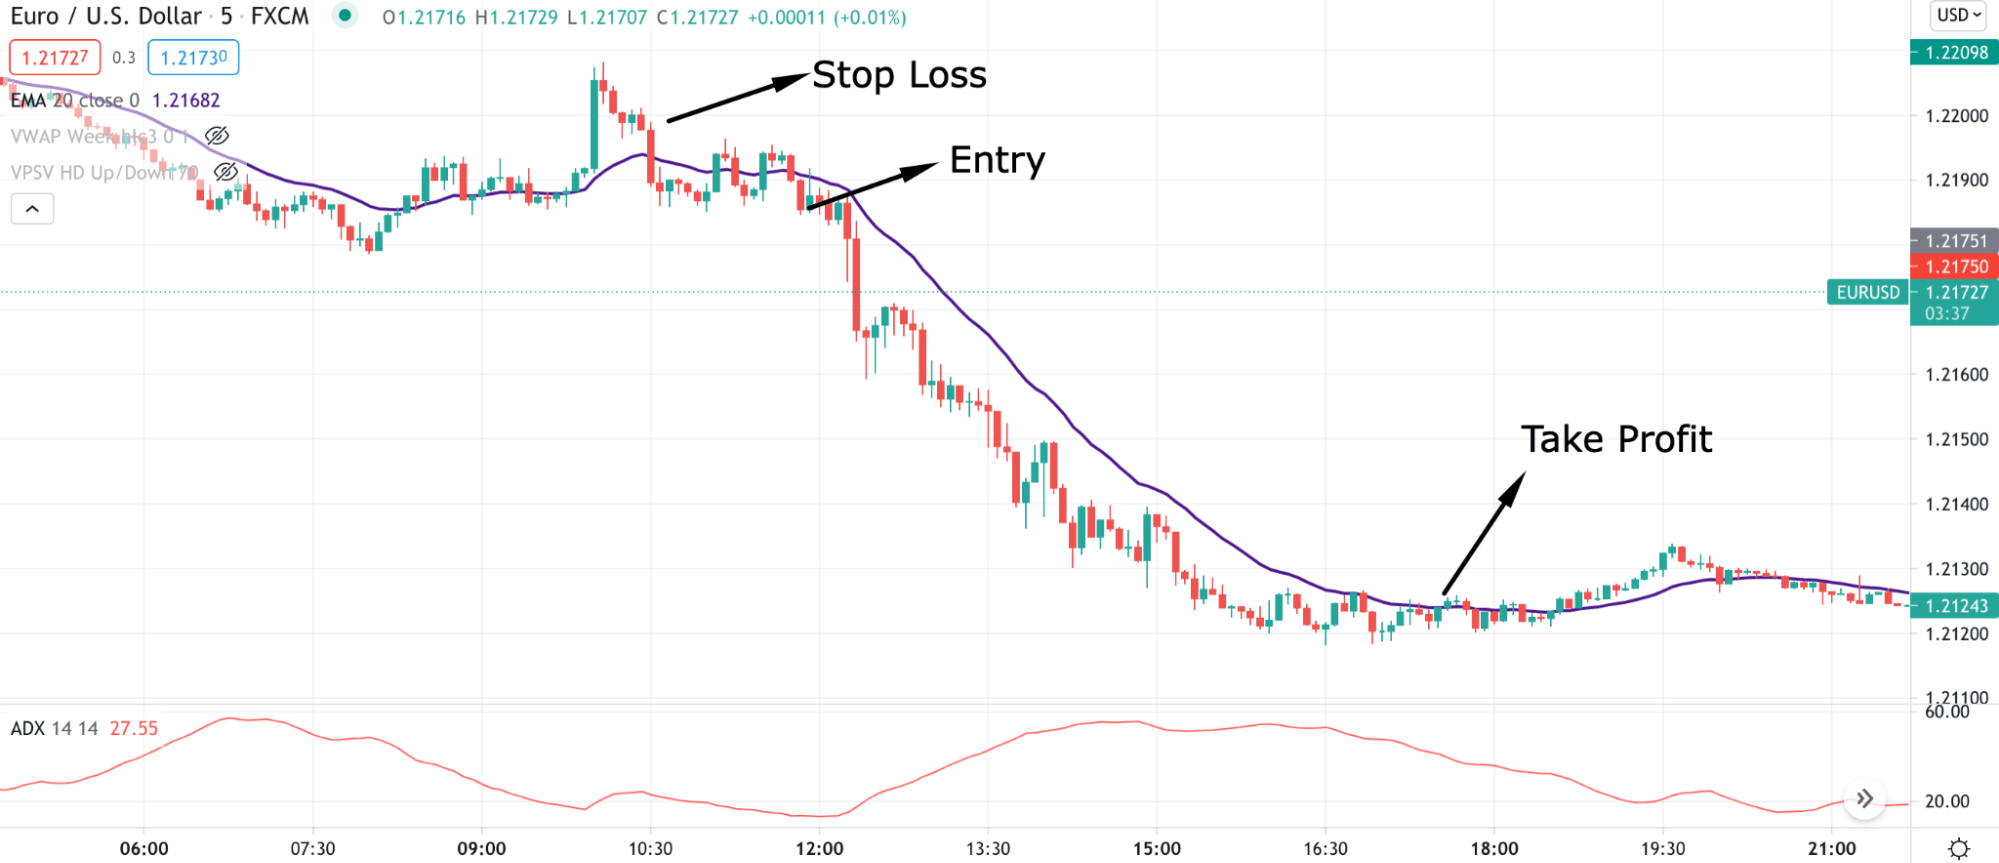
After moving 1:1, set the stop loss at breakeven and find the price at near term support level to close the trade.
Final thought: trade management
In the final section, we will discuss an essential element of trading that a trader should know. Finding a trade and opening a position is the primary phase of trading.
The FX is uncertain where the price may reverse at any time. So, you should read the price carefully after opening a position and look for critical fundamental data to release. In case of market uncertainty, use a smaller lot size to minimize the overall risk.


Comments