
Price action comes in various forms and flavors. You probably know about the classical chart patterns like wedges, triangles, head and shoulders, double tops and double bottoms, pennants, flags, and others. Most traders know about these price action patterns.
Candlestick trading is another popular price action strategy. You must have heard of hammers, engulfing candles, inside bars, evening stars and morning stars, piercing lines, dark cloud cover, and many others. Commonly, candlestick trading is used in combination with support and resistance. At times, it involves the use of trend lines.
Another price action strategy that has gained popularity in the past few years is harmonic trading. While it uses Fibonacci numbers to define the harmonic patterns, harmonic trading is ultimately a price action methodology.
The simplest of them all is probably the 1-2-3 pattern. You can find 1-2-3 setups every day on your charts. It can be a profitable trading strategy if you pair it with one or two technical tools.
There is another type of price action that is alien to most traders. This suite of price action strategies is put under the banner of Goodman Wave Theory. Although you can find material about it on Google and YouTube, what is available is very limited. This article will introduce you to Goodman Wave Theory through the return setup.
What is the return setup?
The return setup is the basic setup in Goodman Wave Theory. It is a commonly occurring price pattern in all charts from the one minute to the monthly time frame. However, not many traders know about it. This setup uses pure price action for its definition. The return setup and the whole corpus of Goodman Wave Theory do not utilize any technical indicator.
The return setup is a price pattern that requires four swings to form. It resembles the structure of the Elliott Wave pattern, but they are not the same. The four swings must form in a specific fashion to qualify as a proper setup.
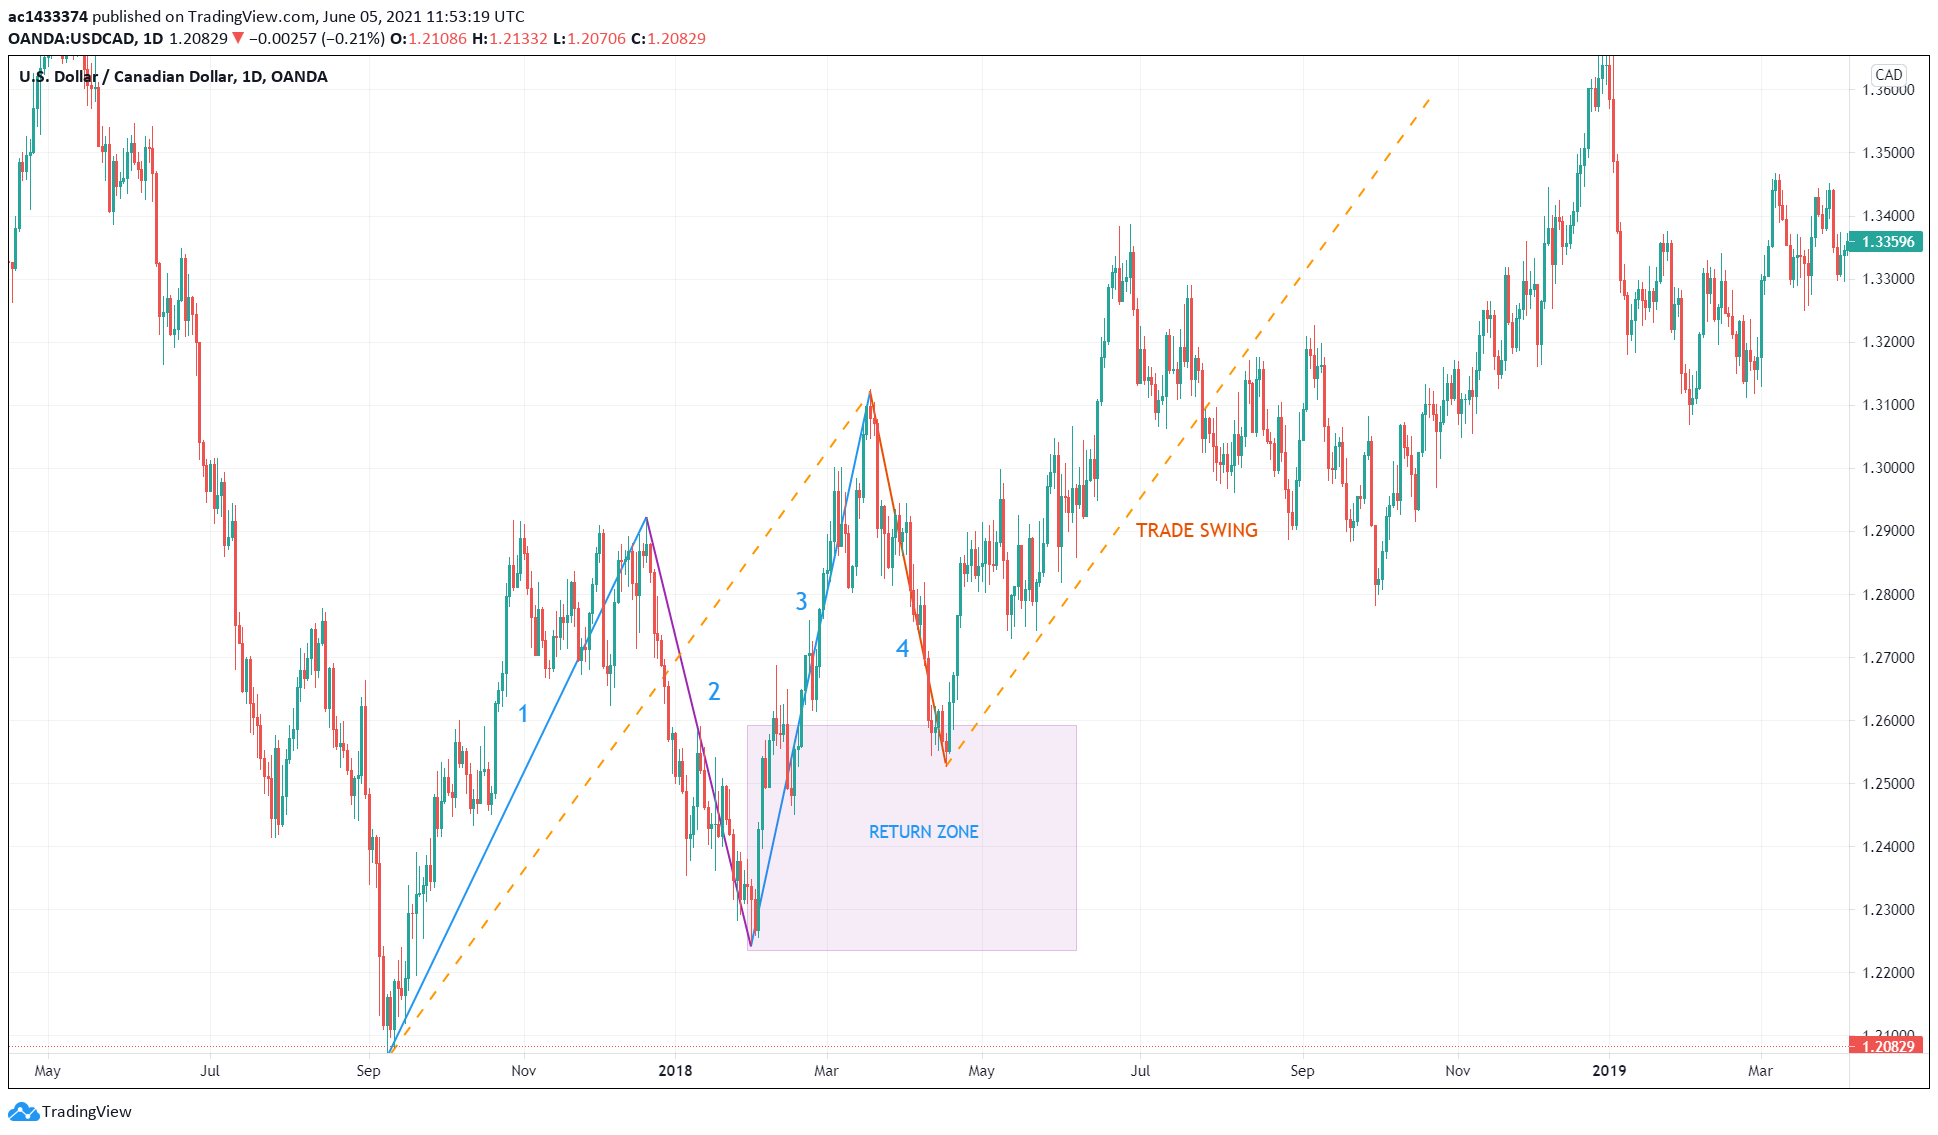
Let us use the above USD/CAD daily chart to understand how the return setup forms.
The following list explains the process:
-
First swing
An ideal first swing is essentially straight with very minimal fluctuations.
-
Second swing
A correction must follow, but it must not break the starting point of the first swing. The corrective swing is the second swing.
-
Third swing
It is impulsive in the same direction as the first swing. The third swing is completed when it breaks the ending point of the first swing. After the third swing forms, connect a line from the starting point of swing one to the ending point of swing three. This is the first dotted line in the above chart.
-
Fourth swing
It is a correction of the previous three swings, not just the third swing. While the fourth swing is forming, draw a rectangle using the ending point of swing two and the 50 percent retracement of the combined 1-2-3 swings. When the fourth swing enters the return zone, the return setup is complete.
In harmonic trading, 61.8 percent is the most crucial retracement level. On the contrary, the return setup takes the 50 percent level as the most critical retracement point. Price does not need to reverse precisely at the 50 percent. Swing four can go deeply into the return zone, but it should not violate the lower boundary of the rectangle.
Trade entry
You can start looking for entry once the price enters the return zone. One entry strategy is to open a trade when the price exits the rectangle in the setup direction. We are expecting the price to reverse when it touches the return zone. Therefore, the return zone is a reversal area. In the above chart, we are looking for a buy entry.
The best placement of your stop loss is the ending point of the second swing, plus the spread. To determine the take profit target, copy the line drawn from the lowest point to the structure’s highest point. Then align the starting point of the copied line with the ending point of swing two. Your take profit is the ending point of the projected line. This is the second dotted line above.
As you can see in the chart, the price managed to hit the take profit objective. In the course of reaching the profit target, the price may fluctuate up and down. You can use a trailing stop to adjust the stop loss as new swings form to secure the trade.
Trading with multiple time frame analysis
Trading the return setup is more profitable when you use multiple time frame analyses. With this approach, you often use a higher time frame to find a good location. This location can be an apparent support or resistance area. Adding the trend consideration may prove helpful, but it is not a requirement for the return setup.
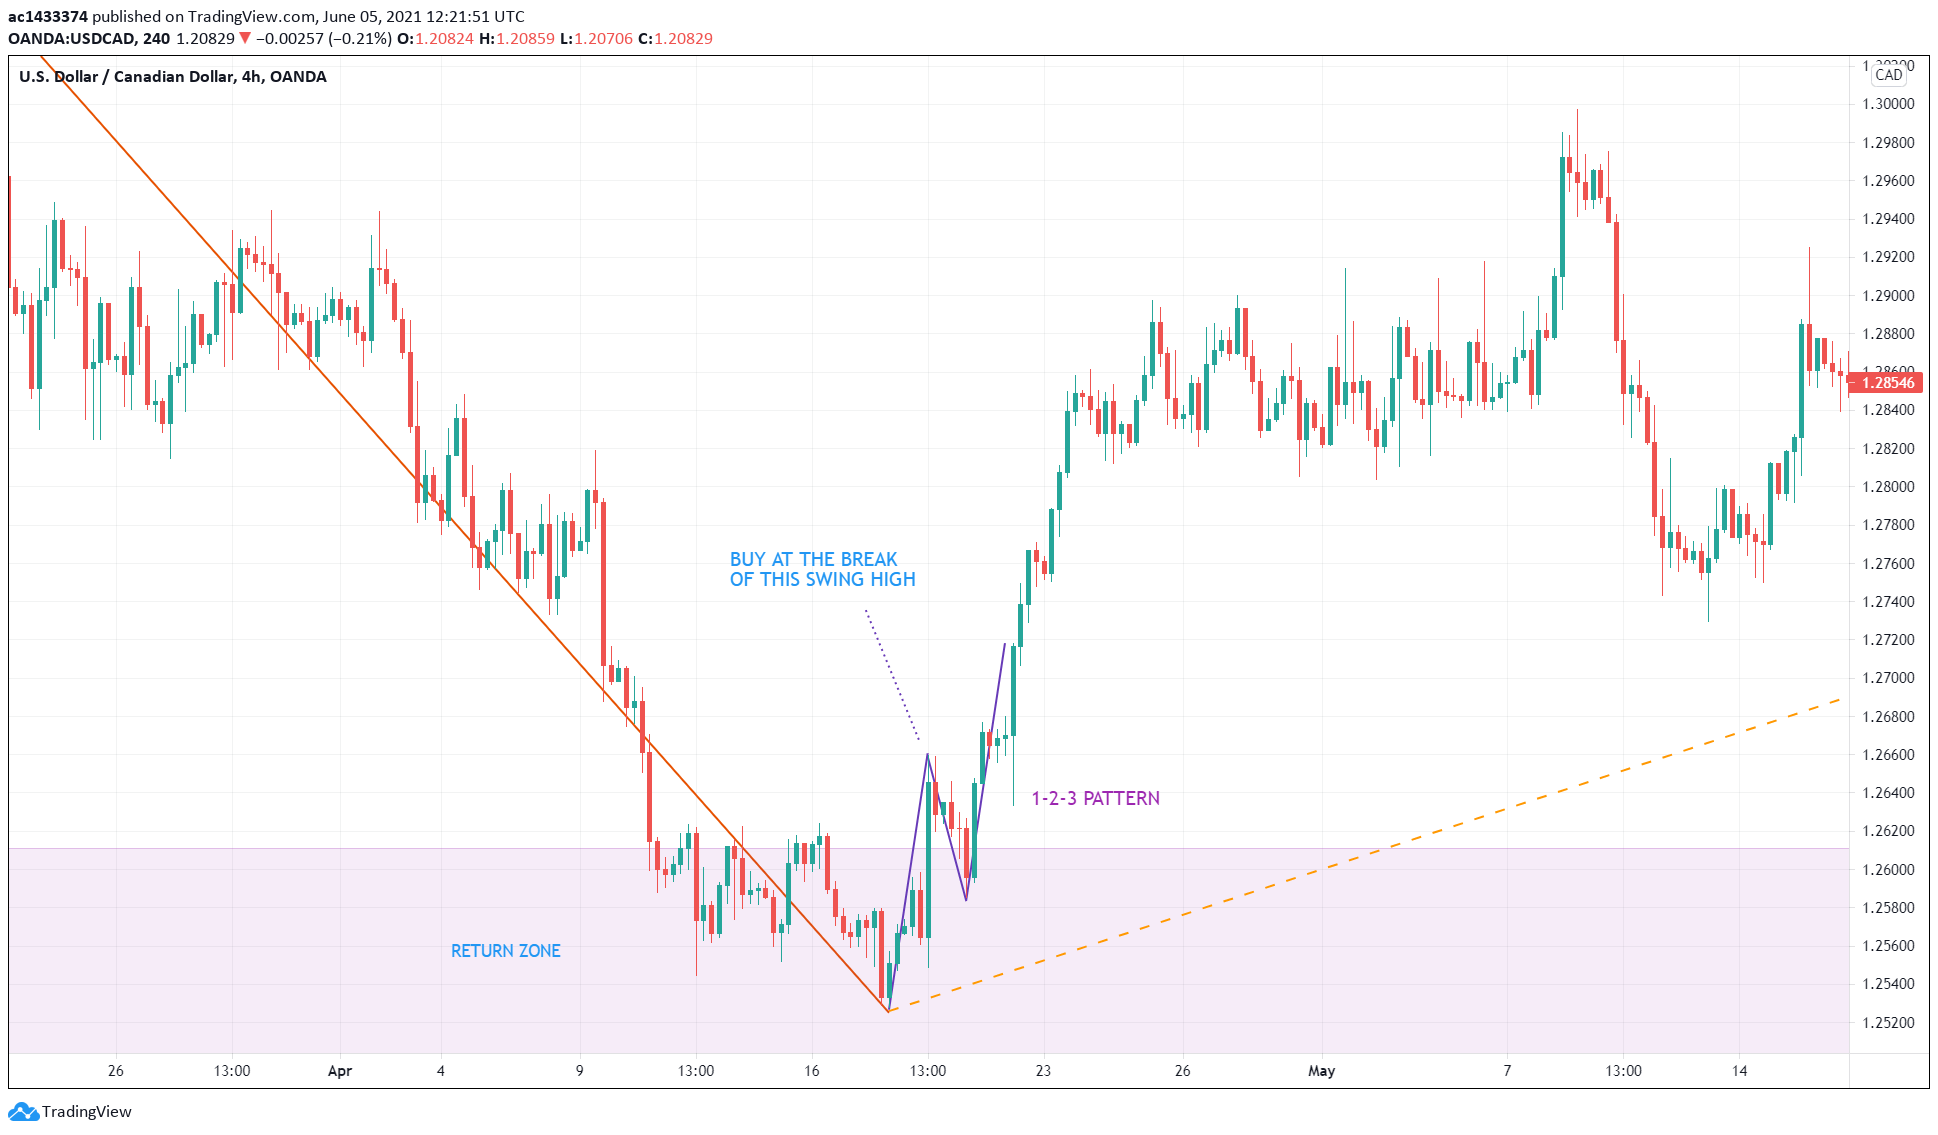
You can also use multiple time frame analysis to zoom into the return zone at a lower time frame to find better trade entries. Continuing from the previous example, we zoom into the four-hour chart at the location where price entered the return zone. Here we see that we could have entered a buy trade using the 1-2-3 pattern. However, the actual entry occurs when the price breaks the swing high of the first swing in the 1-2-3 pattern. Again, refer to the above chart.
The advantage of this type of entry is that you can minimize the risk by setting a minor stop loss. The stop loss, in this case, is the lowest point of the 1-2-3 pattern plus the spread. The original setup requires the stop loss to be placed way below this point. As a result, the trade has a higher risk-reward ratio because you can keep the original “take profit” target.
Final thoughts
The return setup is a compelling entry strategy. It is a pure price action setup with built-in stop-loss and take-profit specifications. Do not mistake this setup with Elliott Wave Theory. The author’s humble opinion is that the return setup is better than the Elliot Wave in many respects.
Not many traders are using this strategy. Successful return setups are all over the place. One reason why it works is that the setup generates a signal in line with the trend. Consider the structure of the setup. It forms either a series of higher highs and higher lows or lower highs and lower lows.


Comments