
OMNI is a trend trading tool available for MetaTrader 5 platform where making a profit is possible by determining where the price is heading from the OMNI indicator. Like other trading tools, OMNI moves below or above the price and works as support and resistance. Therefore, utilizing this tool with other elements would provide a decent return from the market.
While making a trading decision, it is essential to follow some rules where risk management is a core part. The same method applies to the OMNI indicator, where traders need a proper system to utilize this tool. The following section will see everything a trader should know about the indicator, including the exact buying and selling approach.
What is OMNI trend indicator crypto strategy?
The OMNI is built with the NRTR formula, where the concept of moving average and ATR is used to find the future price direction of a trading asset. This indicator can generate continuation and reversal signals, applicable in any time frame.
Moreover, traders can utilize it with other tools like MACD and RSI to generate highly profitable signals. However, the crypto market is volatile, where uncertain movements are prevalent. Following a strict trade management system after enough backtesting might be a valuable tool for investors.
How to trade using OMNI trend in trading strategy?
OMNI trend is an MT5 indicator available for free. As it is a custom indicator, investors should copy the *.ex4 file from the internet and paste it into the specific MT5 directory. After that, restart the platform would make this indicator visible from the menu bar.
Now, this indicator is visible on the chart where investors can change the time frame and instrument type according to their choice. However, the generating bullish/bearish signals need to follow a trading approach like buying once multiple bullish conditions are met.
The following section will see a trading approach using the OMNI and MACD histogram, but you can use this tool with other indicators.
A short-term trading strategy
This section will see how to take buy trades from the indicator in the intraday chart. As the crypto market is volatile, traders should stick to larger-cap cryptos only while taking trades.
Bullish trade scenario
Short-term buy example
The perfect buy trade will come once the OMNI and MACD show the same signal. Moreover, as it is a lower time frame trade, investors should make sure that the bullish signal matches the long-term bullish direction.
Entry
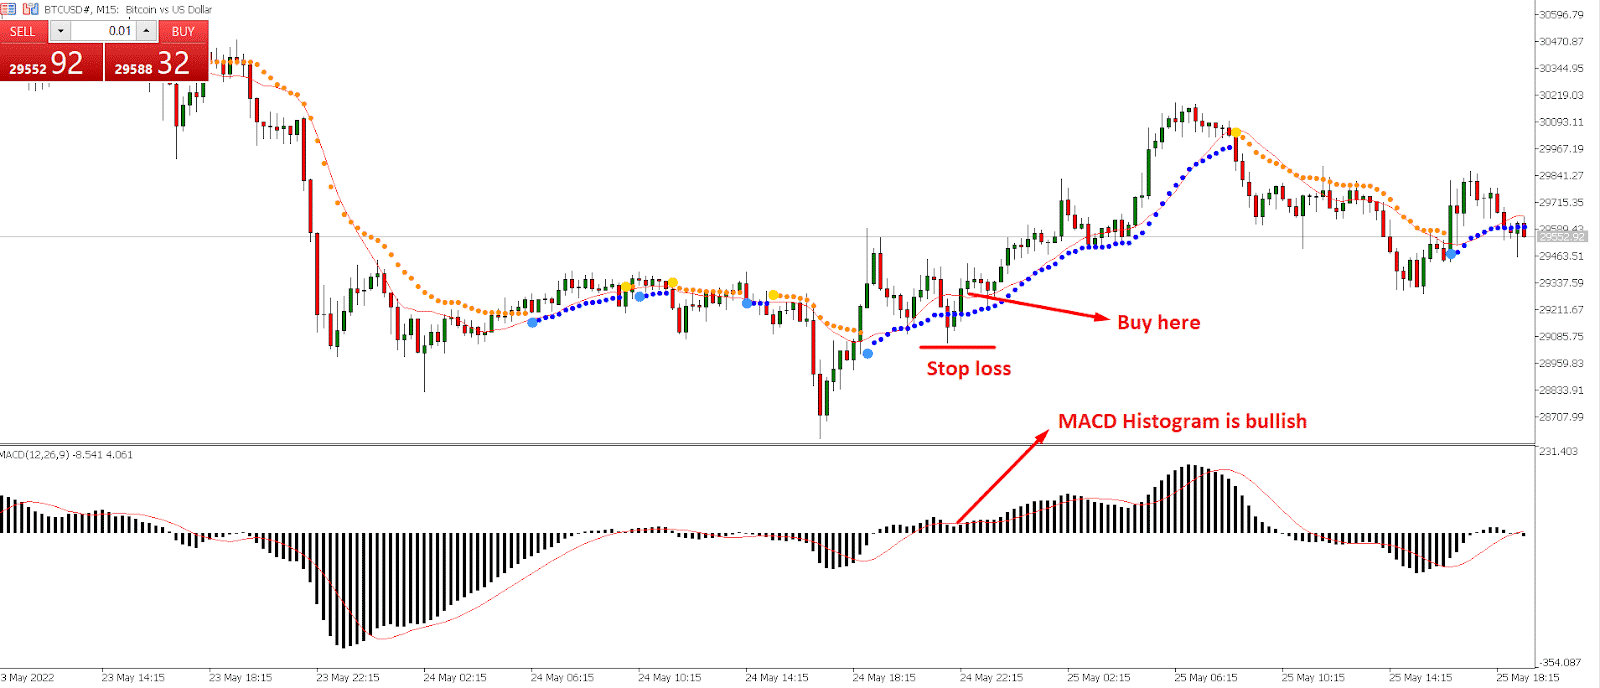
The short-term buy entry is valid once these conditions are present in the 15 minutes chart:
- The long-term market direction is bullish where the current price trades above any important support level in the H4 chart.
- In the 15 minutes chart, the price moves up, and a bullish candle closes above the OMNI line.
- MACD histogram is above the neutral line.
- Open a buy position from the bullish candle close.
Stop loss
The ideal stop loss is the most recent swing level below the OMNI line with some buffer.
Take profit
Close 50% of the position based on a 1:1 risk vs. reward ratio and move the stop loss at break even. Later on, hold the trade until it reaches any significant resistance level.
Bearish trade scenario
Short-term sell example
The bearish short-term trade will be valid once the OMNI and MACD show the same signal. Moreover, investors should make sure that the long-term trend is bearish.
Entry
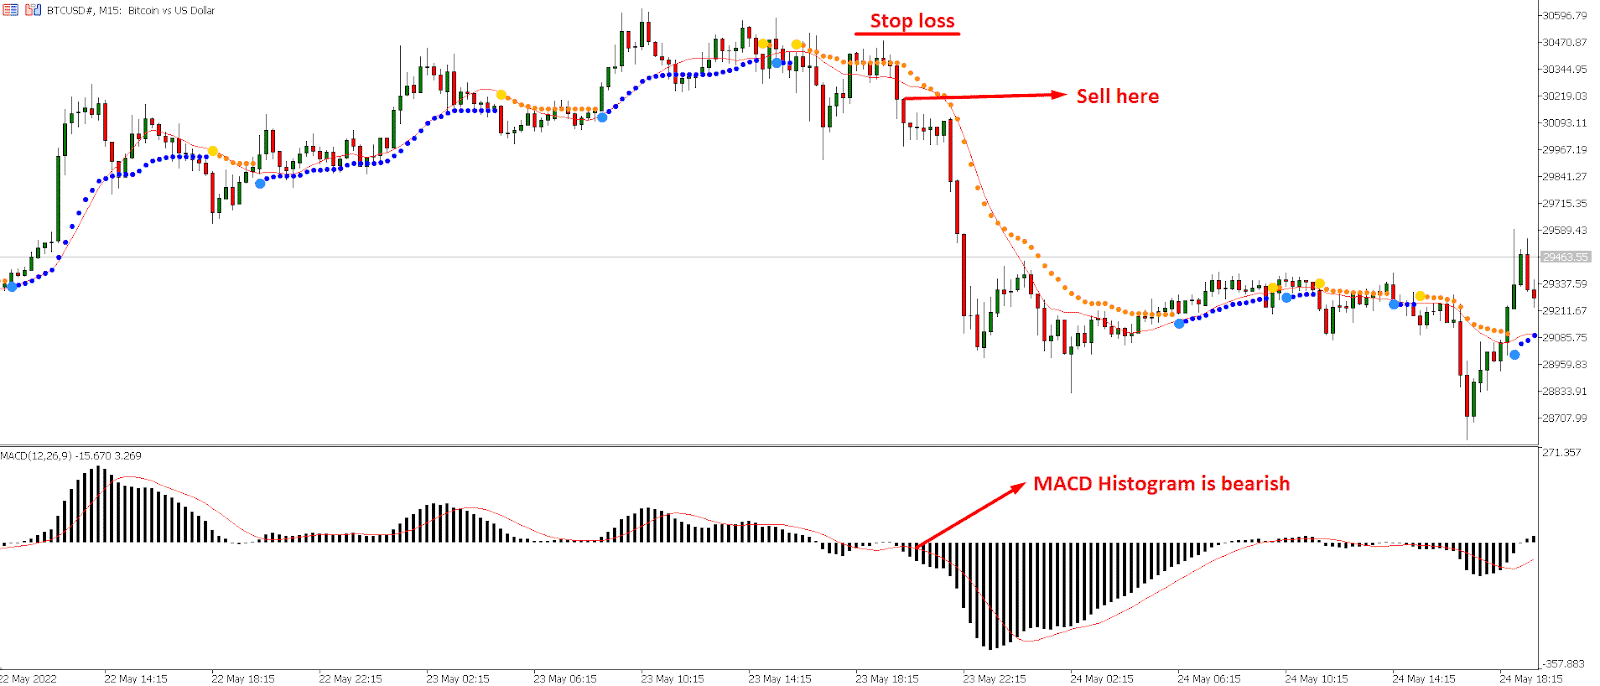
The short-term bearish entry is valid once these conditions are present in the 15 minutes chart:
- The long-term market direction is bearish where the current price trades below any important resistance level in the H4 chart.
- In the 15 minutes chart, the price moves the OMNI line.
- MACD histogram is below the neutral line.
- Open a sell position from the bullish candle close.
Stop loss
The ideal stop loss is the most recent swing level below the OMNI line with some buffer.
Take profit
Close 50% of the position based on a 1:1 risk vs. reward ratio and move the stop loss at break even. Later on, hold the trade until it reaches any significant support level.
A long-term trading strategy
Here we will see how to buy crypto in the daily chart to catch long-term benefits. This method applies to large and mid-cap cryptos for HODLing.
Bullish trade scenario
Long-term buy example
The long-term buy trade is valid once the OMNI and MACD histogram shows the same signal. Moreover, investors should closely monitor where the current support and resistance are showing.
Entry
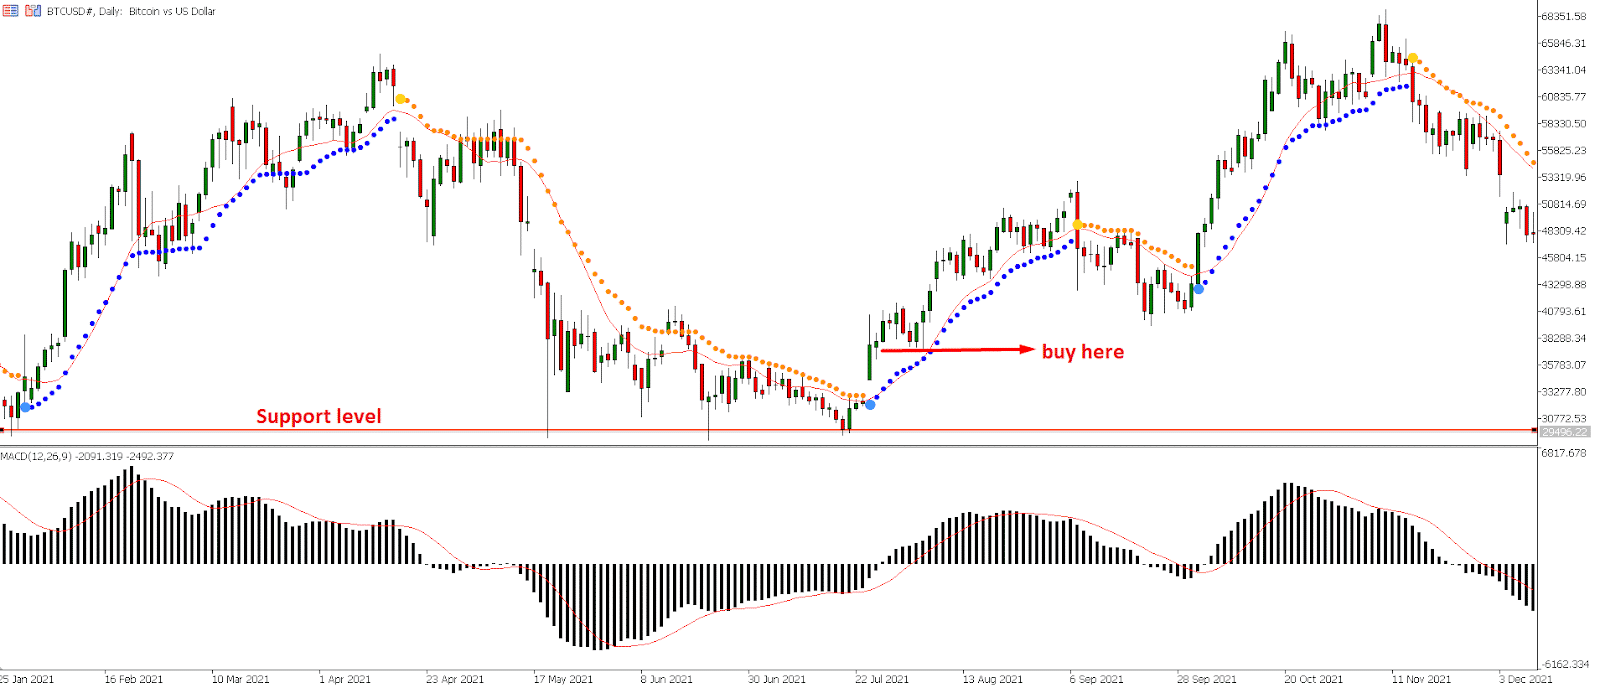
The long-term buy trade should come from these steps:
- The price moves down and shows a bullish rejection from the daily support level.
- After that, a new swing high formed before showing a rejection from the OMNI indicator.
- Wait for a candle close above the OMNI and take a buy trade.
Stop loss
The ideal stop loss is below the OMNI indicator, but you can set it according to your trading strategy.
Take profit
Once the price moves up, make sure to close the 50% position after reaching a 10% to 20% price surge, but you can hold it more for further gains.
Bearish trade scenario
Long-term sell example
The long-term sell trade is valid once the OMNI and MACD histogram shows the same signal.
Entry
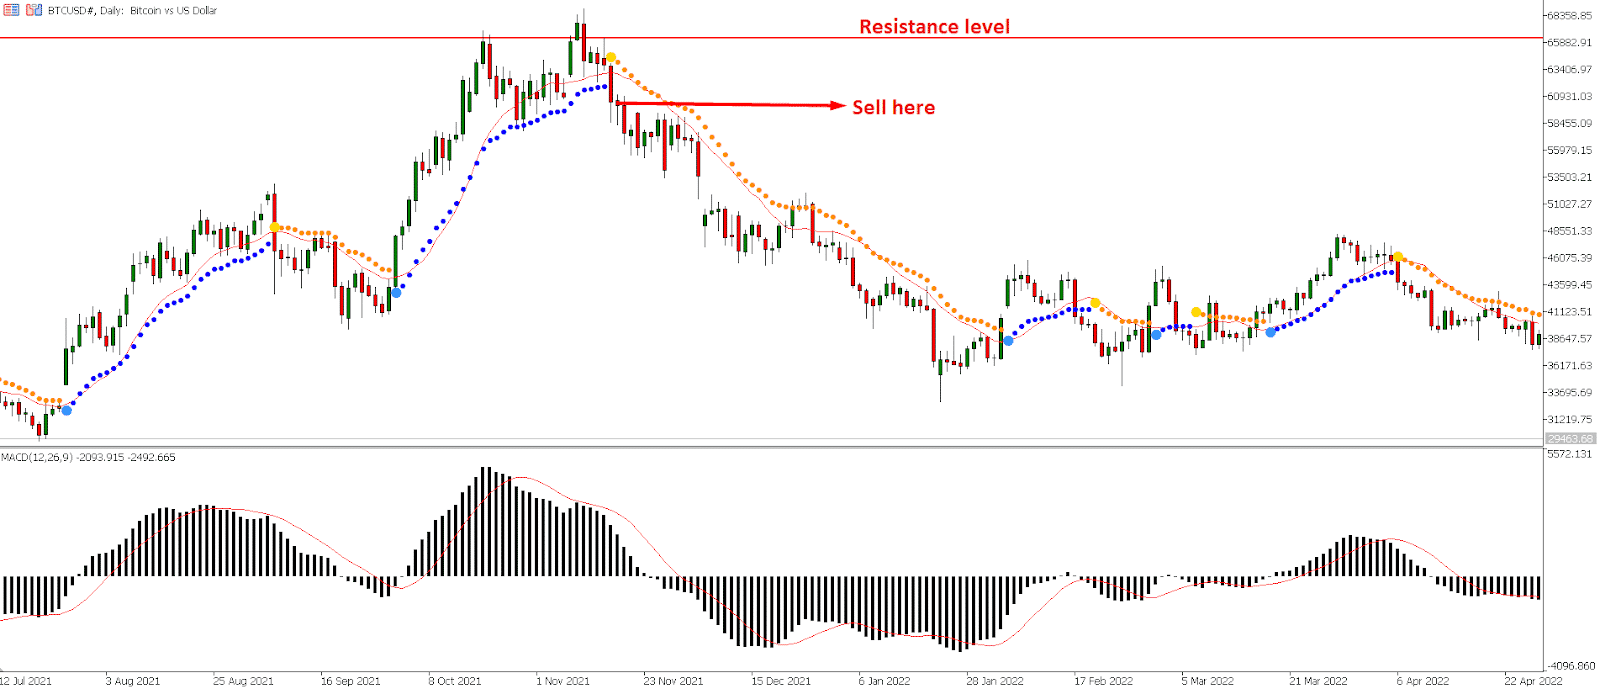
The long-term sell trade should come from these steps:
- The price moves up and shows a bearish rejection from the daily resistance level.
- After that, a new swing low formed before showing a rejection from the OMNI indicator.
- Wait for a candle close below the OMNI and take a sell trade.
Stop loss
The ideal stop loss is above the OMNI indicator, but you can set it according to your trading strategy.
Take profit
Once the price moves down, make sure to close the 50% position after reaching a 10% to 20% price surge, but you can hold it more for further gains.
Pros & cons
| 👍 Pros | 👎 Cons |
|
|
|
|
|
|
Final thoughts
OMNI strategy is a profitable method to generate money from the crypto market following some easy steps. Besides, investors should remain cautious about the risk associated with this method by following a sound risk management system.


Comments