Forex Neutrino trading system for MT4 is an easy-applying trading method that uses some trend and momentum-based technical tools to identify profitable trading positions that contain low risks and high gaining probability.
FX moves by creating highs and lows. This trading system identifies that highs and lows show the direction of the price and the traders’ or buyers’ and sellers’ density at a specific time for the applied asset chart of the MT4 platform.
What is the FX Neutrino trading system for MT4?
This is a straightforward applying trading method suitable for any kind of trader to find out the most probable and profitable entry/exit points.
The FX is decentralized, and the big boys of this market are the central banks. Therefore, there is no way to manipulate the price as all traders see the same price action.
Institutional traders use the same chart as retail traders to analyze and find out trading positions, where the essential difference is in the time frames they trade. Higher time frames always provide a better price outlook with a birds-eye view.
You can apply this trading system to any time frame, but the recommended time frame is 15min, 30min, and 1-hour chart.
Let’s have a look at tools/ indicators used in this strategy:
- Laguerre
- Megatrend
- Zig Zag pointer
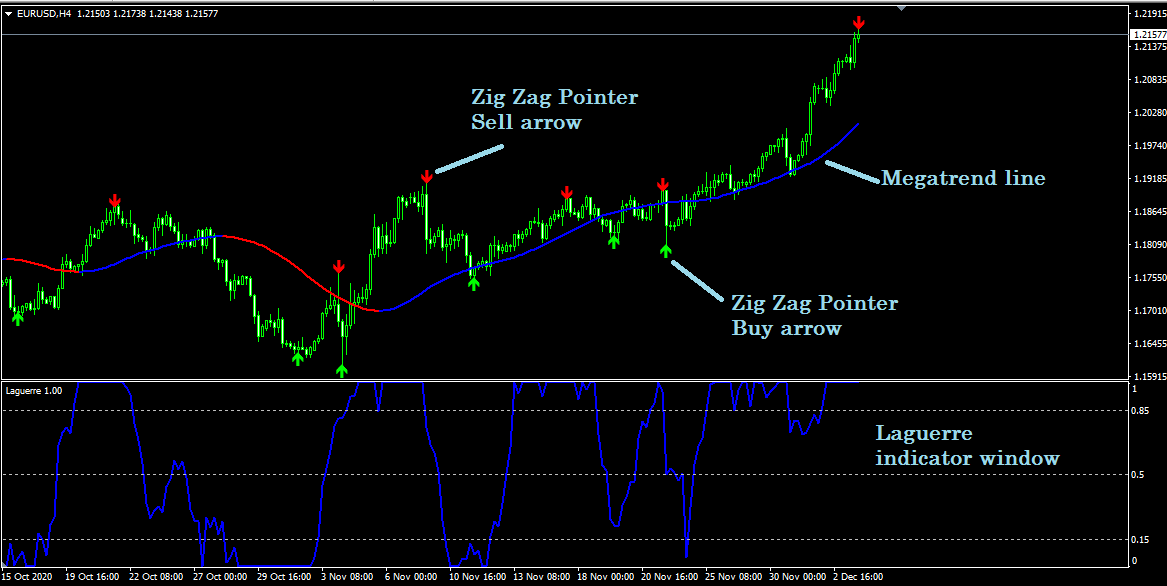
After applying all of this trading system’s features, the MetaTrader 4 chart will look like the above.
Specification of tools
-
Laguerre
A custom-made indicator is an independent window with the range of 0-1 that shows the overbought/oversold conditions for the assets as the very familiar RSI indicator.
For example, when the blue indicator’s line window remains at or crosses above the 85, it indicates an overbought situation or the price remains at an uptrend. Still, when the reading is crossed below or at the 15 or lower line, it shows an oversold condition for the asset, and price movement may appear at a downtrend.
-
Megatrend
A custom-made moving average (MA) indicator changes colors for a different price movement for the asset. For example, this indicator line becomes blue for an uptrend price movement of the asset, red for a downtrend market.
-
Zig Zag
A widespread tool to identify the swing highs and lows, so the ZigZag pointer is. This indicator makes green arrows under swing lows and red arrows above swing highs.
Bullish trading strategy
Sorting out the precious buy positions by this trading method is very easy and effective. It shows the swing high/lows, draws the trends (also support/resistance levels) and volatility at once and every time frame.
This system works great at any time frame for any major currency pair, but the recommended time frames are 15min, 30min, and the 1-hour chart.
Bullish trading conditions
- A swing low is created, and the green or buy arrow appears below the recent swing low.
- Look for the confirmation of the megatrend line and wait until it starts to get blue.
- Check the Laguerre window and wait until the reading touches or crosses above the 75 or upper line, indicating overbought or the buyer’s domination at asset.
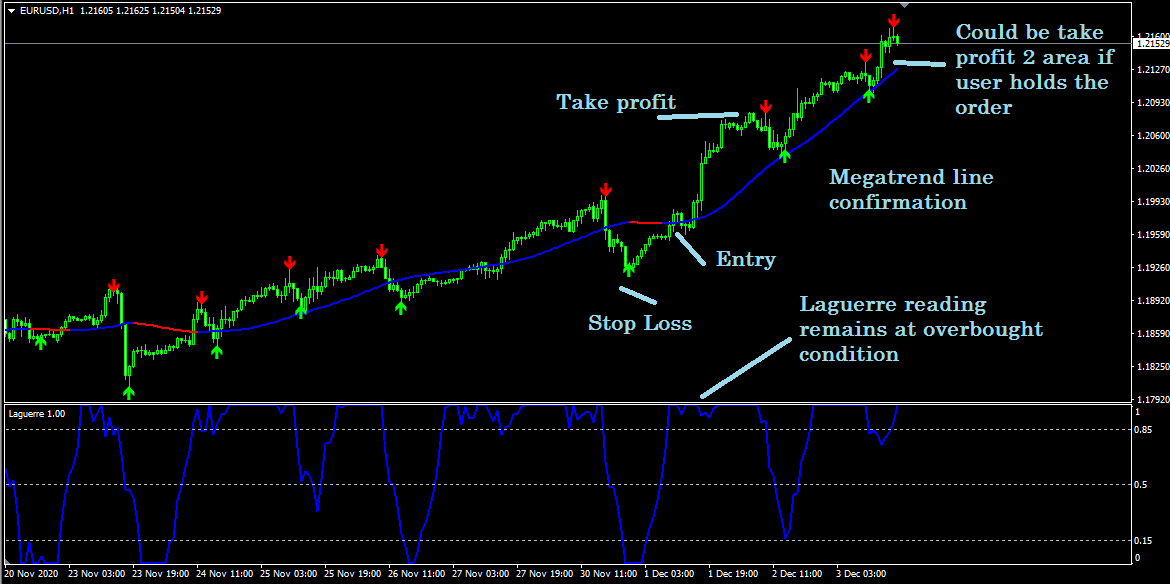
Entry
Check all the above buy conditions for this trading method. Then check the
upper time frame for confirmation. After that, confirm that the asset remains in buy safely. Then wait for the current bullish candle to close and place a buy order at a suitable price.
Stop loss
Initial stop loss will come below the recent swing low with 5-10 pips buffer at 1-hour chart to reduce risks, stop losses can be shifted to the breakeven or above it after price creates a higher high.
Take profit
The initial take profit or exit area will be at the point where the opposite or sell or red arrow appears or the price crosses below the megatrend line. As this is a trend-following strategy, minor retracements of lower time frames can be ignored but don’t hesitate to exit as the megatrend line starts to red.
Bearish trading strategy
Sorting out the precious sell positions by this trading method is very easy and effective. It shows the swing high/lows, draws the trends (also support/resistance levels) and volatility at once and every time frame.
This system works great at any time frame for any central currency pair, but the recommended time frames are 15min, 30 min, and the 1-hour chart.
Bearish trading conditions
- A swing high is created, and the red or sell arrow appears above the recent swing high.
- Look for the confirmation of the megatrend line and wait until it starts to get red.
- Check the Laguerre window and wait until the reading touches or crosses below the 15 or lower line, indicating oversold or the seller domination at asset.
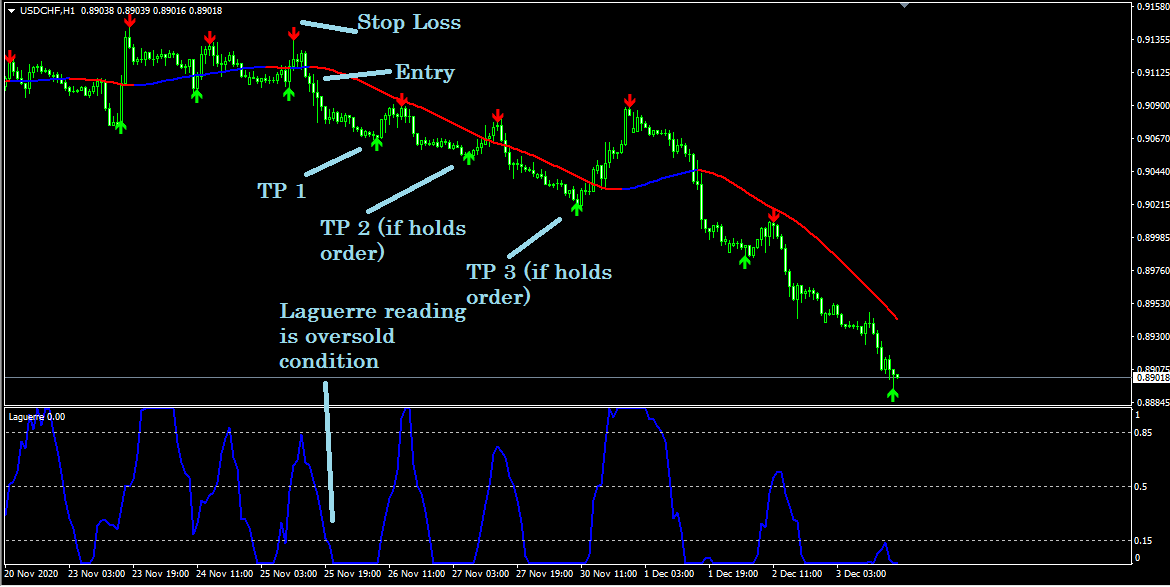
Entry
Check all the above sell conditions for this trading method. Then check the upper time frame for confirmation. After that, confirm that it remains safe, and wait for the current bearish candle to close and place a sell order at a suitable price.
Stop loss
Initial stop loss will be above the recent swing high with a 5-10 pips buffer at a 1-hour chart to reduce risks. Stop losses can be shifted to the breakeven or below it after the price creates a lower low.
Take profit
The initial take profit or exit area will be at the point where the opposite or buy or green arrow appears or the price crosses above the megatrend line. As this is a trend-following strategy, minor retracements of lower time frames can be ignored but don’t hesitate to exit as the megatrend line starts to get blue.
Final thoughts
Users must be disciplined, verify all conditions carefully, and check higher time frames to identify fake swing high lows before making any entries.
In addition, it is better to avoid trade with this strategy during NFP, FOMC announcement, Fed interest rate decision, or any other major fundamental economic events as any of them cause unstable/unexpected price movement at a certain period.


Comments