
Crypto Melih Strategy is a unique technical method that helps investors determine efficient trading positions. This method combines three different indicators concepts at once to suggest trading positions, so no wonder this approach has become attractive to crypto investors.
This article will introduce you to the crypto Melih strategy alongside describing trading strategies with chart attachments for better understanding. Moreover, we will list the top pros and cons later to reveal the actual potentiality. However, without learning specifications and a clear concept of any method, it is not wise to rely on it while making trade decisions.
What is the crypto Melih strategy?
This method relies on three different indicator readings to generate trade ideas, and it combines three different calculations to determine trading positions.
This custom-made indicator uses three technical indicator concepts:
- Moving stop loss indicator
- Moving average convergence/divergence (MACD)
- Fisher transform on stochastic
All these three indicator concepts are individually valuable and familiar to financial investors. Combining all three usually suggests more efficient trading (entry/exit) positions. This method is suitable for many trading instruments, including cryptos.
How to trade using the crypto Melih strategy?
The custom-made indicator easily determines entry/exit points through its unique calculation. When all three indicators or calculations this method uses suggest price movement in any direction it declares on the chart; you need to open positions according to trade suggestions.
For example, the indicator shows a blue arrow below the price candle. It declares “buy” with a positive value indicating opening a buy position and vice versa when it creates a red arrow above price candles. You can use this concept independently to generate trade ideas or combine it with other technical tools/indicators to determine more efficient trading positions.
Short-term trading strategy
We use the parabolic SAR as a supportive indicator alongside the crypto Melih concept in this trading method. Parabolic SAR is a familiar technical indicator that creates dots on either side of the price movement to detect the current trend and switches above/below price candles when a new valid swing high/low occurs. This method suits many trading instruments; we prefer a 15-min or hourly chart to catch the best short-term trades.
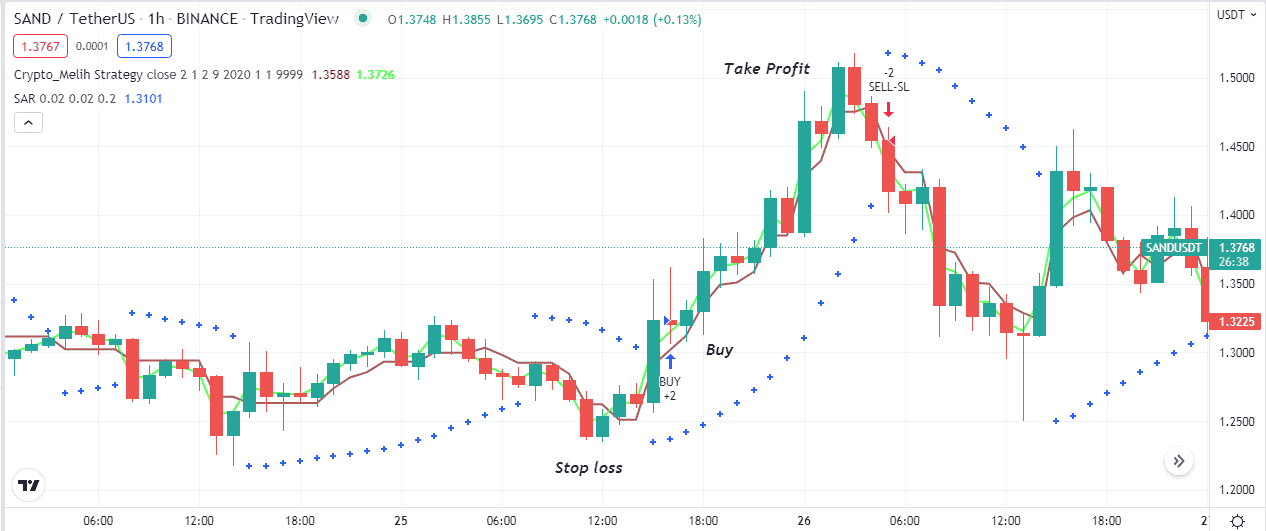
Bullish trade scenario
When seeking to open buy positions, apply both technical indicators to your target asset chart and match the conditions below:
- The Melih indicator creates a blue arrow below price candles.
- The ‘buy’ signal appears below price candles with a positive (+2) value.
- Parabolic SAR dots take place below price candles and start making a series.
Bullish setup
Entry
When these conditions above match your target asset chart, it declares sufficient bullish pressure on the asset price. Open a buy order.
Stop loss
The initial stop loss level will be below the current swing low with a 5-10 pips buffer.
Take profit
Close the buy order when the bullish momentum loses strength. Check the conditions below:
- The Melih indicator creates a red arrow above price candles with a negative (-2) value.
- Parabolic SAR dots switch on the upside of price candles.
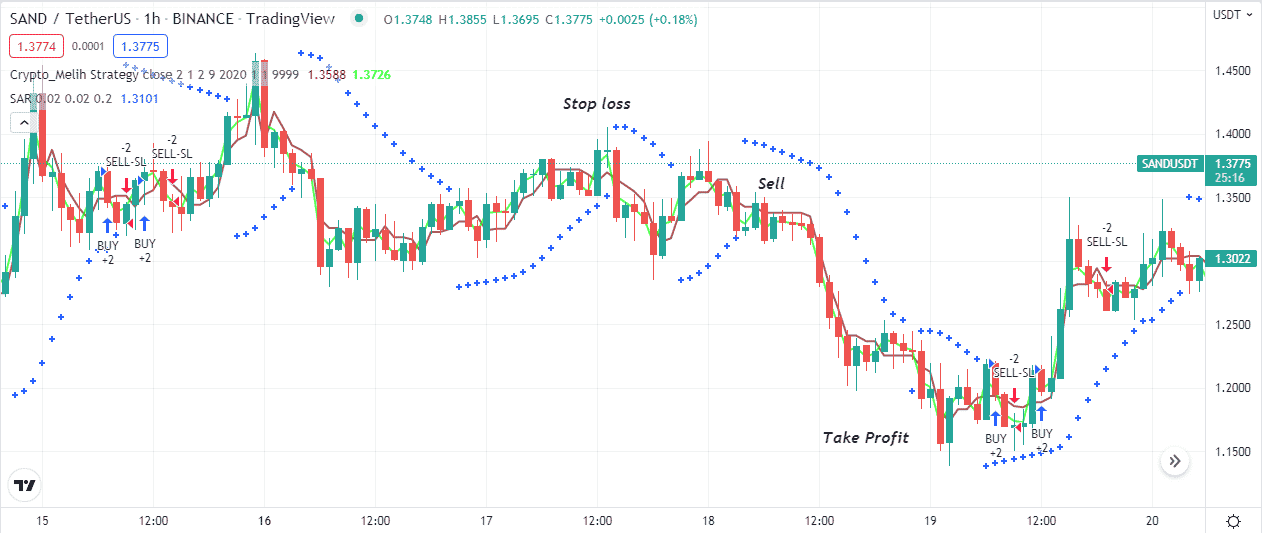
Bearish trade scenario
When seeking to open sell positions, apply both technical indicators to your target asset chart and match the conditions below:
- The Melih indicator creates a red arrow above price candles.
- The ‘sell’ signal appears above price candles with a negative (-2) value.
- Parabolic SAR dots take place above price candles and start making a series.
Bearish setup
Entry
When these conditions above match your target asset chart, you may open a sell order.
Stop loss
The initial stop loss level will be above the current swing high with a 5-10 pips buffer.
Take profit
Close the sell order when the bearish momentum loses strength. Check the conditions below:
- The Melih indicator creates a blue arrow below price candles.
- Parabolic SAR dots switch on the downside of price candles.
Long-term trading strategy
We use another familiar technical indicator in this trading method: the RSI is a supportive tool alongside the Melih concept. The indicator already detects entry/exit points depending on its unique calculation, and the RSI indicator confirms the price direction. So it becomes easier to determine efficient trading positions. This method suits many time frame charts; we recommend using a daily or H4 chart to identify the most potent long-term trading positions.
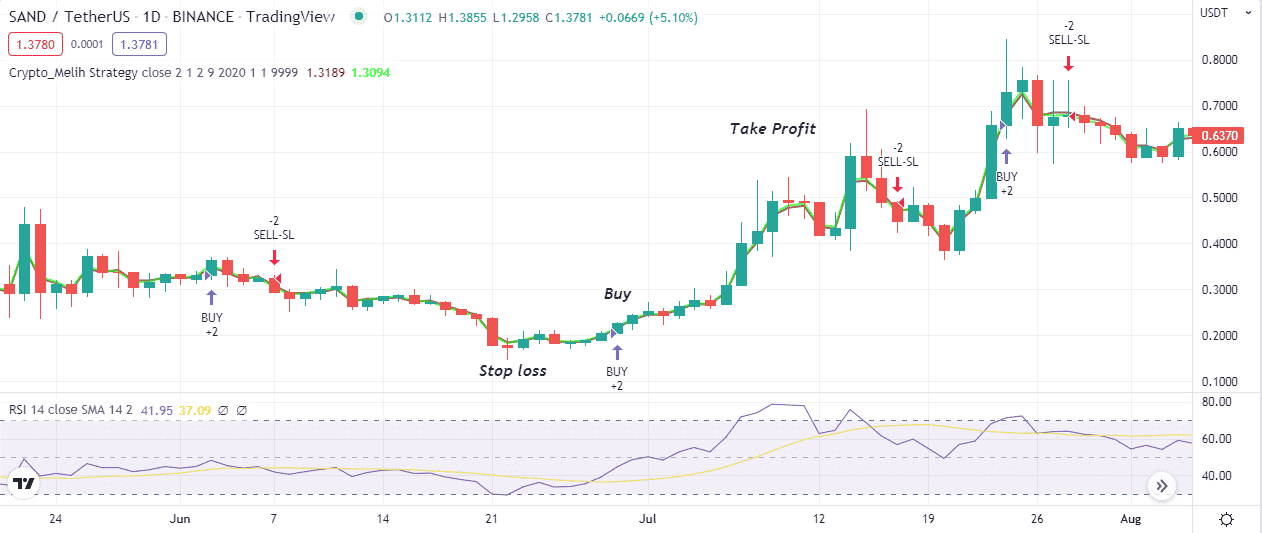
Bullish trade scenario
This method suggests opening buy positions when the conditions below appear:
- The Melih indicator creates a blue arrow below price candles.
- The RSI dynamic line remains near the mid (50) level and heads on the upside.
Bullish setup
Entry
These scenarios above declare bullish momentum on the asset price. Open a buy order.
Stop loss
Set an initial stop loss below the current bullish momentum.
Take profit
Your buy order is safe till the bullish momentum remains intact. Close the position by checking the conditions below:
- The Melih indicator creates a red arrow above price candles.
- The RSI dynamic line reaches above or near the top (70) level and starts dropping toward the central (50) level.
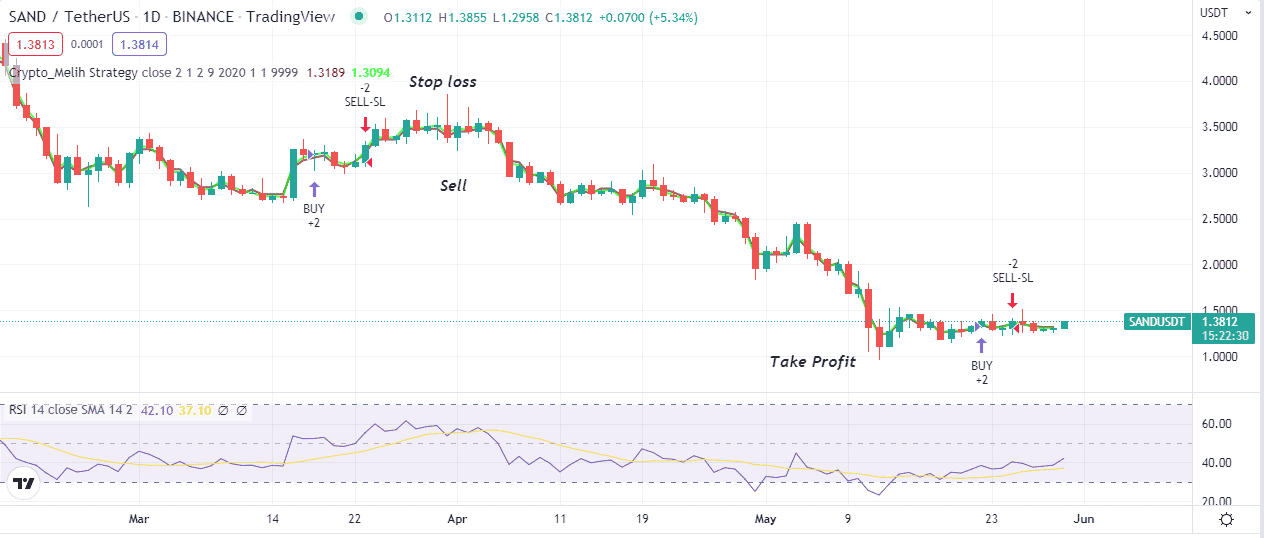
Bearish trade scenario
This method suggests opening sell positions when the conditions below appear:
- The Melih indicator creates a red arrow above price candles.
- The RSI dynamic line remains near the mid (50) level and heads on the downside.
Bearish setup
Entry
These scenarios above declare bearish momentum on the asset price. Open a sell order.
Stop loss
Set an initial stop loss above the current bearish momentum.
Take profit
Close the position by checking the conditions below:
- The Melih indicator creates a blue arrow above price candles.
- The RSI dynamic line reaches below or near the bottom (30) level and starts rising toward the central (50) level.
Pros and cons
| 👍 Pros | 👎 Cons |
|
|
|
|
|
|
Final thought
Finally, this article introduces an excellent technical concept to approach the crypto marketplace. We suggest checking upper timeframe charts or conducting a multi-time frame analysis when using this concept for short-term trading to identify the most efficient trading positions.


Comments