Gann trading theory is nothing unfamiliar to the people who are actively engaged in the investment world and have expertise in technical indicators. Gann is a famous trading theory that William Delbert Gann developed. In 1902, William Delbert Gann or W.D. Gann started his trading career as a financial trader. Moreover, he designed various technical analysis tools such as Square of 9, Hexagon, and WD Gann Angles. These technical analysis tools made William Delbert Gann popular. It’s been almost a hundred years since these rules were developed, yet traders are conventionally utilizing them till now.
Gann’s theory is getting exploited and covering all types of investment instruments, cryptos, and the stock market, which has been possible as all the rules cover basic money management principles to advanced trading methods.
What is Gann’s theory?
The inventor of the Gann theory, William D. Gann, claimed that angles were responsible for the change in the asset prices since an asset may have moved from various angles. In theory, the founder tried to portray the correlation between the price changes, natural geometric shapes, and timing as these facilitate the anticipation of future price movements. Hence, the theory is also referred to as the Gann Angle theory.
Although the Gann trading strategy appeared almost a century ago, it is possible to utilize it in modern-day trading strategies. Also, the theory can anticipate the asset’s movement with up to 90% precision with proper execution. As per Gann’s belief, the market follows the natural time cycle. Therefore, the theory he developed is based on natural geometric shapes combined with primitive mathematics. In terms of predicting future movements of the prices, the asset’s angles and patterns on the market can be exploited, stating in Gann’s theory.
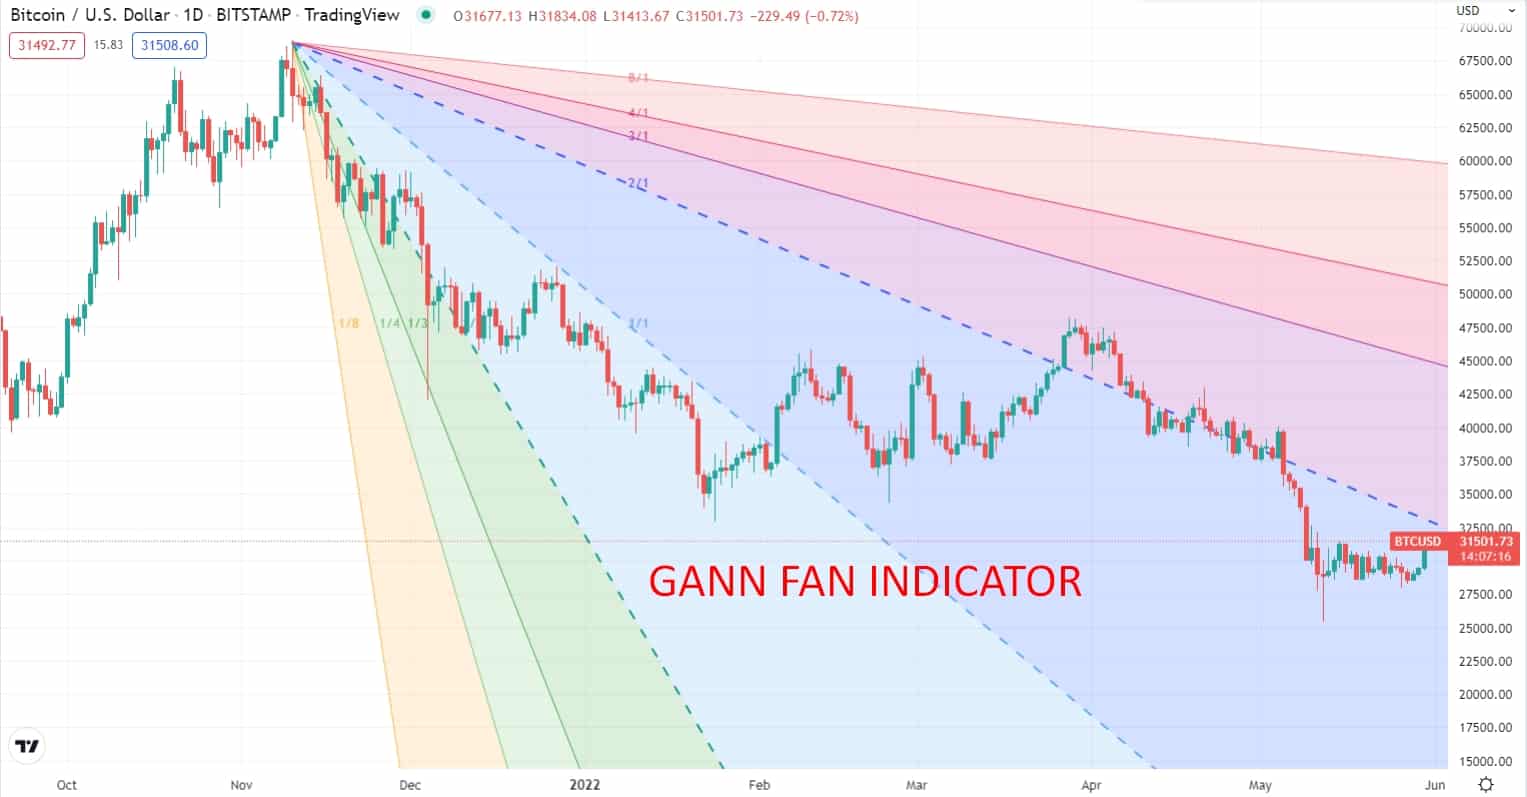
Gann fan indicator on the chart
How to trade using Gann fan indicator in trading strategy?
It is significant for the traders to keep in mind that the market moves from various angles, staying the same but rotating. As per the ‘Rule of All Angles, ’ any asset may switch from one angle to another. ‘Rule of All Angles’ mentioned that once it has obtained an angle, an asset moves from one angle to another. Typically, Gann angles help to detect the support and resistance lines. It anticipates the future price may fall when the support is broken. It is named a breakout. If it breaks contrary, the price may go upward the resistance breaks.
However, after setting up his time frame, the trader may line up the Gann angles on the price chart. These angles may be 1×1, 2×1, 3×1, 3×1, 1×2, 1×3, etc. Also, traders may exploit these lines as per their requirements to determine the price movement.
Furthermore, occasionally, horizontals and angles are collectively utilized to detect the support or resistance. When an asset is bullish, it potentially encounters retracement to 50%, and the level plays the role of the market support. Conversely, 50% of retraces are the significant resistance level in the bearish market. Also, these angles are crucial support and resistance levels for the assets trading at a variant angle, and the areas are named ‘price clusters.’
A short-term trading strategy
This strategy is straightforward to understand. It has developed based on the Gann fan lines and the price action context. This trading method will look for the price to break above or below the ½ Gann fan line to take a buy and sell trade. Moreover, we will apply this trading method to the M5 and M15 time frames.
Bullish trade scenario
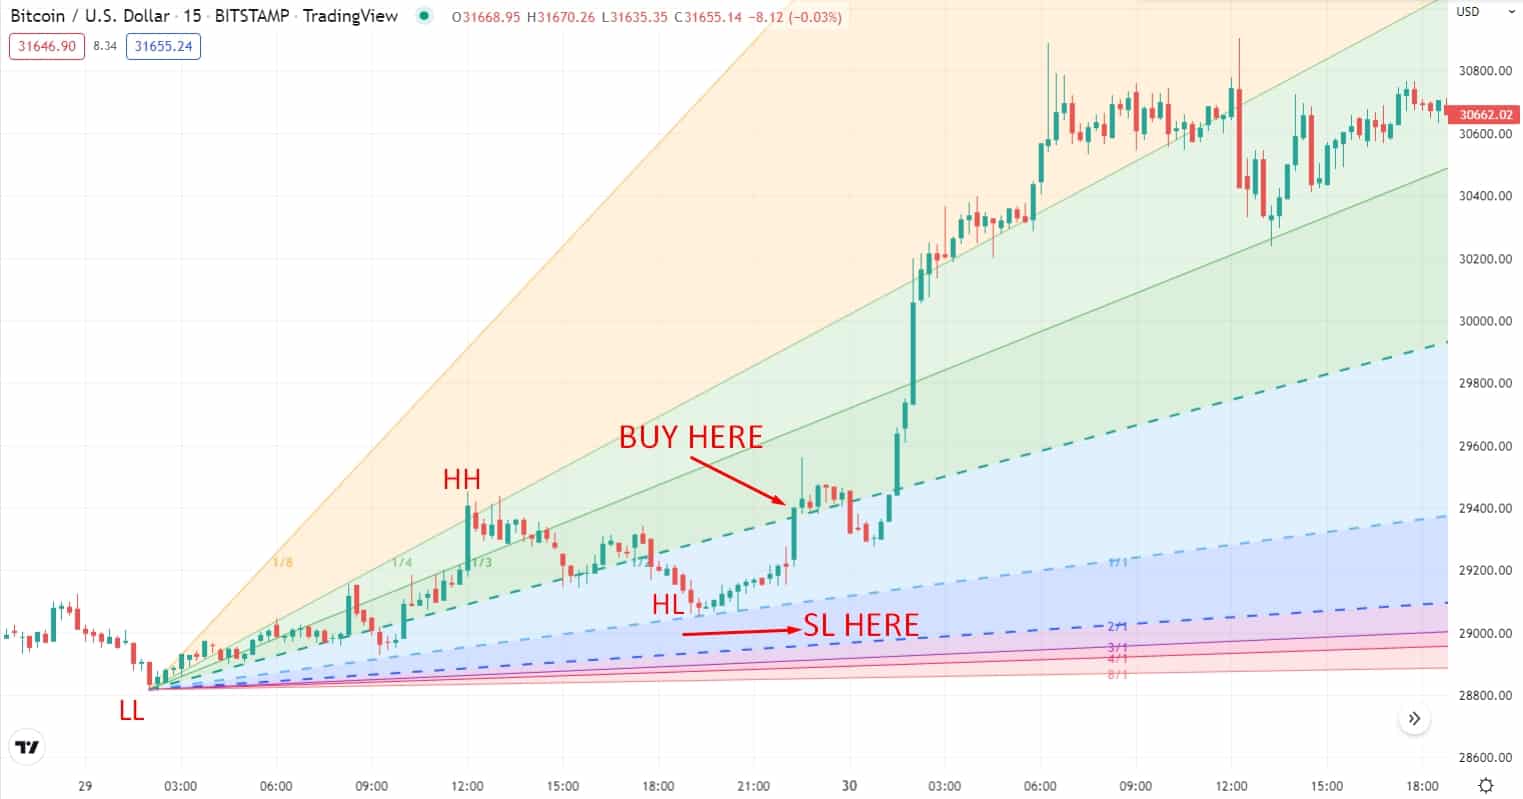
Short-term bullish trade scenario
Entry
First, draw a bullish trend line using the Gann fan indicator. Then look for a buy entry when the price breaks above the ½ line with an impulsive bullish candle.
Stop-loss
Place the stop loss order below the 1/1 line with at least a 5-10 pips buffer.
Take profit
Take the profit by calculating at least a 1:3 risk/reward ratio. Otherwise, you can take the profit by targeting the 1/3 or 1/4 lines based on the price action of the market.
Bearish trade scenario
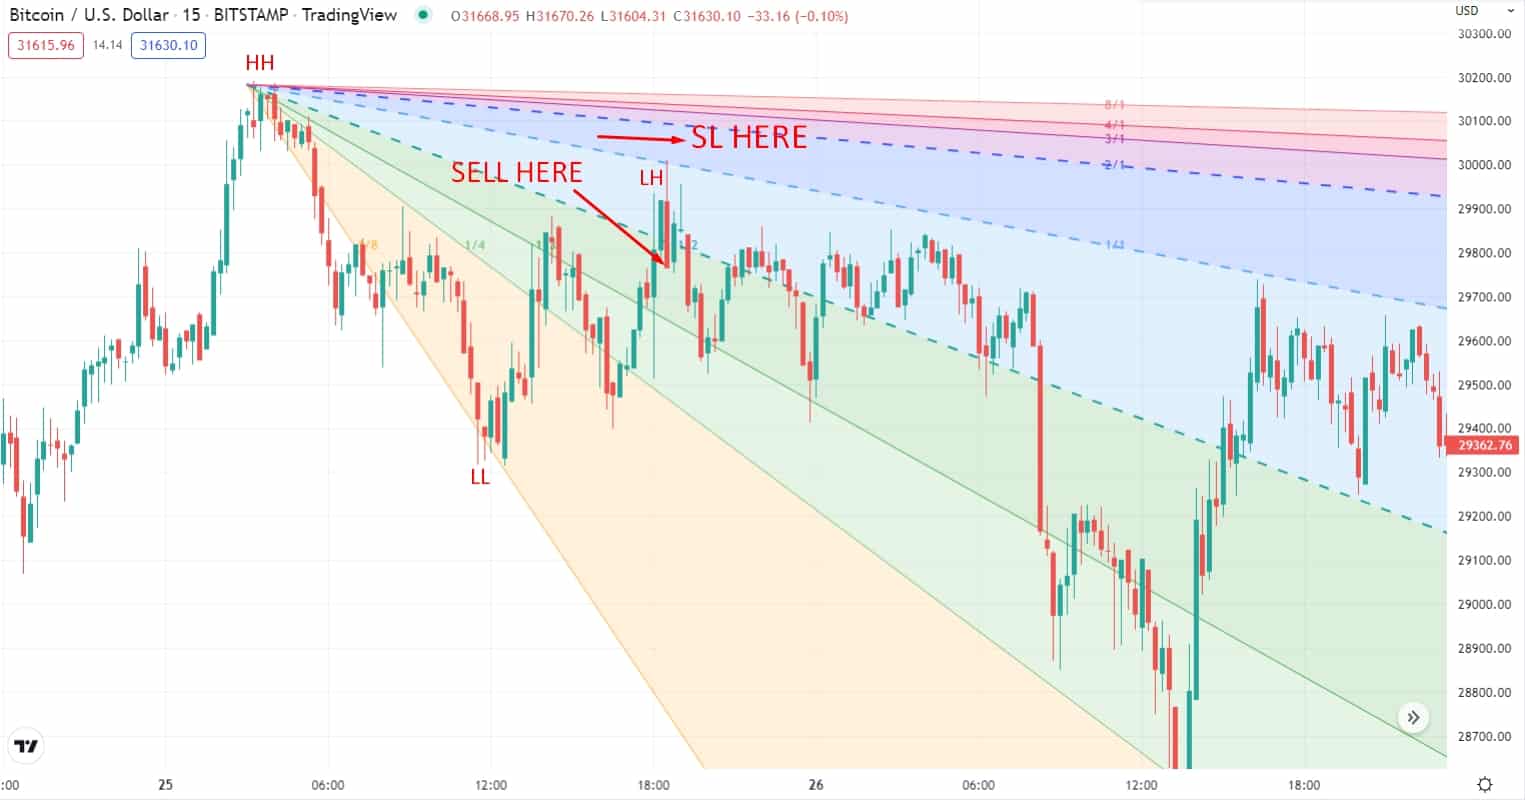
Short-term bearish trade scenario
Entry
First, draw a bearish trend line using the Gann fan indicator. Then look for a sell entry when the price breaks below the ½ line with an impulsive bearish candle.
Stop-loss
Place the stop loss order above the 1/1 line with at least a 5-10 pips buffer.
Take profit
Take the profit by calculating at least a 1:3 risk/reward ratio. Otherwise, you can take the profit by targeting the 1/3 or 1/4 lines based on the price action of the market.
A long-term trading strategy
A long-term Gann trading strategy has been built based on the Gann fan indicator. In this trading method, we will add one more indicator, which is called 20 EMA. The 20 EMA will help us to identify the entry and exit points. Moreover, we will apply this trading method to the H4 and D1 time frames.
Bullish trade scenario
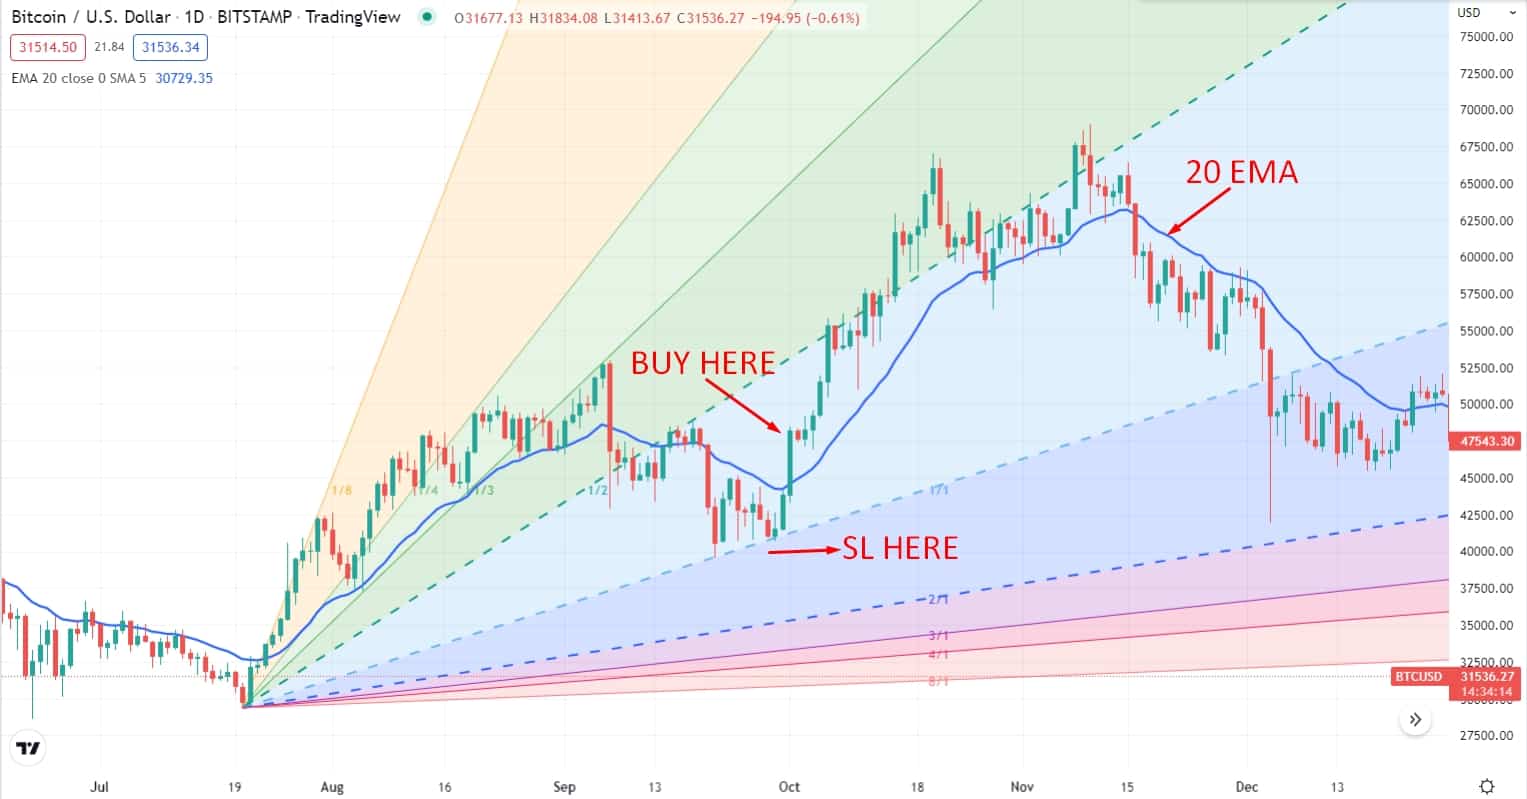
Long-term bullish trade scenario
Entry
First, draw a bullish trend line using the Gann fan indicator on the chart. Then look for a buy entry when the price closes above the dynamic level of 20 EMA after bouncing from the 1/1 line.
Stop-loss
Put the stop loss order below the 1/1 level with at least a 10-15 pips buffer.
Take profit
Take the profit by calculating at least a 1:3 risk/reward ratio. Or else, you can take the profit when the price breaks below the 20 EMA.
Bearish trade scenario
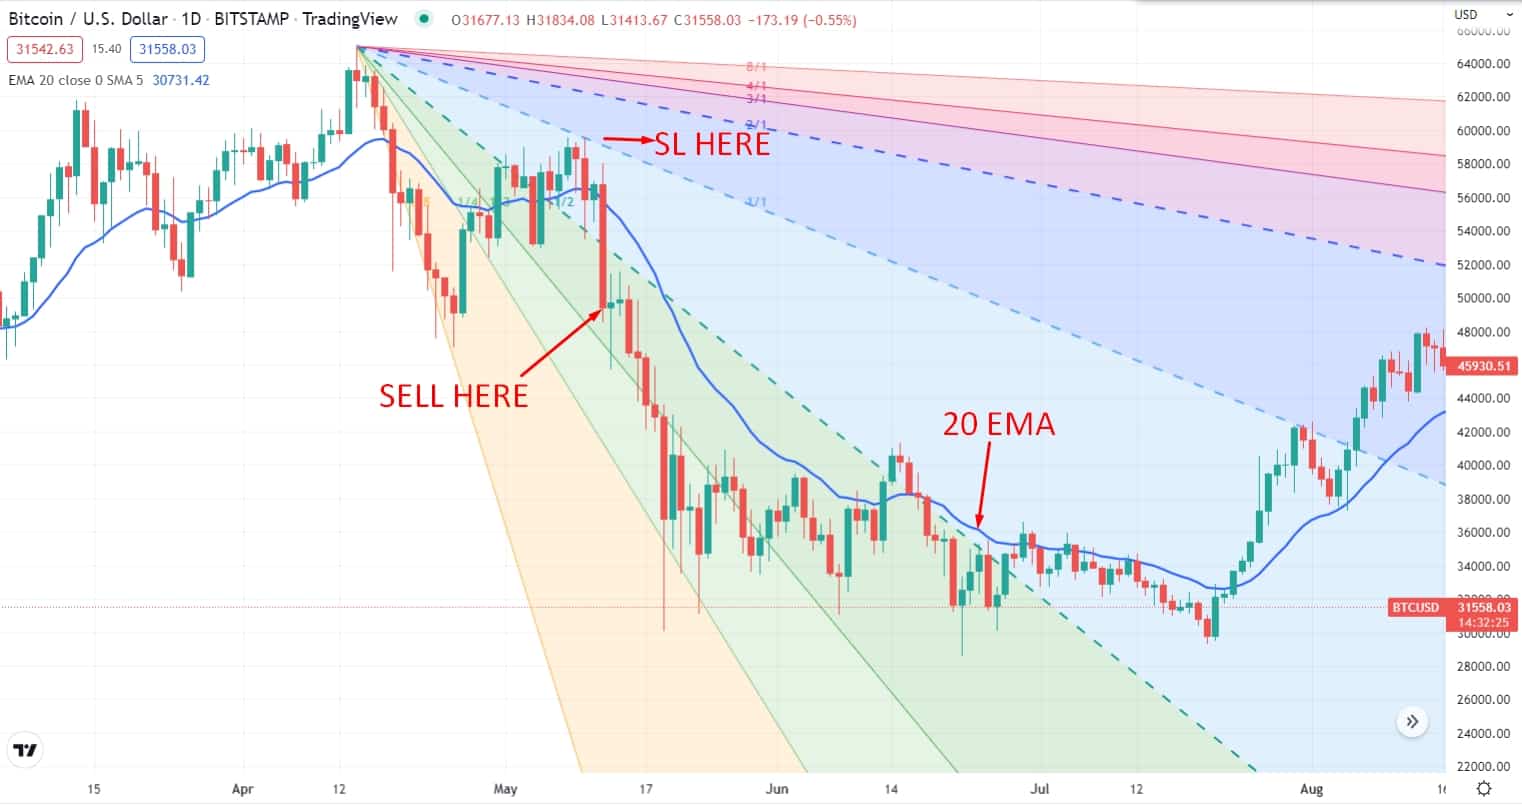
Long-term bearish trade scenario
Entry
First, draw a bearish trend line using the Gann fan indicator on the chart. Then look for a sell entry when the price closes below the dynamic level of 20 EMA after rejecting from the 1/1 line.
Stop-loss
Put the stop loss order above the 1/1 level with at least a 10-15 pips buffer.
Take profit
Take the profit by calculating at least a 1:3 risk/reward ratio. Or else, you can take the profit when the price breaks above the 20 EMA.
Pros & cons
| 👍 Pros | 👎 Cons |
|
|
|
|
|
|
Final thoughts
Gann was established nearly a decade ago based on its price movement anticipations of price, time, and range. Gann’s theories are still in use due to their uncomplicating nature. Also, they have very potential to obtain returns successfully. However, Gann has concisely prescribed all the trading principles and rules. Therefore, the average investor should use the theories by combining them with different technical charts and indicators to calibrate the theories.


Comments