A forex indicator is a trading tool that shows the possible price direction based on a specified calculation. Therefore, using multiple indicators together often provides the best result in trading.
Many traders find it challenging to utilize the perfect combination of indicators. Some people think using a moving average with oscillators is the best, while others consider it ineffective. Therefore, finding the best combination of indicators is the primary requirement for starting a trade.
Let’s check which indicator provides the best result in trading and how to combine them to get the maximum benefit.
What are the best indicators in trading?
There are thousands of free and paid custom indicators on the MQL4 and MQL5 websites. But the efficiency of a trading indicator depends on how it is helping your trading strategy. An exponential moving average (MA) or other built-in indicators would be profitable to match them with the market context and trend.
However, based on traders’ acceptance and effectiveness, we can consider moving average as the most used trading indicator in the world. It is straightforward and shows a real story about bulls and bears.
Therefore, if you are a price action trader, any indicator like moving average would work at a dynamic level. On the other hand, having an indicator from the oscillator class will filter the confirmation in trading.
Why are indicators worth using?
Indicators use a complex calculation to represent the market that helps traders to make better trading decisions. Without indicators, traders may need additional time to brainstorm the previous move. It would cost additional time, but the major problem is the drawback of human brains.
Computer programs like indicators can process thousands of calculators in a second, requiring more time for the human brain. Therefore, using a trading indicator means you save hours and have more time on trade management and execution.
On the other hand, many people can argue that naked chart trading is the best way to trade in the FX market, and indicators are just a waste of time. However, having indicators is an additional tool that is worthy.
On the other hand, if you use indicators as a primary weapon in your trading, you are on the wrong track. You should have a clear knowledge about price action and ways to combine indicators with market behavior.
What is the best strategy with the forex indicator combination?
We will talk about a trading strategy with pure price action and indicators to define the price direction. This strategy will use candlesticks, trends, price context, VWAP indicator, volume, and MACD. Moreover, using the supply-demand would increase the trading probability and help to set the price direction.
First, we need to identify the market trend and focus on taking trades towards the trend only. After that, we will focus on VWAP as a dynamic level, and once the VWAP level is breached with a strong candle, we will open trade. Meanwhile, the MACD would show the same direction by showing the histogram in a positive or negative zone.

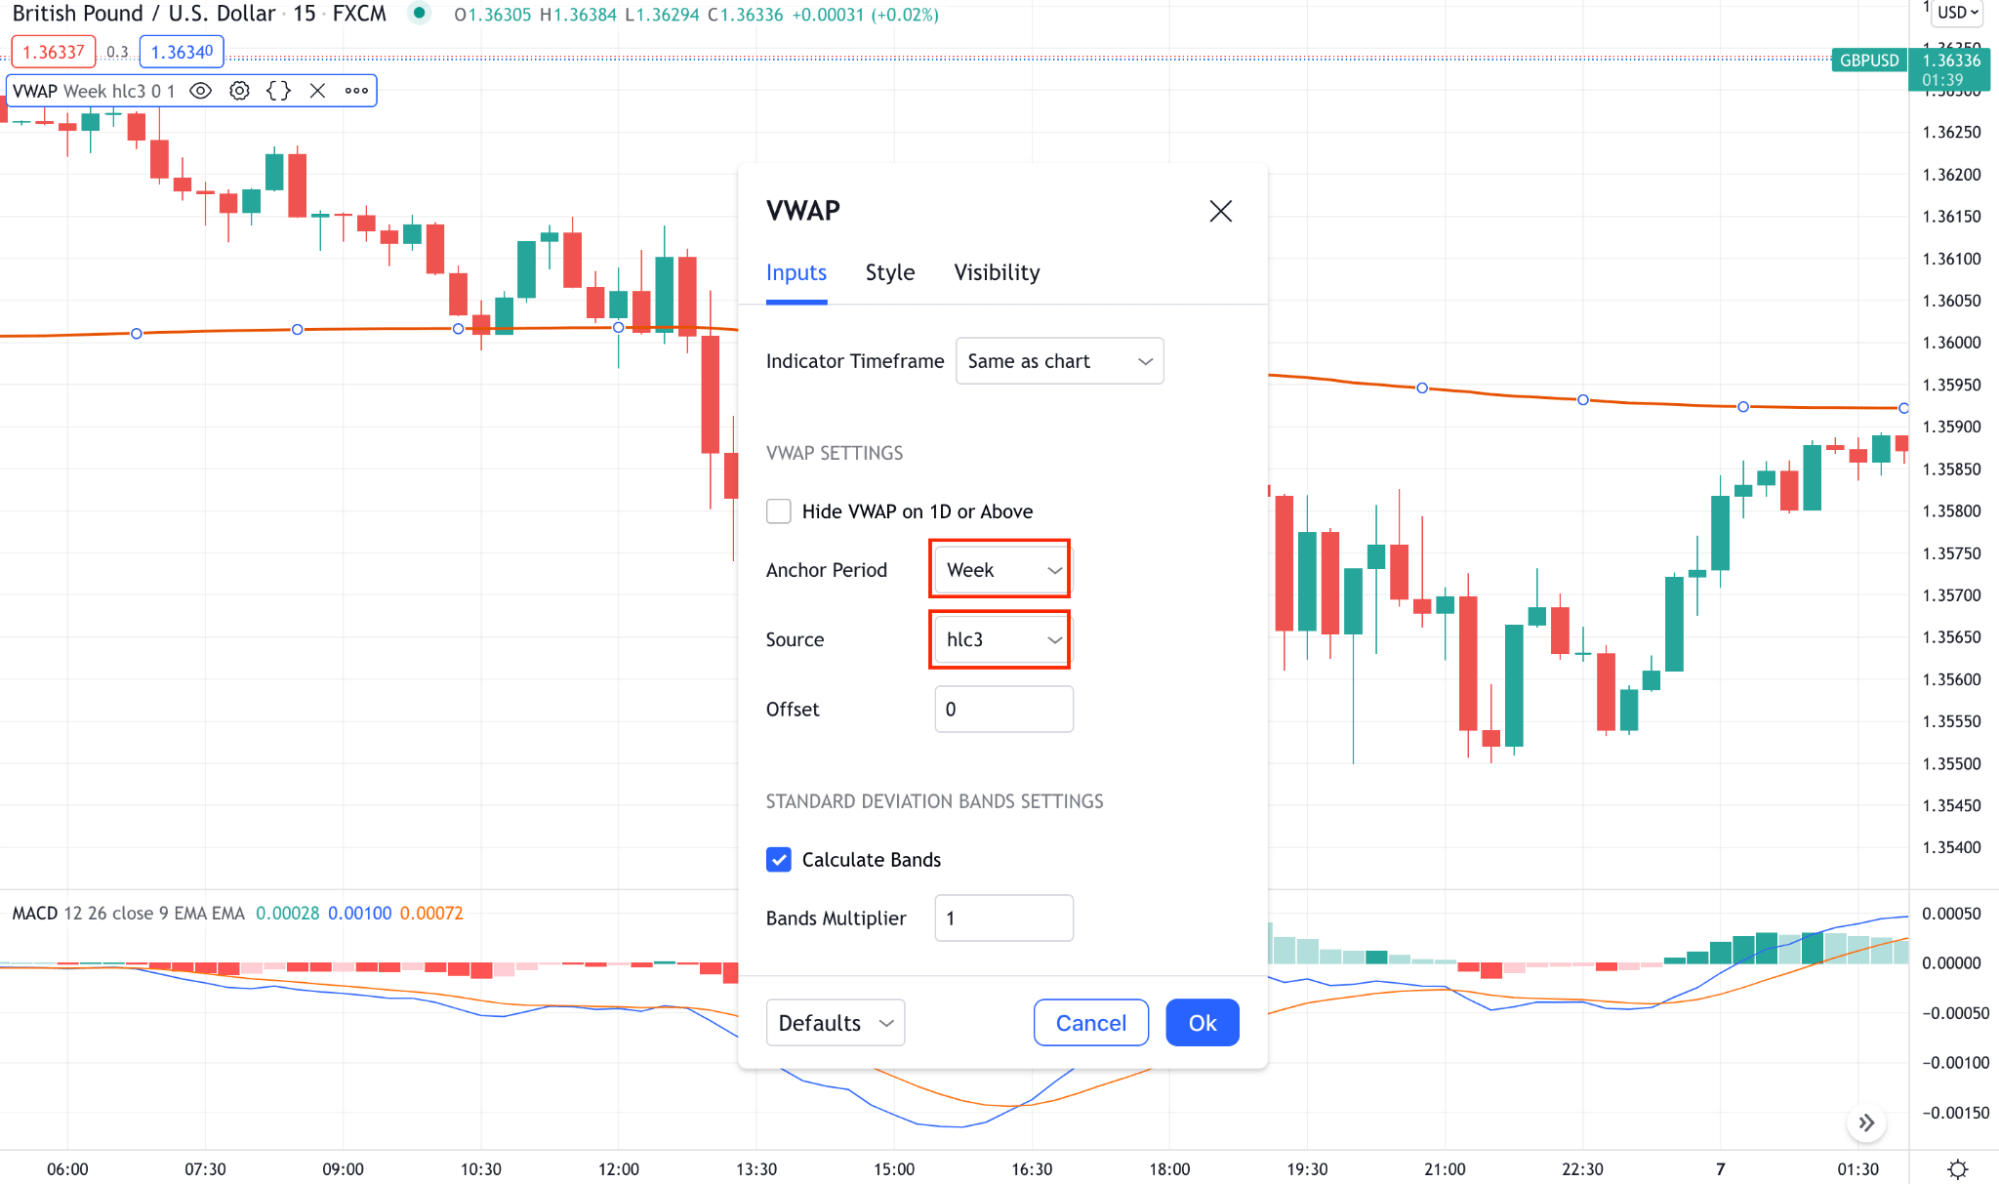
VWAP setting
The core part of this method is to combine indicators to the supply-demand. We all know that the supply level is a price zone where institutional traders open their sell trades.
On the other hand, the demand zone is a prize zone from where they open buy positions. Therefore, when you take a buy, it should support from the demand zone, and for a sell trade, it should be below the major supply zone.
A short-term strategy
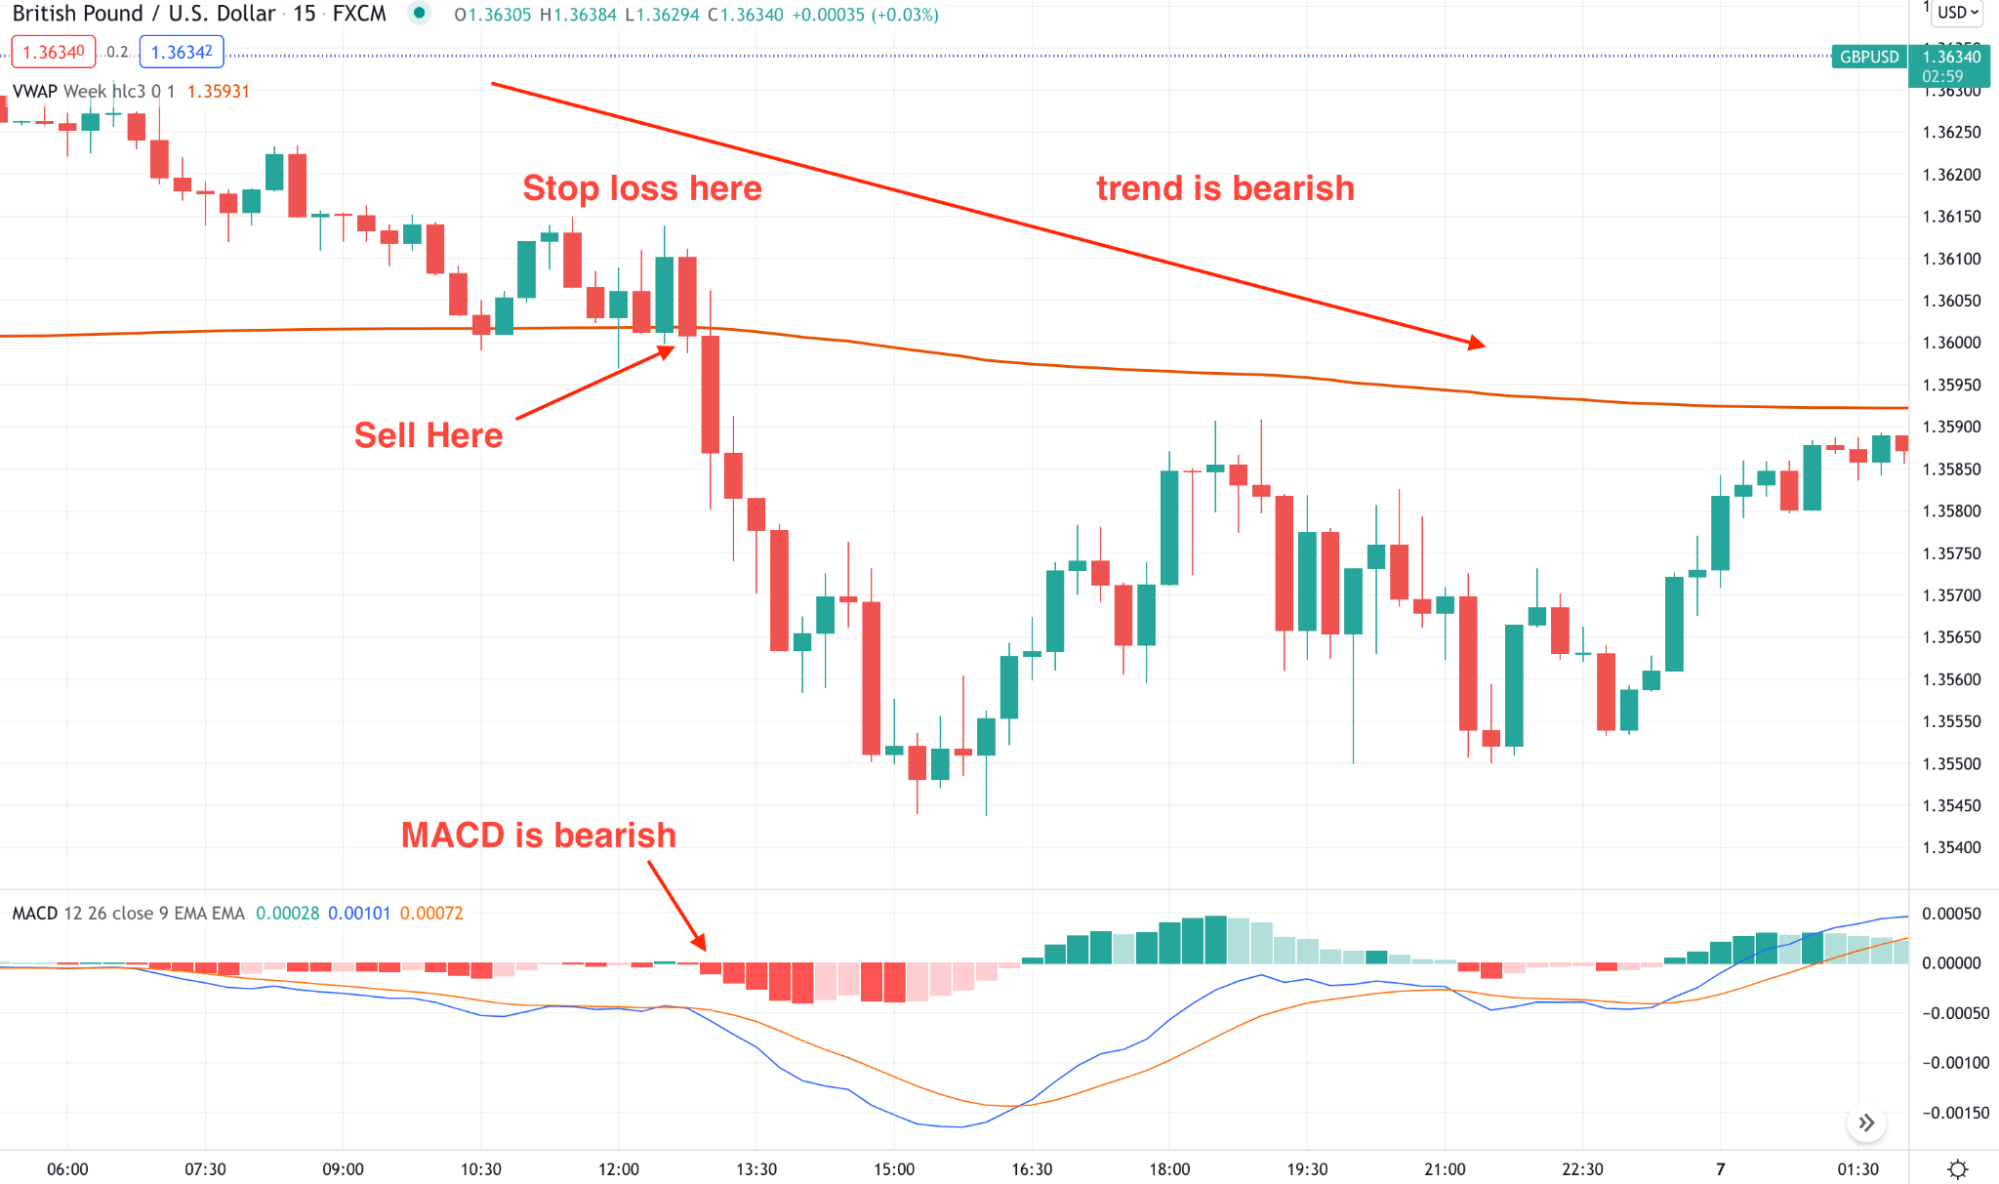
In the short-term method, we will use VWAP and MACD histogram as indicators in the 15M time frame and open trades on where the H1 trend is heading.
Best time frames to use
This trading strategy is suitable for the 15M time frame.
Entry
For a buy trade:
- Find the market direction as bullish
- Price is above any important support level
- There is no near-term resistance level within the 50 pips range
- During the London and New York session, a bullish 15M candle appears above the VWAP, where traders open the position
For a sell trade:
- Find the market direction as bearish
- Price is below any important resistance level
- There is no near-term support level within the 50 pips range
- During the London and New York session, a bullish 15M candle appears below the VWAP, where traders should open the position
Stop loss
The ideal stop loss is based on the most recent swing level with some buffer.
Take profit
The primary “take profit” of this method would be at least 1:2 of the risk and reward, but you should consider near-term levels while closing the position.

Short-term trading
A long-term strategy
We suggest sticking to the intraday chart as the weekly VWAP does not work well in higher time frames, even if it is the long-term method.
Best time frames to use
This strategy applies to the H1 time frame.
Entry
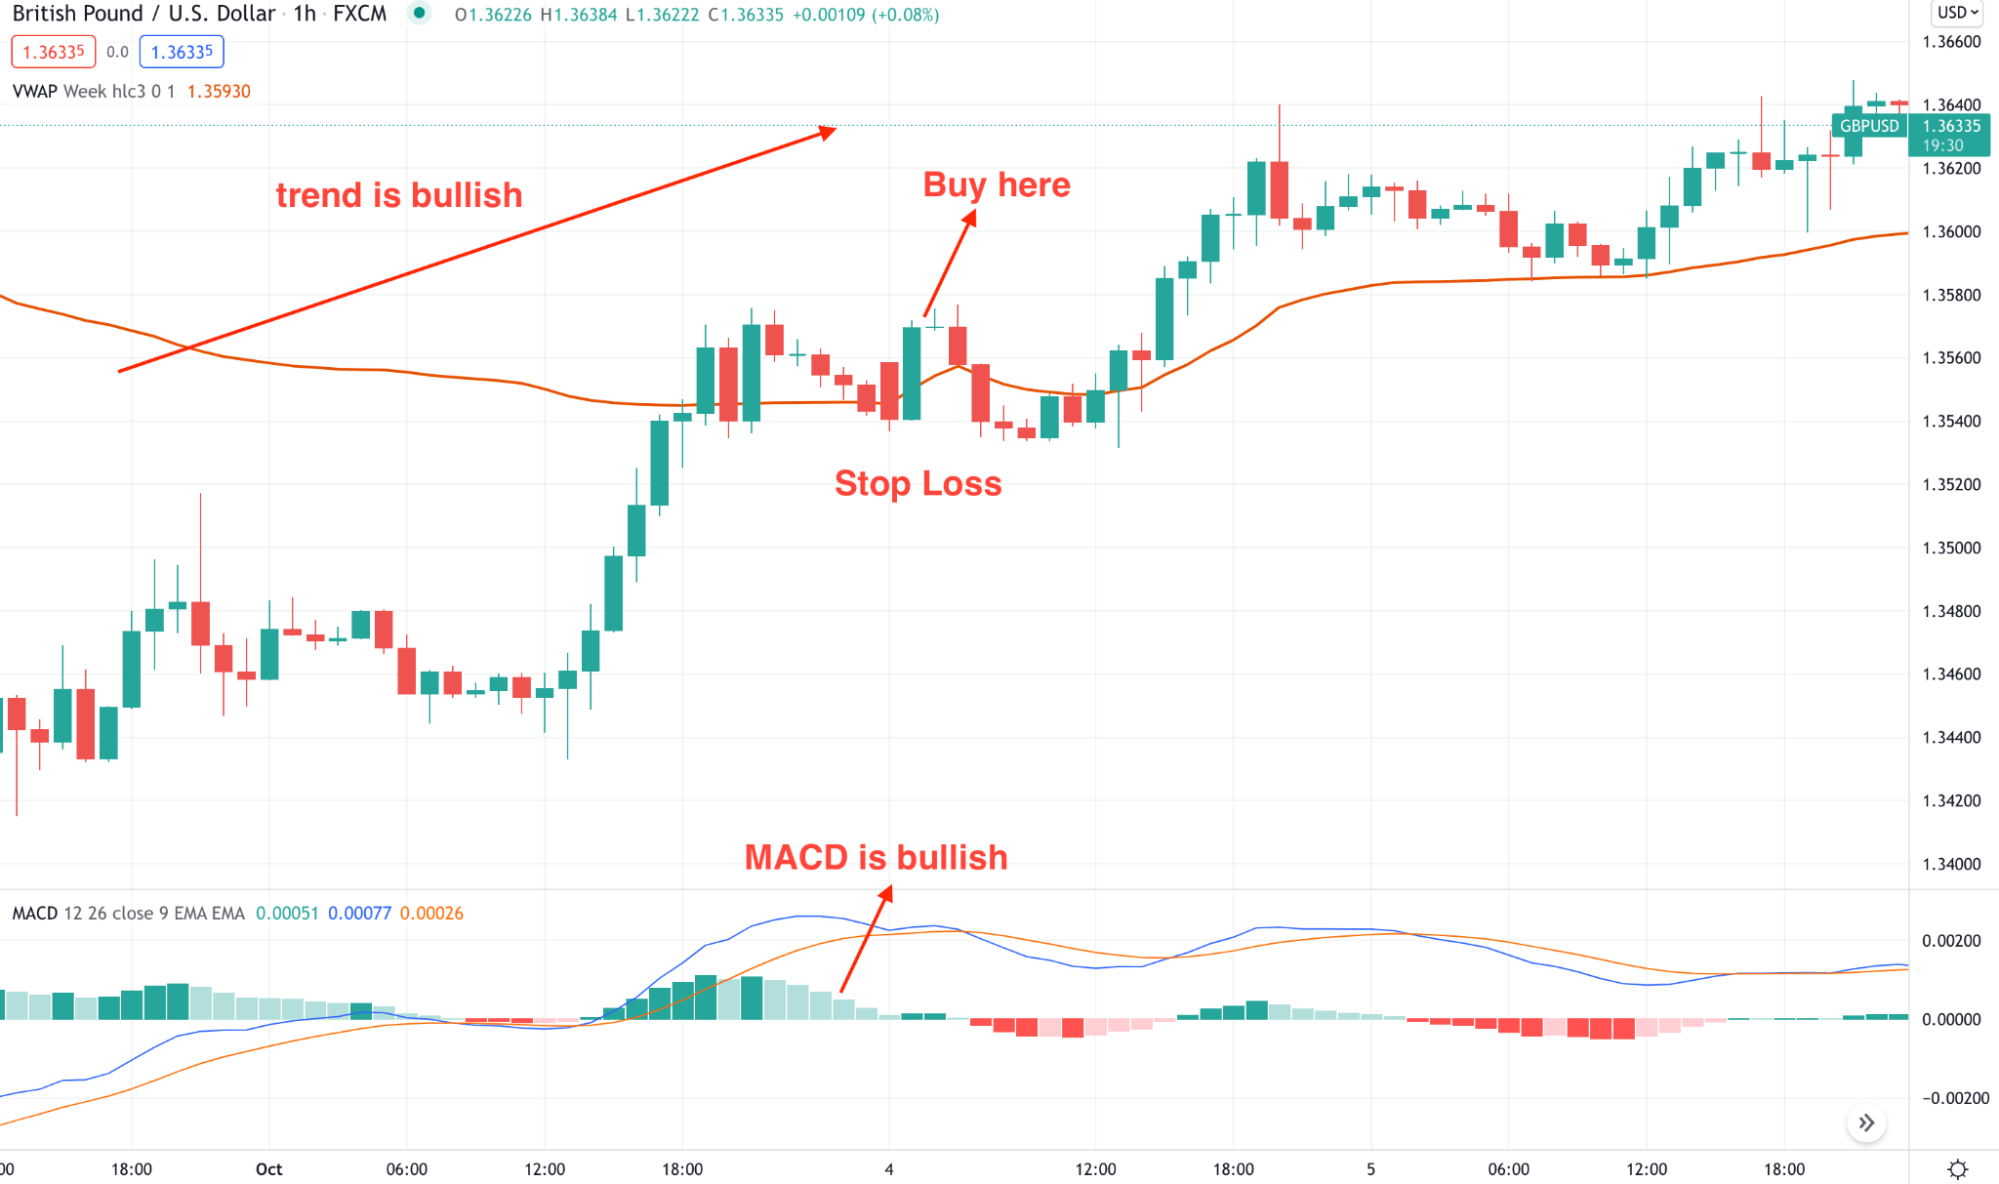
When the overall market sentiment is bullish, open trade as soon as a bullish candle appears above the weekly VWAP. On the other hand, open a sell trade if an H1 candle comes below the weekly VWAP. In both cases, make sure to match the direction with the higher time frame.
Stop loss
The ideal stop loss is based on the most recent swing level with some buffer.
Take profit
The primary “take profit” of this method would be at least 1:2 of the risk and reward, but you should consider near-term levels while closing the position.

Long-term trading
Pros and cons of the strategy with indicator combination
Let’s see the pros and cons of this method to decide when to utilize the strategy and when to sit back.
Pros |
Cons |
|
|
|
|
|
|
Final thoughts
The best forex indicator combination is a simple but effective method for earning money online. If you can match the price action with these tools, you will get high probable trades and make a long-term gain from the market. However, some risks are uncontrollable. So following a method of managing risks is needed.


Comments