
Day trading requires additional attention to the market trend that a trader can easily pick by combining dynamic and static levels. Once both tools provide the same signals, you might experience a higher return in your trading.
There are no rules regarding which indicator you should use as a dynamic level. Some people use moving averages, while other traders use Parabolic SAR or Bollinger Bands.
You can easily create a profitable day trading method using the EMA and other tools and make money from an active trading session. However, exponential MA might add an edge to your trading as it focuses on the most recent price action. Let’s see the core component of moving averages before focusing on a trading method.
What are moving averages: main types
Once we draw a dynamic line with the MA point of each stage of the candlestick, we will find a line called a moving average. As the name says, moving average or MA represents the average condition of bulls and bears. Simply 20 moving average means the average price of the last 20 candles. It changes its value with time- after closing new candles.
The core concept of using MAs is to follow what ordinary people are doing. If buyers’ strength is more robust than bears’, the price will be above the moving average, focusing on buy trades. However, if it makes an excessive move from a moving average, it is more likely to come back as a mean reversion.
Moving average in a live chart
How to read the exponential moving average?
When we talk about EMAs, we are focusing more on the most recent price action. It uses both average and recent momentum so that investors can see a quicker way to benefit from intraday liquidity.
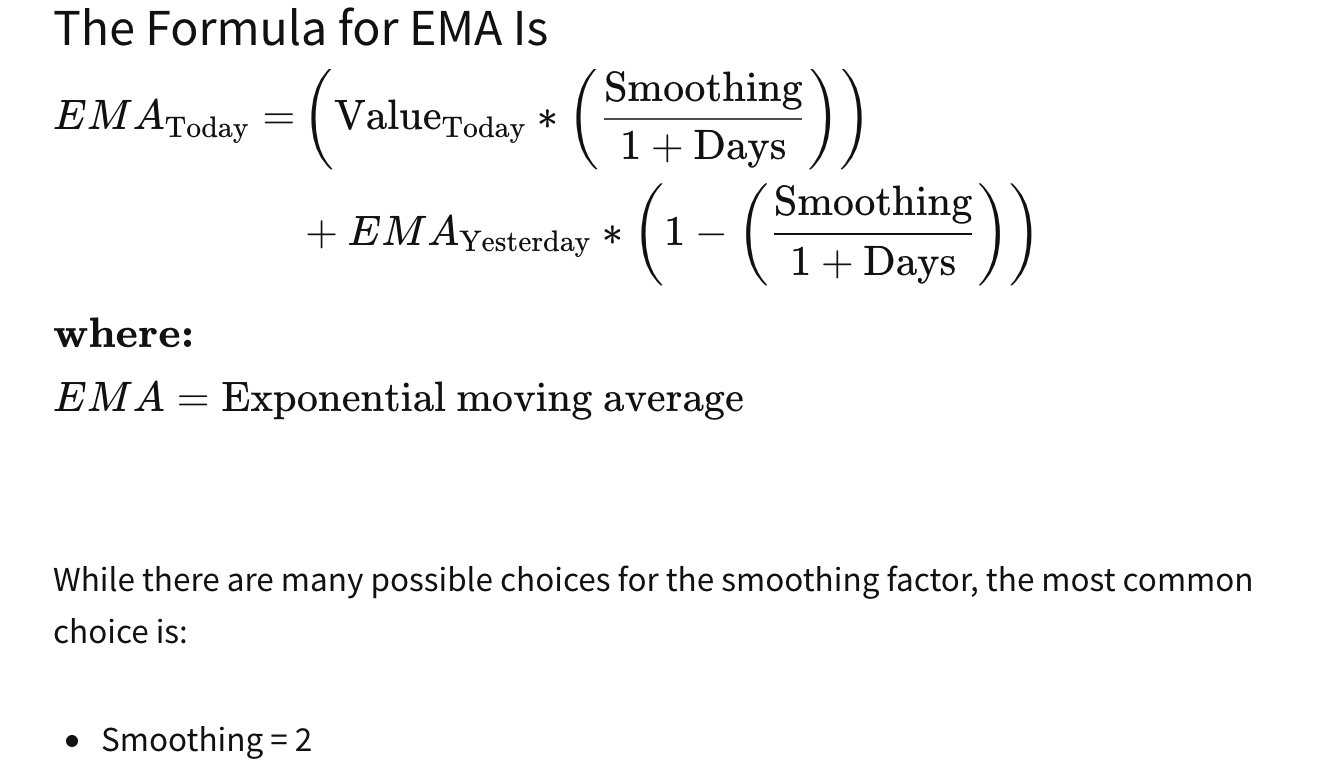
EMA formula
Among EMA values, the 12 and 26 are important for daily chart trading. These values are used in several indicators like MACD and PPO.
On the other hand, 50 and 200 EMA shows the long-term perspective of the market. The core idea of using this indicator is to consider it as a support and resistance. If the price breaks above the EMA, it may correct lower, and rejection from EMA may push the price up. Let’s see an example.
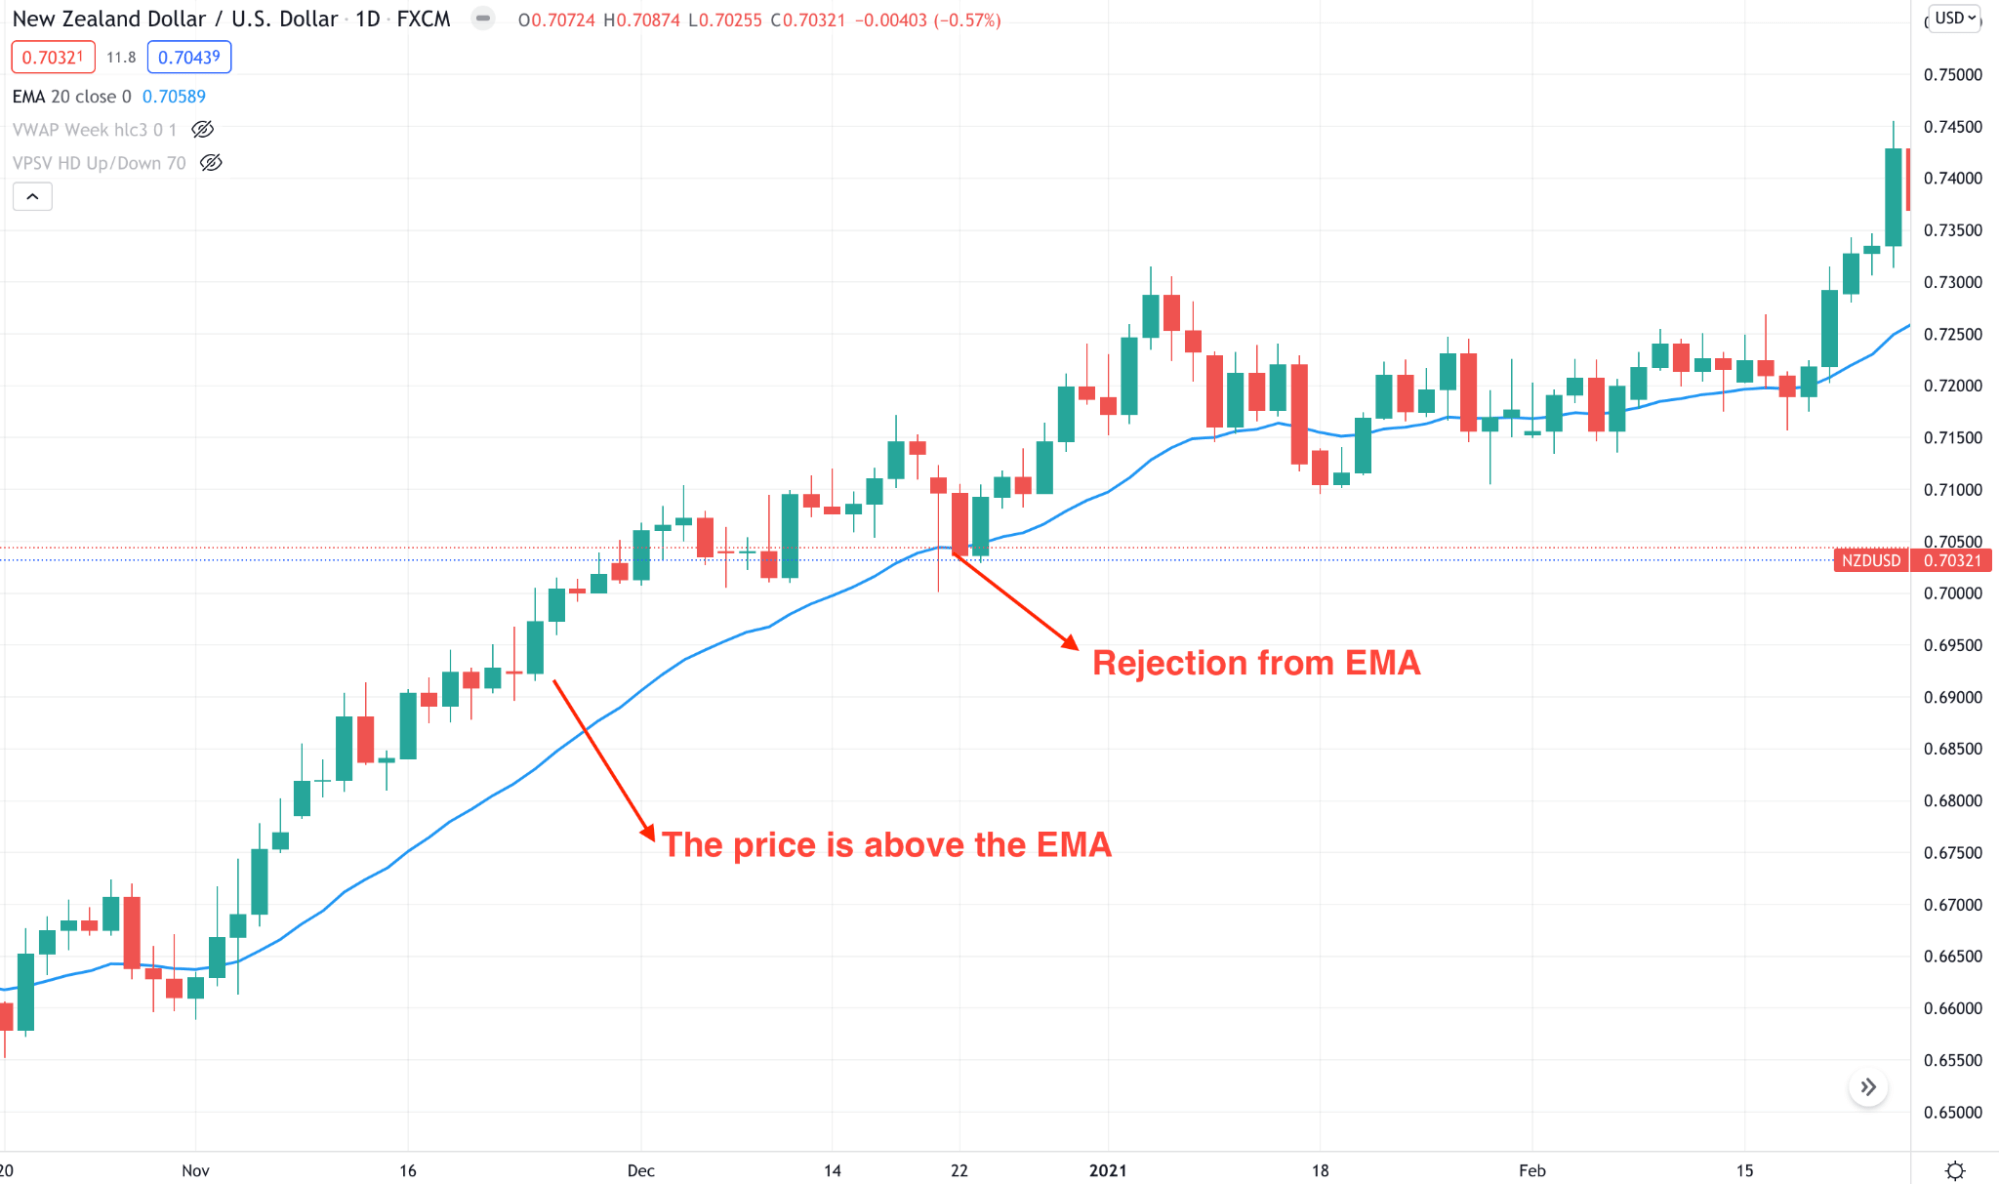
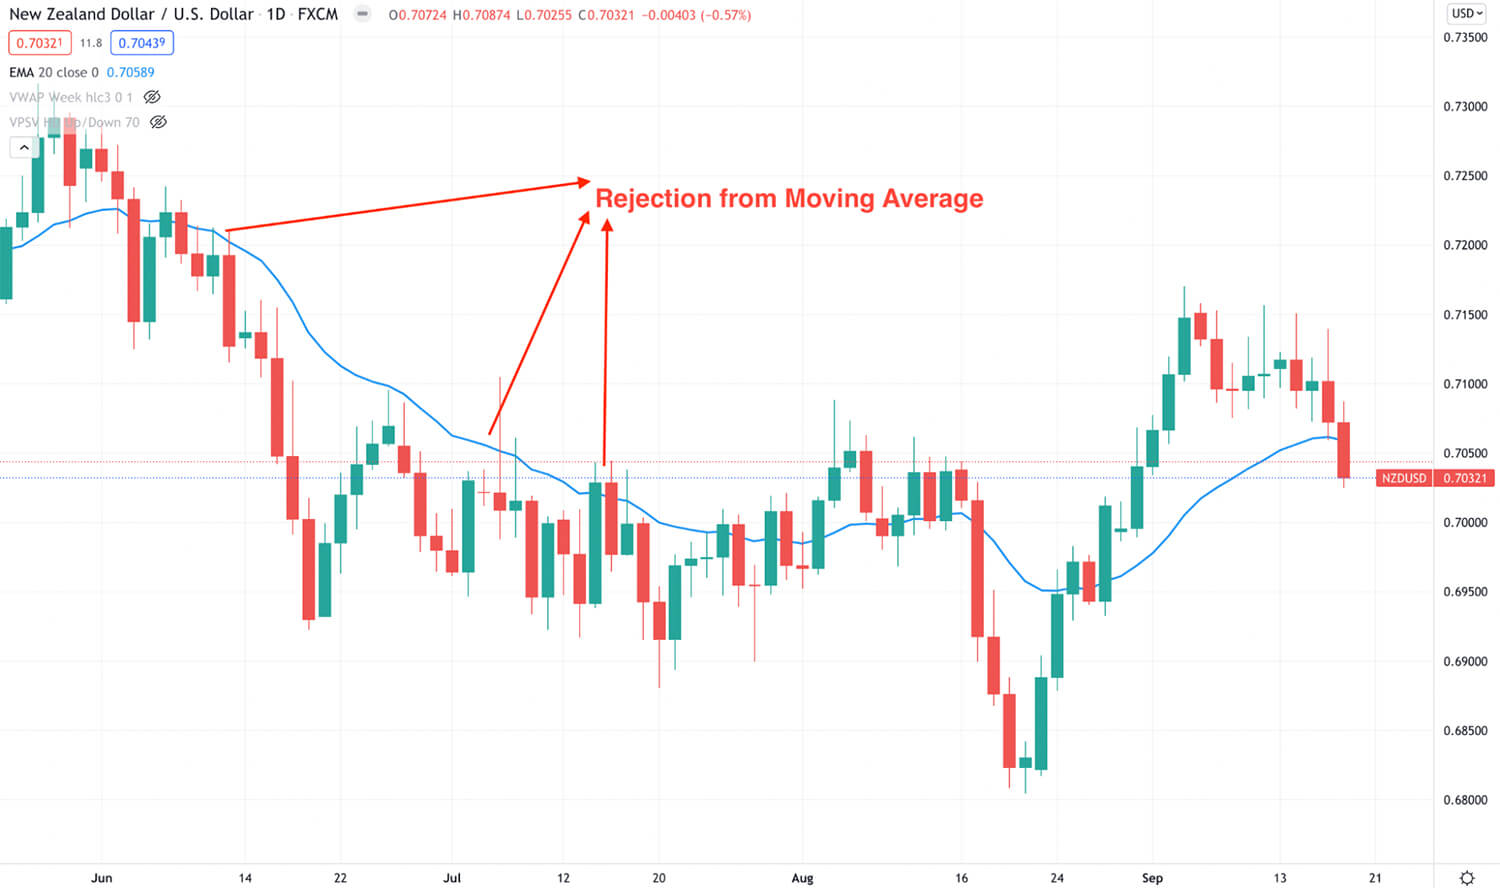
EMA in the NZDUSD chart
This image shows that the price moved above the EMA, which is a sign of a bullish trend. However, the price returned to the dynamic level and closed with a wicked bearish candle later on. As a result, the price moved up with impulsive pressure.
Anyways, trading in the current chart is not easy with EMA as it is a lagging indicator. So there is a possibility of facing false or wrong signals, and the best approach is to use other indicators.
Best EMA for a 15-minute chart
What is the best value for EMA in 15-minute trading? There are no rules for indicator settings, and you change the value at any time according to your choice. Best of our findings, we can say 20 EMA is more profitable in 15-minute trading as it focuses on the most recent prices and works as a dynamic S/R area. Besides, traders should use other indicators to increase the trade’s probability. Relying only on a single indicator is not a good way to trade.
Exponential moving averages strategy: how to master it?
In a trading strategy, market participants usually focus on multiple confirmations to increase the trades probability. In the EMA trading, we will do the same.
First, we will identify the market direction using market context and focus only on trades towards the trend. Later on, we can use EMA to find both reversal and continuation trade.
Let’s see how EMA works as a reversal trade.
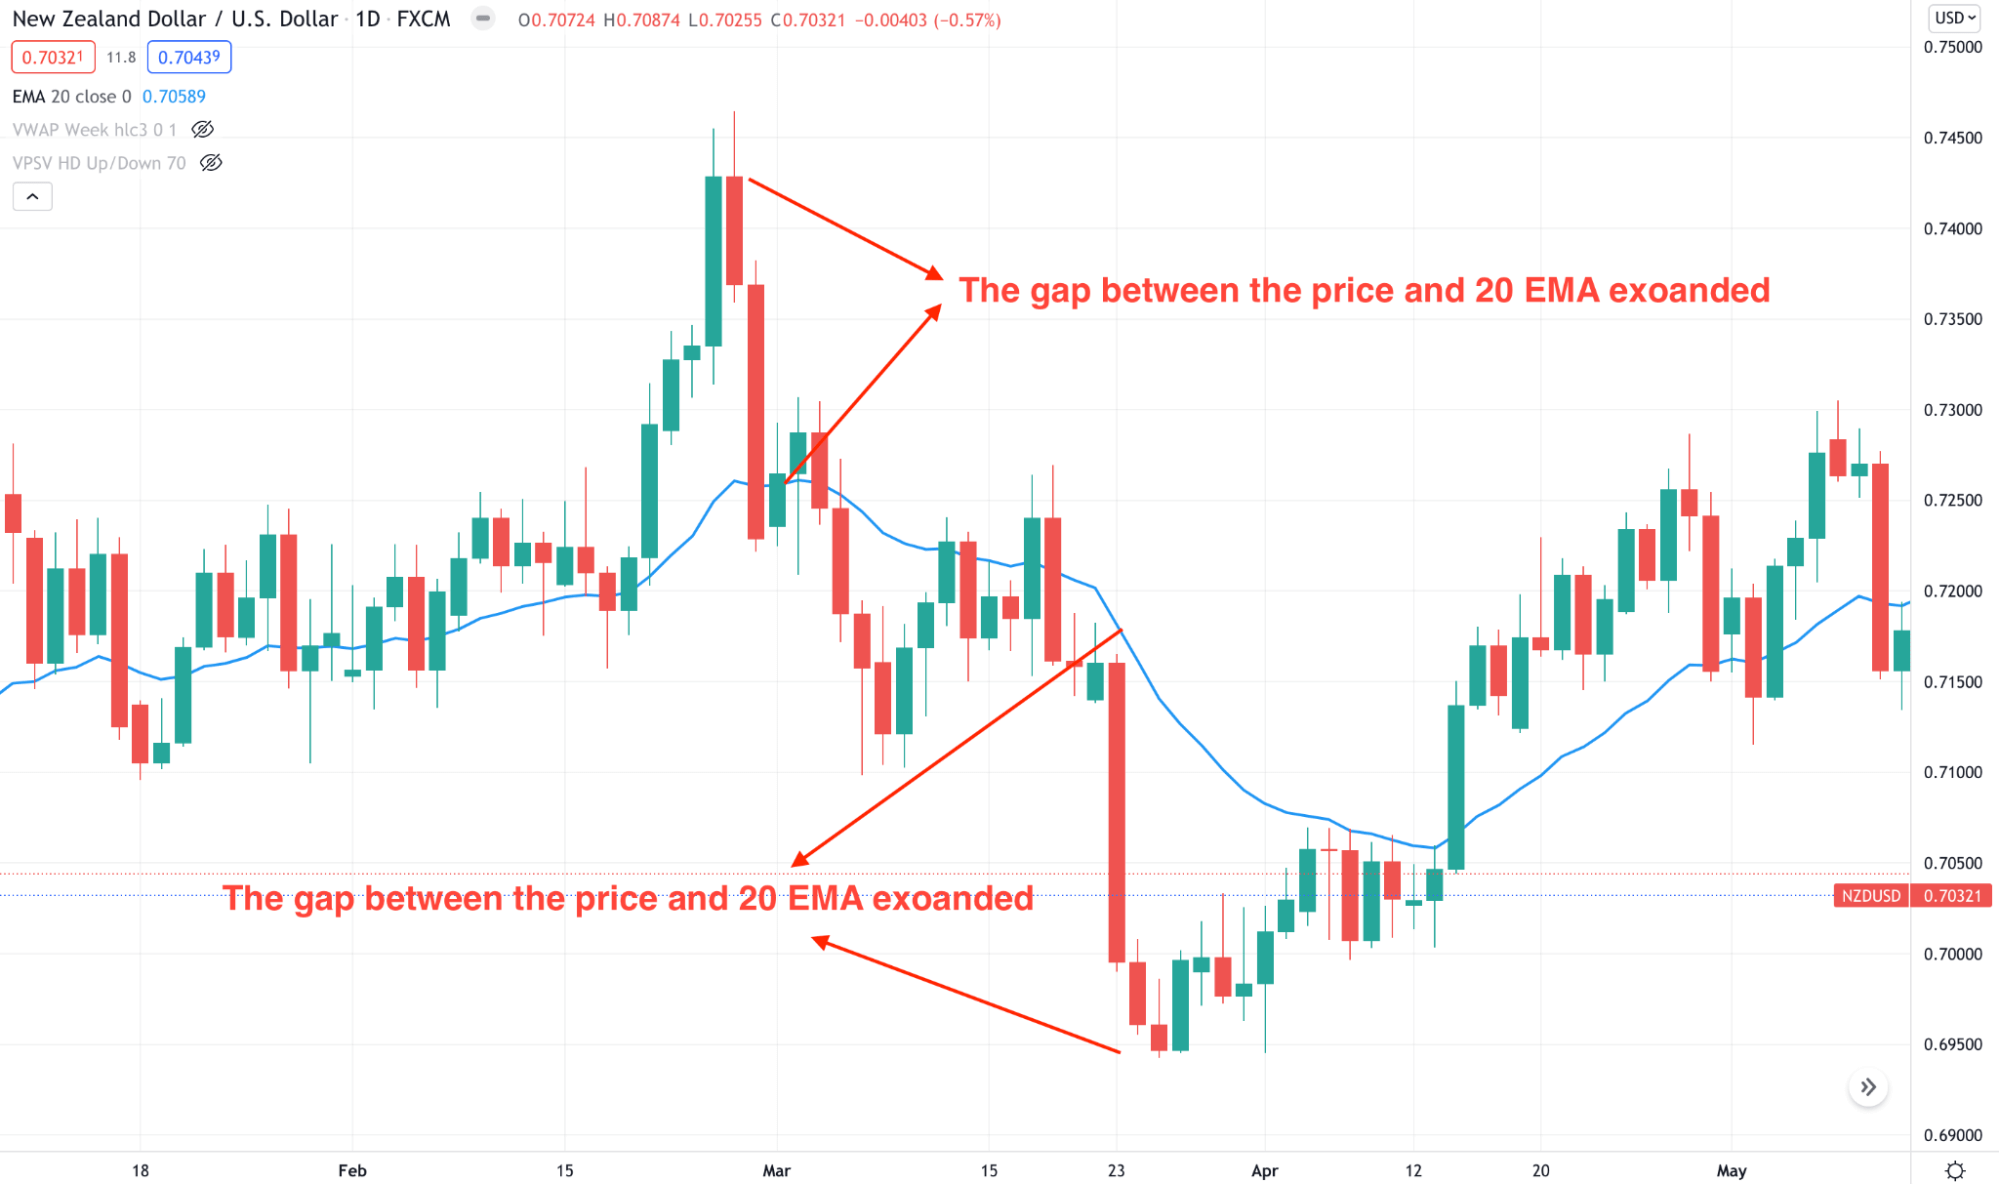
Mean reversion example
The above image shows what happens when the gap between the price and 20 EMA expands. This is because the price faces a gravitational force that increases pressure to come closer to each other.
Now, let’s have a look at an exact day trading method using EMA.
Step 1. Combine EMA with other indicators
In this strategy, we will use MACD with price action to identify the market direction.
- When the MACD histogram is bullish, we will find buy trades from dynamic 20 EMA.
- On the other hand, if the MACD histogram is bearish + EMA is showing sell signals, we will follow it.
In case of divergence, we can trade reversals with the mean reversion technique.
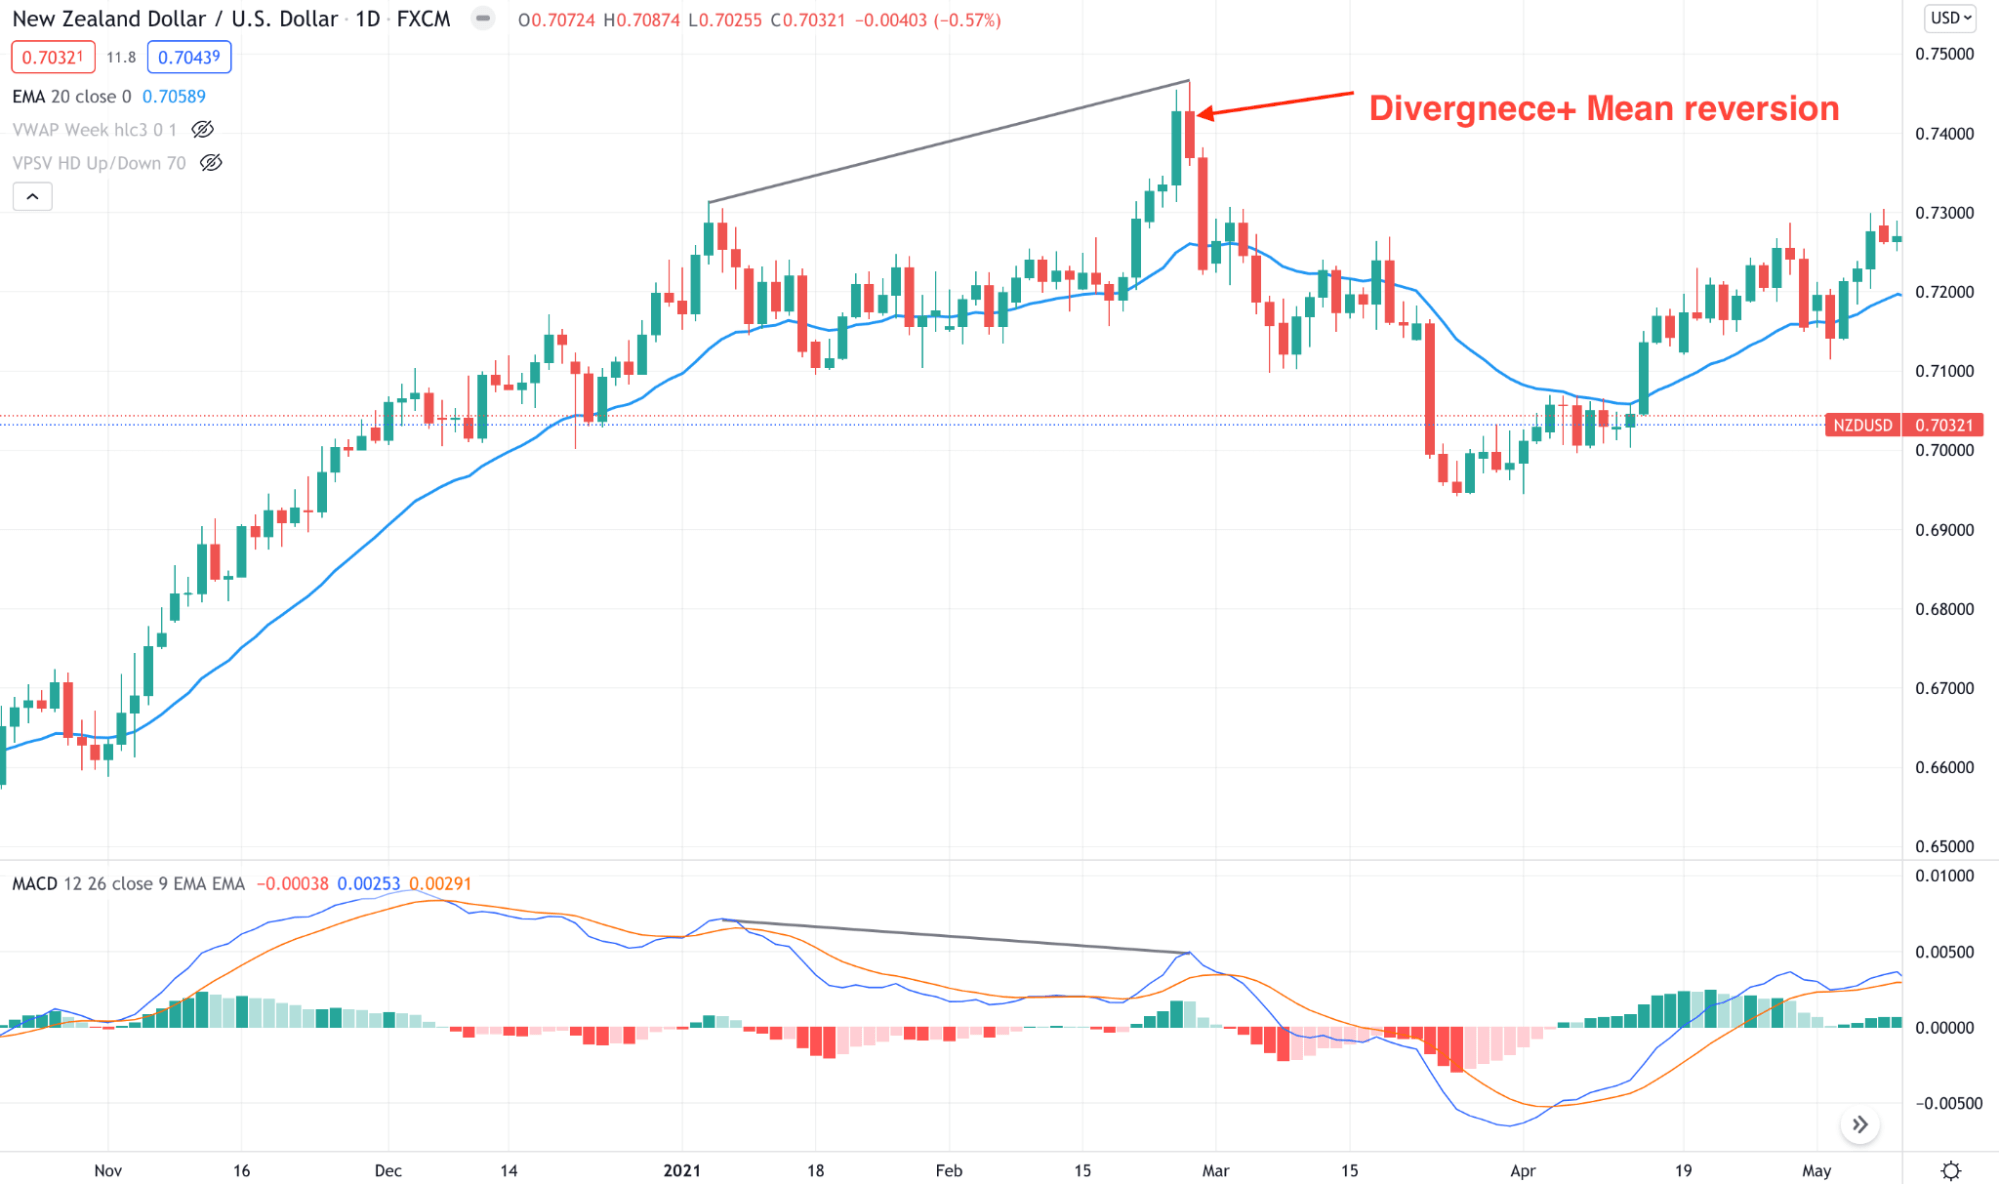
MACD with 20 EMA
The above image perfectly shows how the divergence and mean reversion works together.
Step 2. Combine EMA with price action
You cannot take a trade randomly by looking at the EMA. Instead, the trade should be logical if an appropriate price action forms from the EMA.
For example, wait for a bullish or bearish rejection from the 20 EMA before opening the buy/sell position, as shown in the image below.
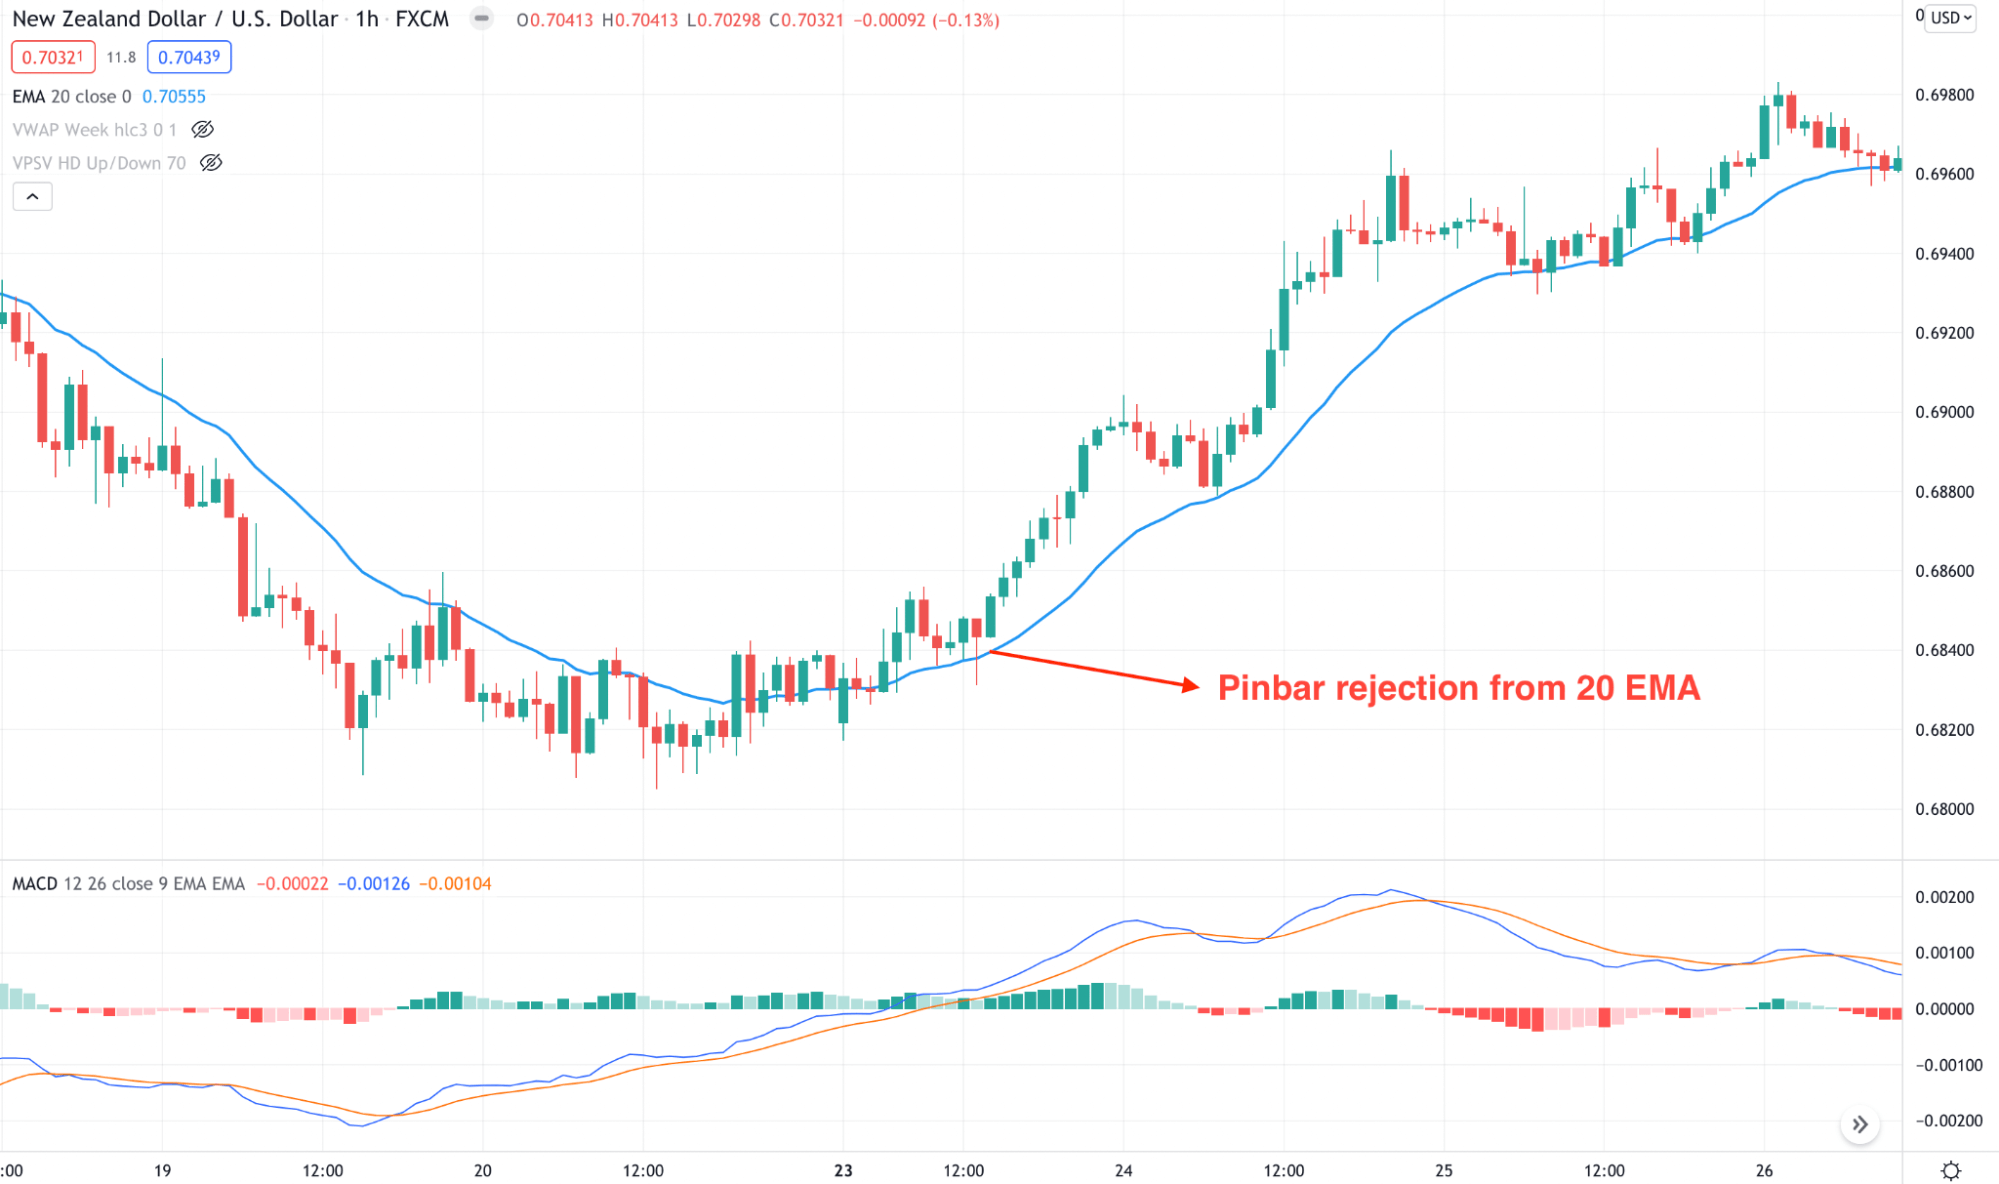
Pinbar rejection
Step 3. Create a system
The trading system should include where to open the trade and where to stop. Moreover, it would help focus on a sound money management system by ensuring that you are not taking too much risk per trade.
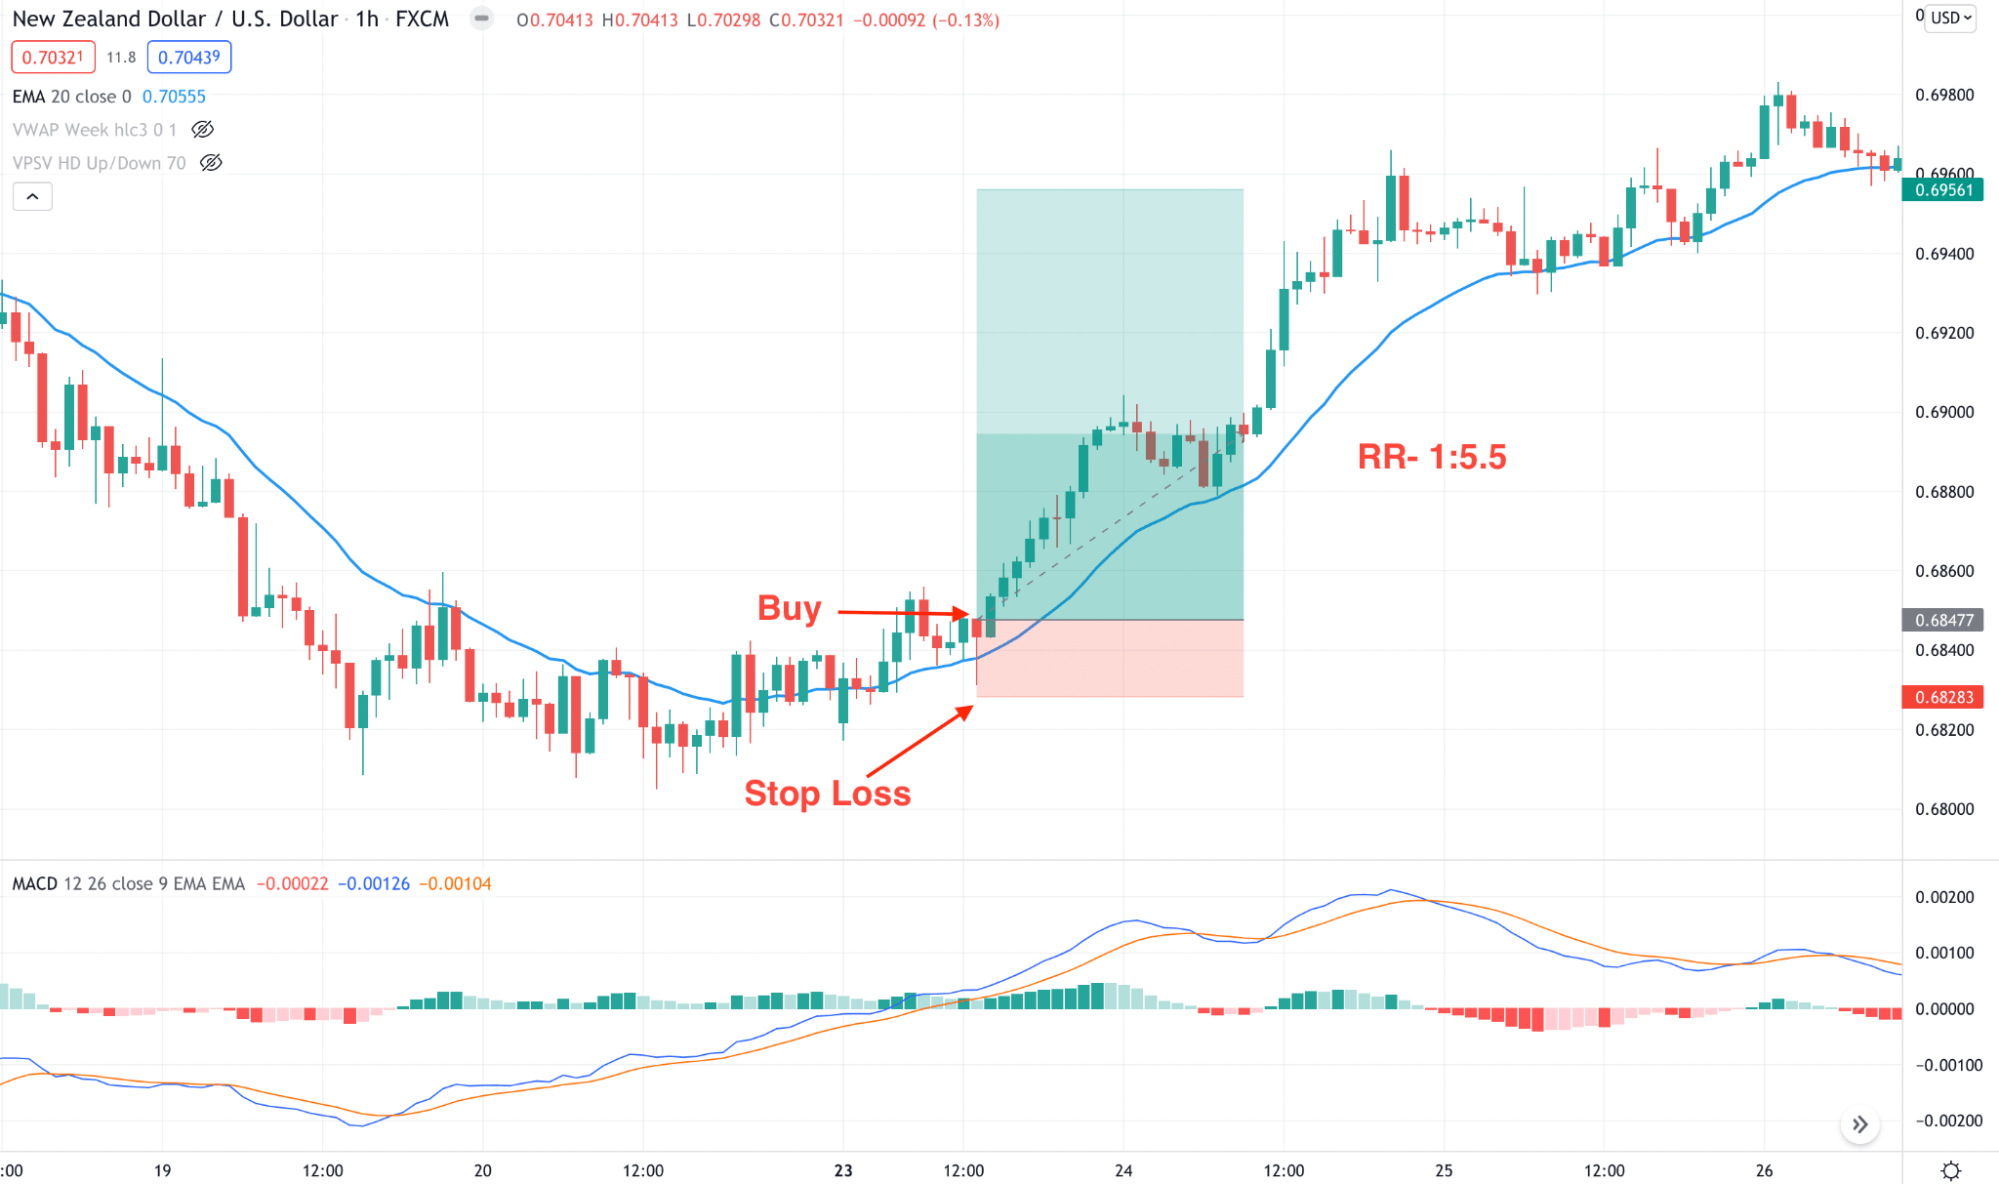
A good RR based trade
Step 4. Use the support and resistance
The trading decision should come from the combination of 20 EMA and S/R levels. Focus on buy trades if the price is above any vital support level. Moreover, rely on higher time frames to find the most effective levels. Another approach is to focus on event levels that work as both support and resistance.
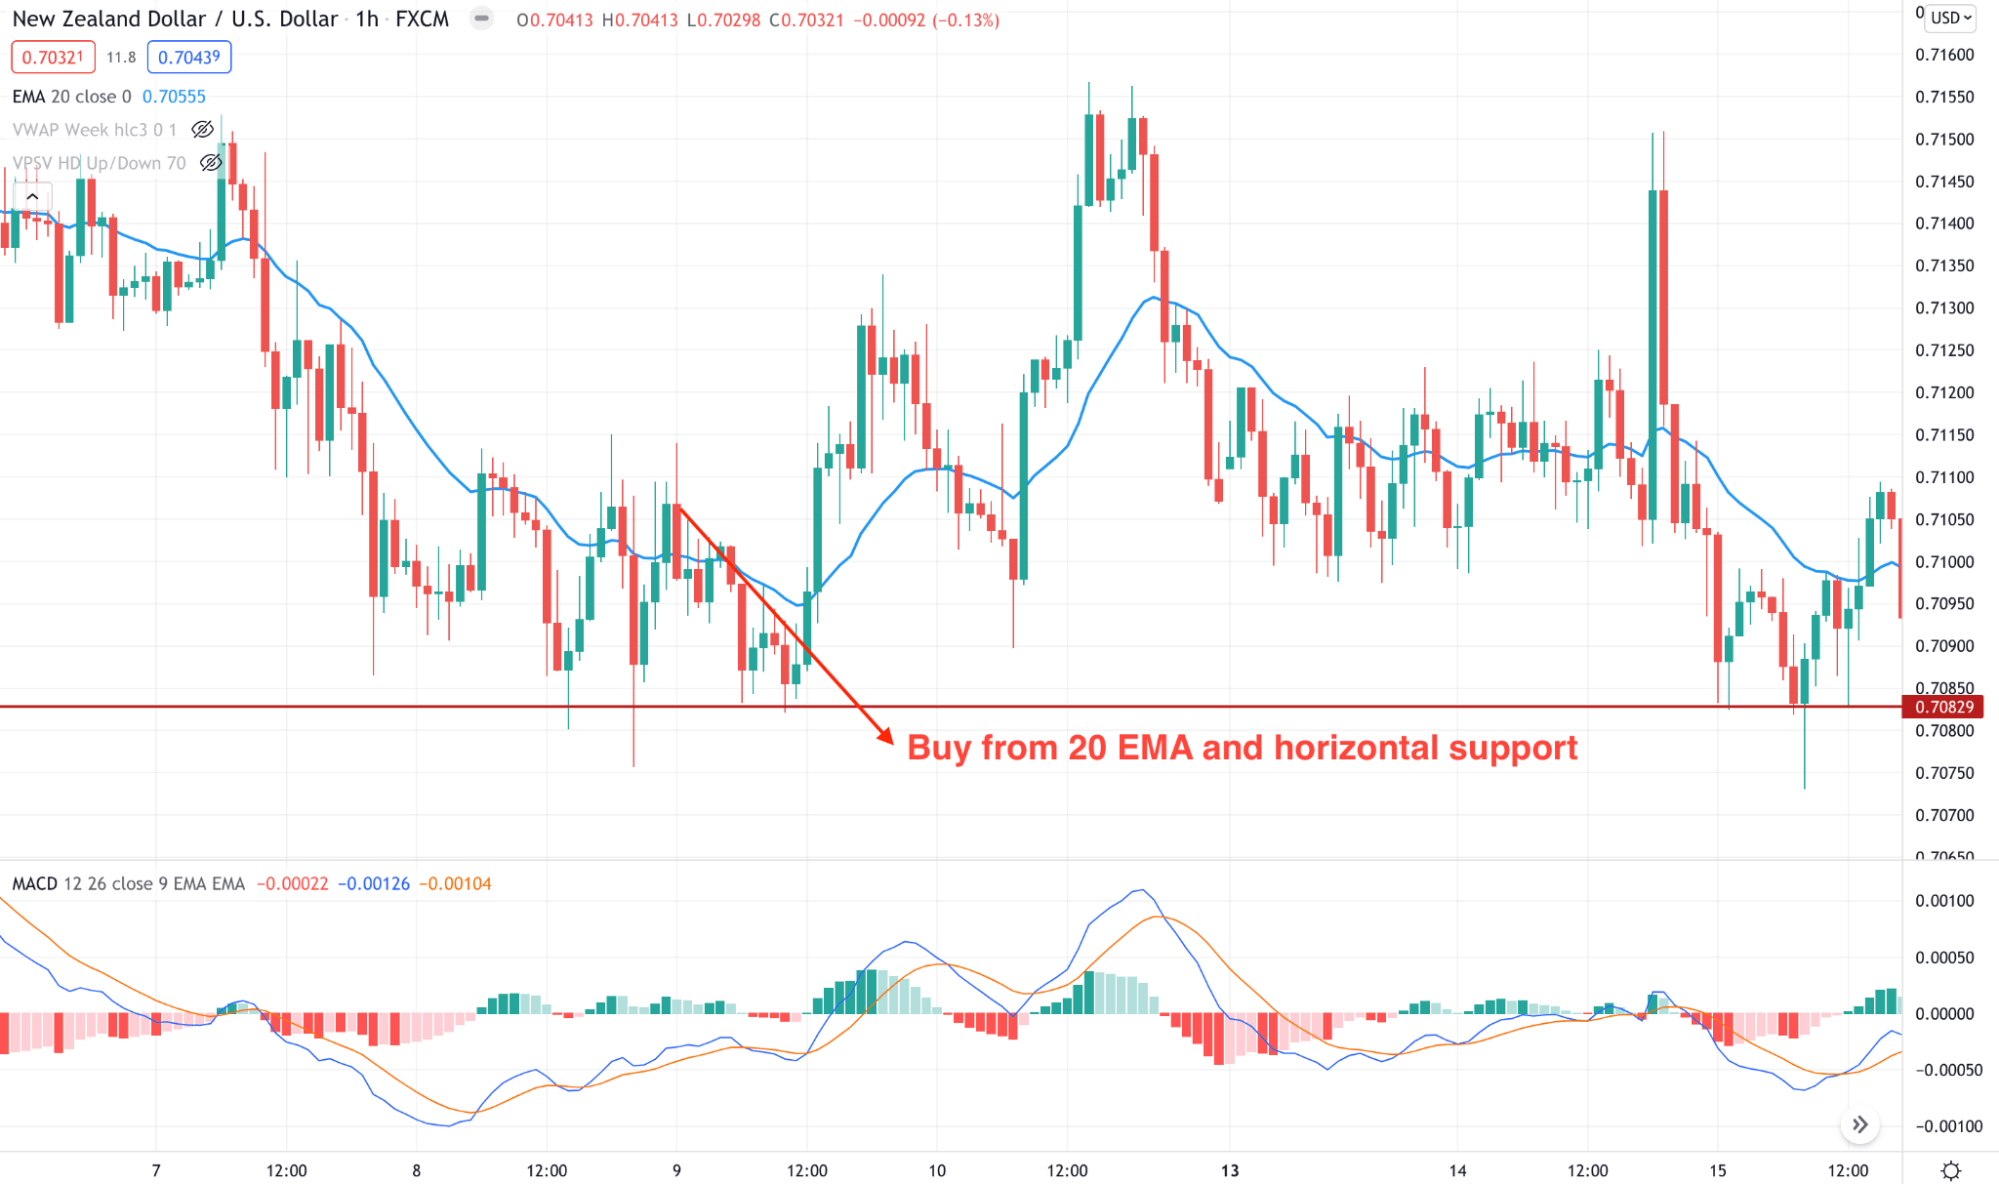
Support resistance with 20 EMA
Step 5. Learn the trend trading
There is no way to chase the trend. The best approach is to identify the trend in a one-time frame higher. In that case, we are trading in the 15M chart, so we need to see the market trend in H1. If the H1 is making new highs, only focus on buy trades from the 20 EMA.
Final thoughts
If you can match your requirement from this strategy, you can earn enough money but make sure to consider the market uncertainty. No trading system provides you a guaranteed profit. You need to understand the best time to open a trade and sit back and observe the market.


Comments