Traders and investors are always keen to know about the best trading strategies to make big profits in FX. Therefore, strategies for stocks, forex, synthetic indices, or any other trading market might be handy and updated according to the market conditions.
Learning any new trading strategy is not easy because of taking lots of practice and backtesting to make sure it works in the live market. In addition, there is no such strategy that can play the role of a “magic pill” and make you win all the time. Few strategies work well in a bullish market, some in choppy and some in the bearish market.
So, the question arises, do we have any trading strategy that can work well and give a good win? Well, in this article, we will discover the 15min scalping strategy, which has been trial and tested even in the most volatile market conditions.
What is a trading strategy?
It is nothing but a sophisticated and straightforward trading technique that helps you win in the market if done right.
Anyone who knows how to play in the market and has good experience in trading can make their winning strategy. Few trading systems use indicators in their strategy, and some just the chart and candlestick patterns to trade in the market. Some critical factors to consider before making your trading strategy are your personality type, lifestyle, and available resources.
Trading with the 15 min strategy
We will keep the trading style as scalping as we use a lower time frame in this trading system. You must be wondering why lower time frame and why not higher? This particular strategy works on all the time frames, but trading it in a lower time frame, mainly 15 min, gives the most reliable results.
So that you know, scalping is one of the trading styles that traders use to make a quick profit from the market. Scalping attempts to enter the market, take out profits from small fluctuations, and exude from the position once satisfied with the profit.
In this strategy, we will be using three simple moving averages, all with different periods. A moving average is one of the most popular technical indicators that market analysts and investors may use to determine a direction.
We will use the MA to examine support and resistance by evaluating an asset’s price movements.
Indicator setup with example
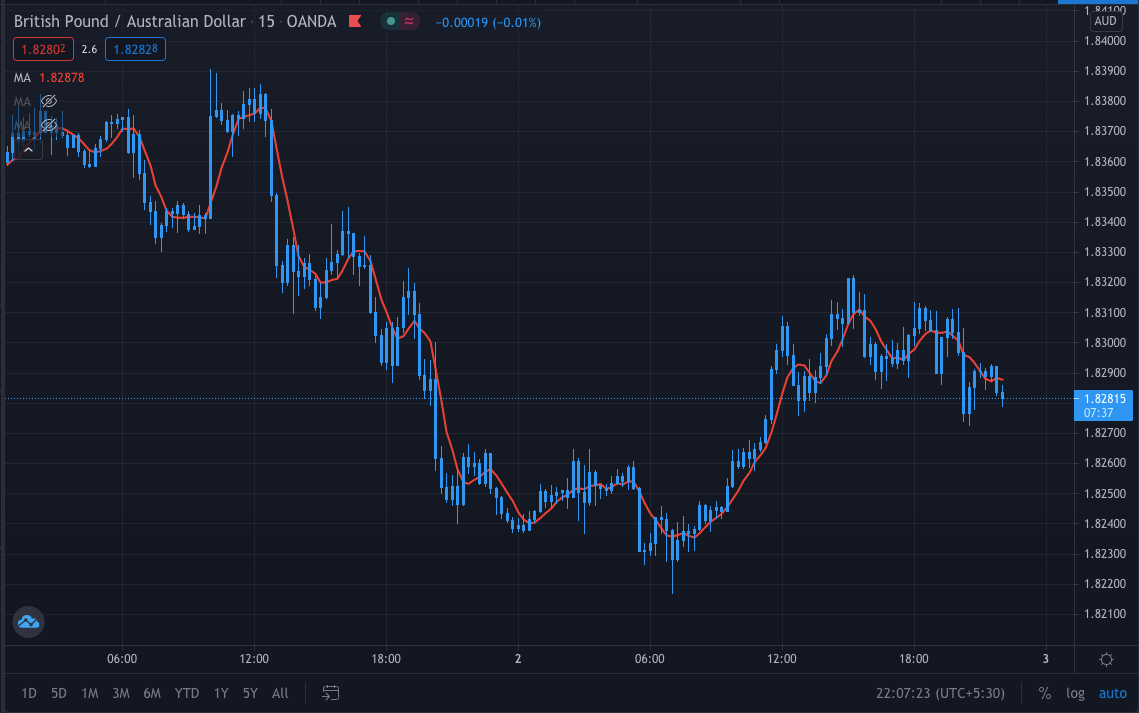
Adding the first SMA to the chart
The first moving average we will be using is the SMA of period 6. We will change its color to red. Let’s look at the setup in the GBP/AUD chart.
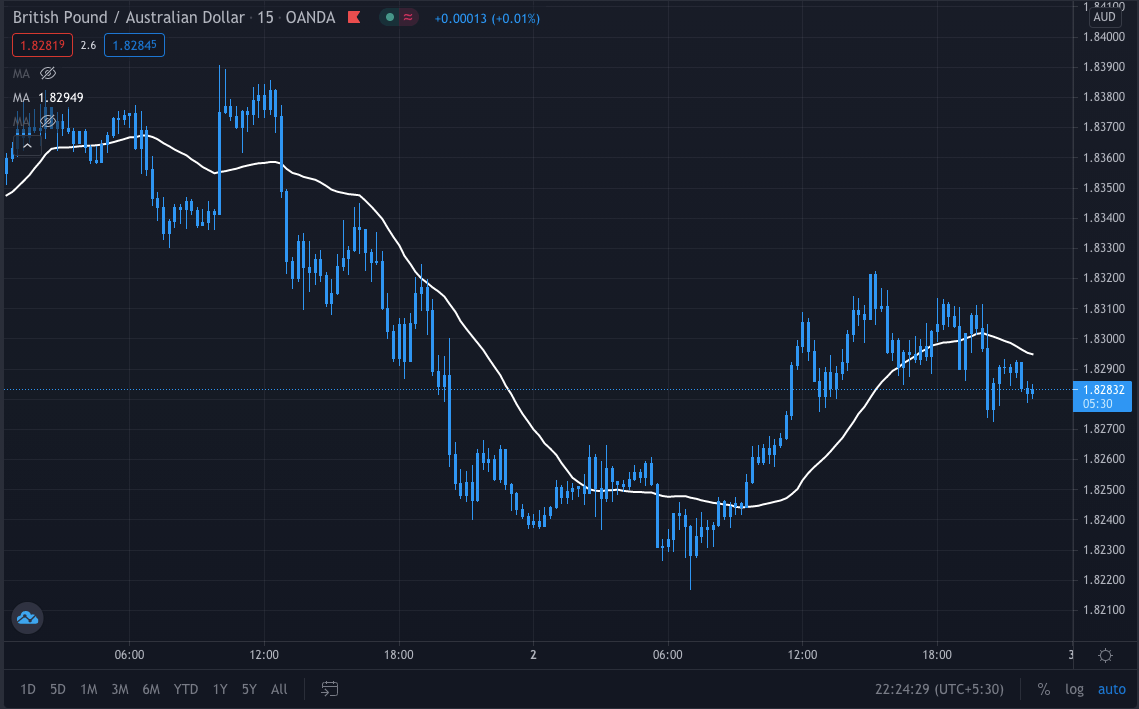
Adding the second SMA to the chart
Once we have the chart’s first SMA, we will add the second SMA of period 26 and change its color to blue, just like the GBP/AUD chart below.
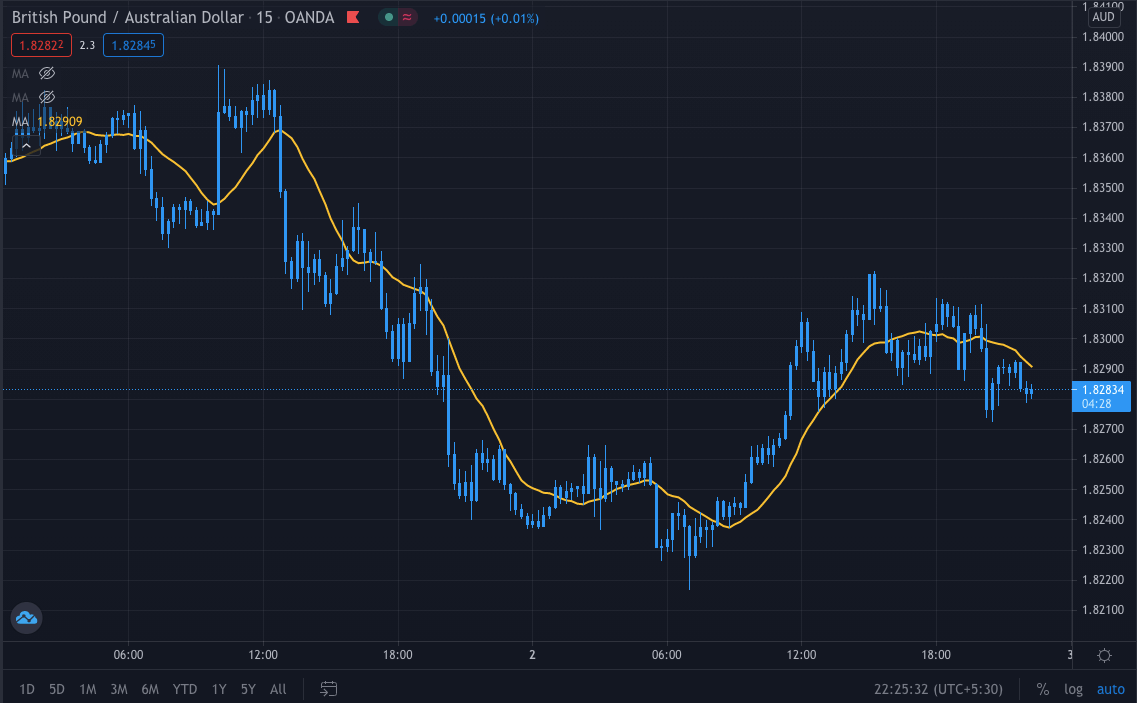
Adding the third SMA to the chart
Now, as we complete adding the two SMA of periods 6 and 26, moving forward, we will add our third SMA of period 14. We also have to keep in mind to change its color to yellow.
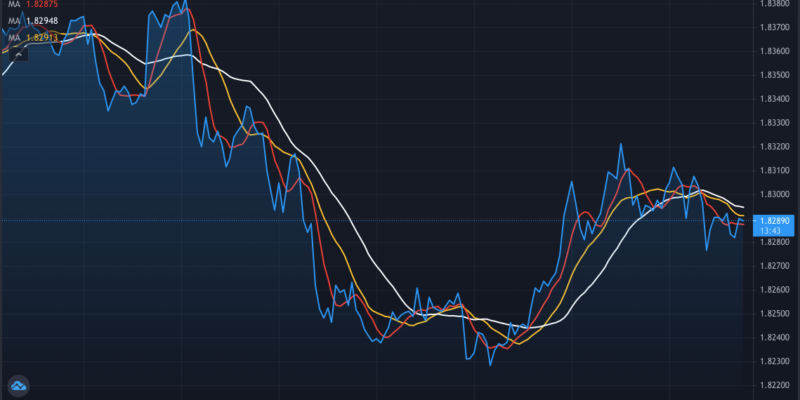
Finding trading signals using 15 min strategy
When we have all the moving averages on our chart, we will know how to figure out the buy/sell signal.
All the SMAs play an essential role in this trading strategy for providing the signal, but we need to notice the red SMA spot first as it is most important once. We will first notice the red and the yellow SMA crossover.
Buy
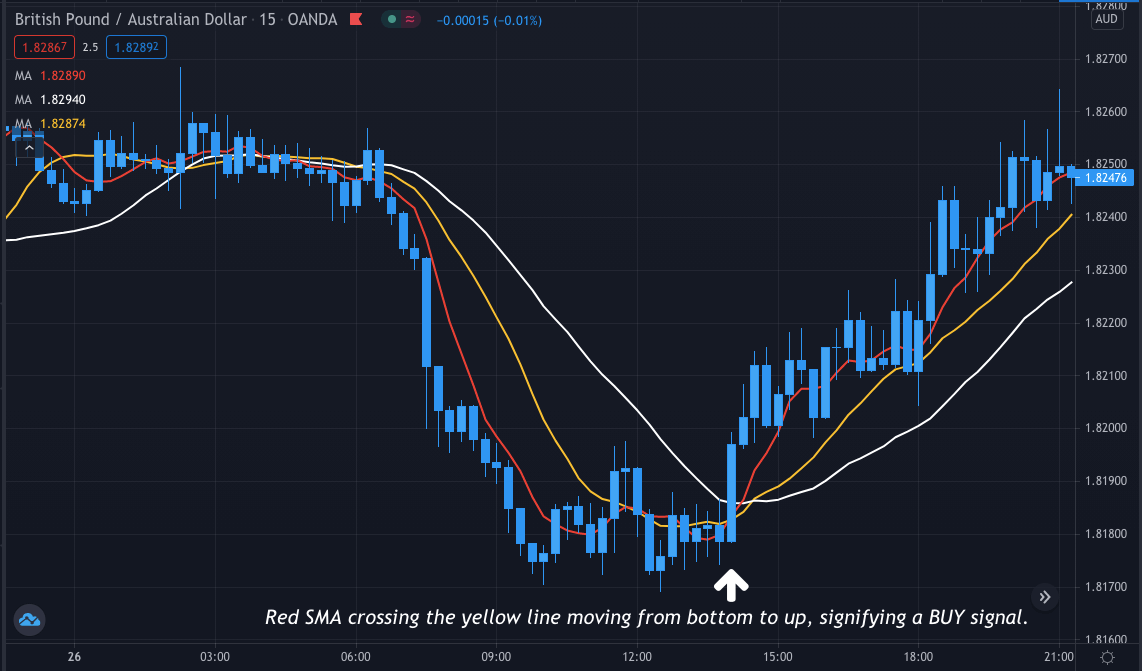
- If the red SMA crosses the yellow SMA moving from bottom to up, that signifies a buy signal.
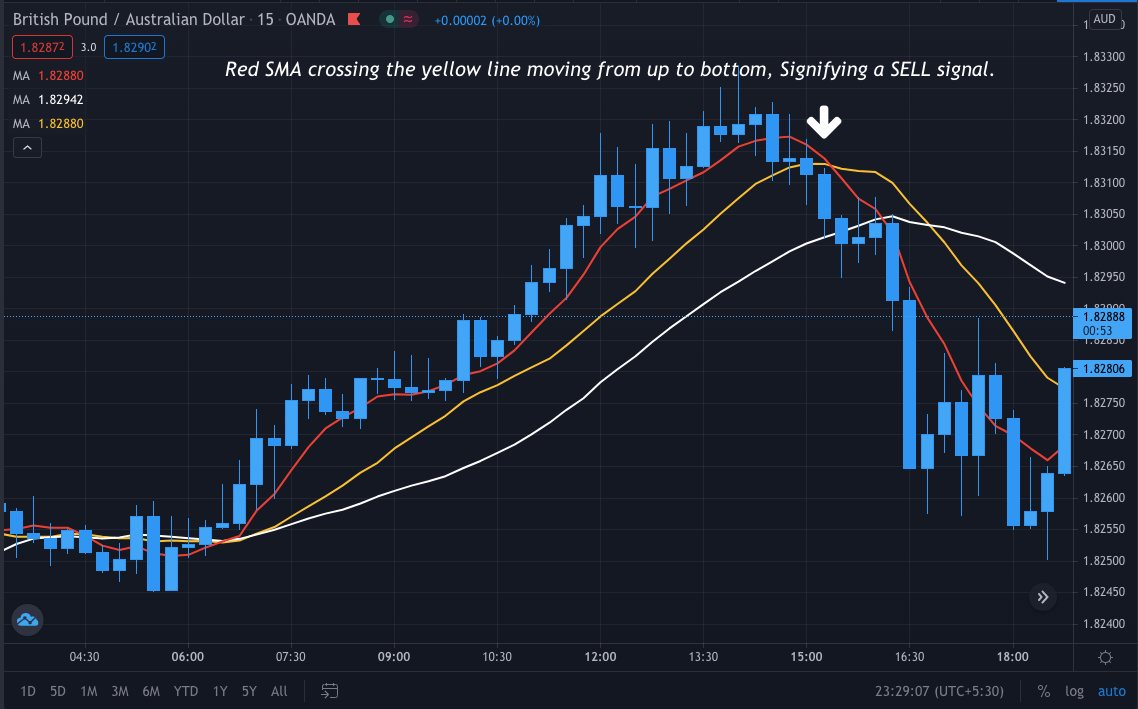
Sell
- Whereas if the red SMA crosses the yellow SMA moving down from up, it indicates a sell signal.
Now, that’s not it; just the crossover between the red and yellow SMA alone cannot give you a valid signal. And that’s when the white SMA comes into the picture.
Buy
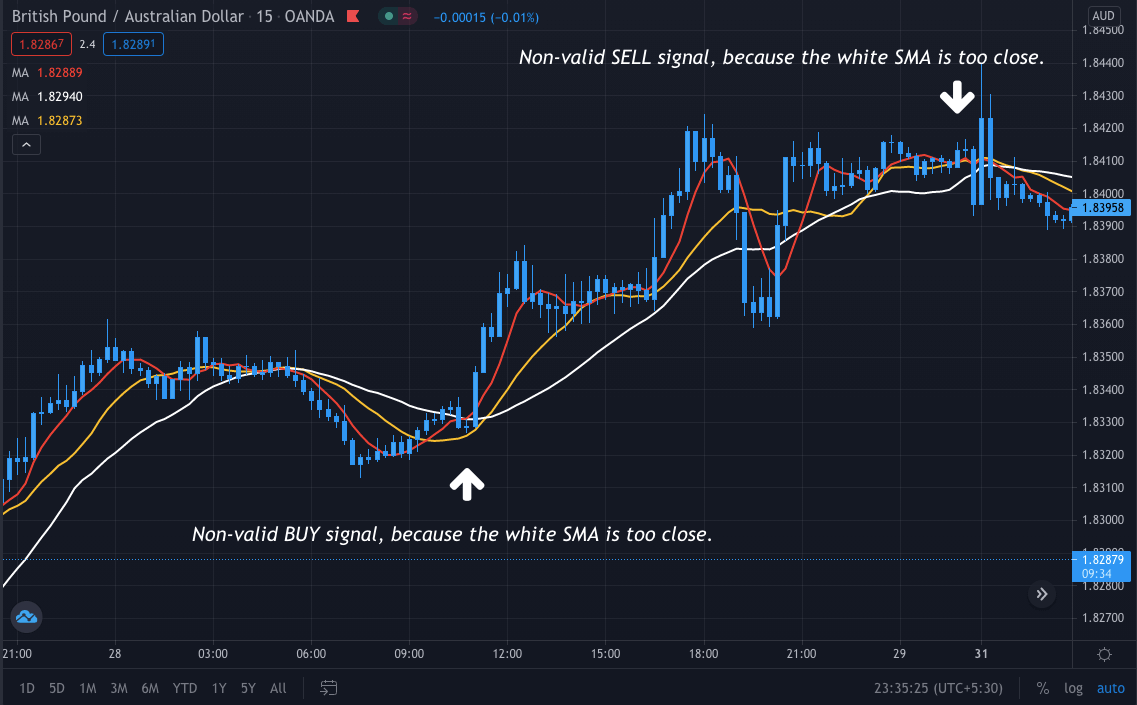
- When we get a buy indication from the crossover of red and yellow SMA from the SMA moving from bottom to up, you need to make sure the white SMA is above both the red and the yellow SMA.
- If you see the white SMA is not above both the SMA, you will not take the trade as it will be an invalid buy indication.
Sell
- Similarly, in the sell signal, while the red SMA is crossing the yellow SMA from moving down from up, you need to make sure you take the sell trade only when the white SMA is below both the red and the yellow SMA.
- If the white SMA is failing to do so, you will leave that trade.
If any of these conditions are not satisfied, you will not take the trade. Better enter the trade when you have a clear picture, and the SMA crosses each other perfectly with the white SMA supporting the signal.
Entering and exiting from the market depends solely on you as this is a scalping strategy. You can enter the market not immediately after the crossover but at the ending of the current running candle by placing your stop-loss at 20pips. Once you have made 1:2, you can come out of the market or move SL to breakeven and drive the market for some time.
Conclusion
The scalping trading style often seems simple to many traders, but actually, it’s the toughest because it is not always possible to catch the price in such a short period. Furthermore, this 15 min trading strategy is not a holy grip as nothing is 100% in trading. So it is always better to use candlestick analysis and price action to add more accuracy to the trading system.


Comments