Relative Strength Indicator or RSI is a widespread statistical contrivance among traders. This indicator tells you whether the market has reached its saturation point or not. You can use the tool to enter or exit the market depending on several conditions.
What is RSI?
J. Welles Wilder Jr. established the indicator, which is from the family of momentum indicators. He introduced it in his book “New Concepts in Technical Trading Systems” in 1978. RSI helps to gauge whether a market represents an oversold/overbought condition. The indicator swings between the two extreme values, i.e., 0 and 100.
RSI may point to a bullish or bearish setup on the chart. The conventional interpretation comprises two points:
- If the value reaches 30 or below, it is considered an oversold condition.
- If the value touches 70 or above, it indicates an overbought condition.
The tool is unlike the rest of the momentum indicators because it processes the extent and speed of the market. Thus, it essentially aids the forex traders to catch the right time and price to open or close trading positions.
According to J. Welles Wilder Jr. book, the indicator’s formula as follows:
RSI = 100 – [100 / (1 + (average of upward price change/average of downward price change))]
All charting packages automatically place RSI on graphs, so the trader shouldn’t worry about the complexities of computing the value yourself.
History of RSI
J. Welles Wilder Jr. introduced plenty of statistical tools in his book like ATR, PSAR, ADX, and the RSI, which received more popularity than other peers.
Wilder was not a trader initially, but he was a mechanical engineer before turning into a technical analyst. He began his trading career in 1972 but couldn’t gain success in his early years. However, Wilder was able to perform meticulous research on trading and using his experience. He invented several mathematical formulas that were later adopted by the trading community. Despite the forty years passed, many contemporary chartists still use his book as a reference.
Due to its popularity, RSI is readily available in many charting packages, including MetaTrader, TradeStation, and many others. As a result, traders widely imply this confirmatory technique to increase their odds to win in trading.
How to use RSI?
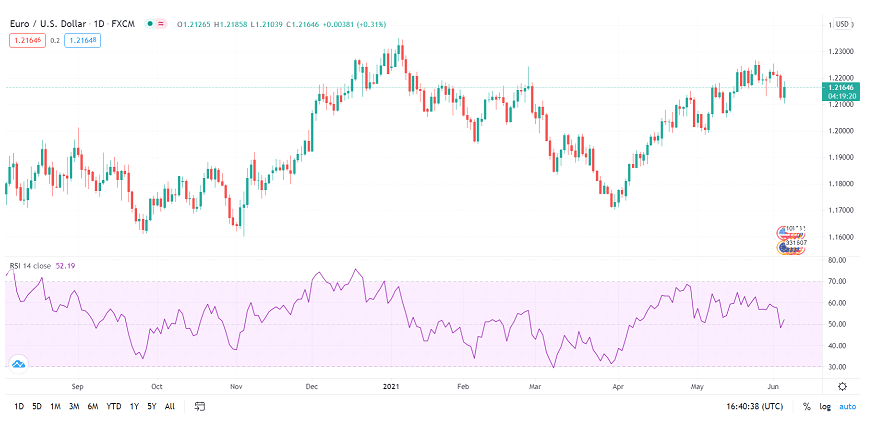
The default value of the tool is set at 14 periods. If you are on a daily chart, the indicator will calculate the value of the last 14 days. The tool calculates the average rise and divides it by the average decline. The indicator then plots the data on a scale of 0 – 100.
As we already discussed, the indicator belongs to the momentum family; its objective is to measure the rate at which the price varies over time:
- If momentum rises with the price rise, it reveals that the market participants are strongly purchasing the asset.
- If momentum escalates to the south, sellers dominate in the trading.
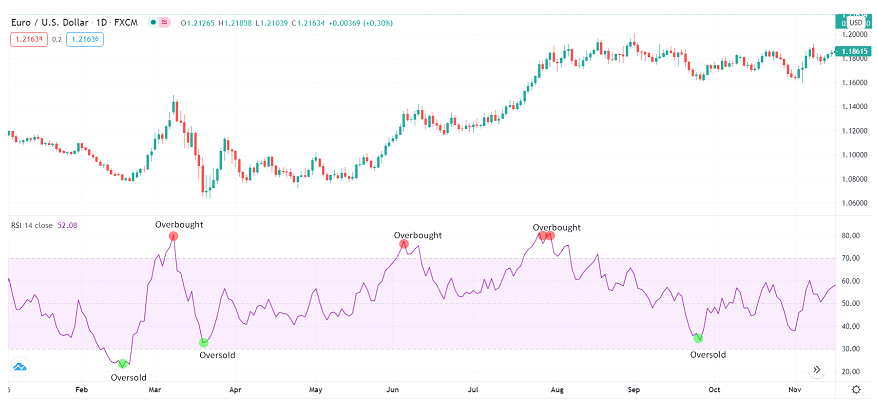
You can quickly identify the oversold/overbought conditions of any asset. You can see the indicator values start from 0, and the max point is a hundred.
- The RSI value below 30 tells you that the market has reached the bottom, and there may emerge fresh buying opportunities.
- If the indicator value gets above 70, it means that the asset price has already reached the top, and you can find a new selling trend in the market.
You can use the same 30 and 70 levels to exit your existing positions.
You can play around with the period settings depending upon your choice and expertise. Decreasing the period will render your indicator more reactive to the price, while escalating the period may reduce the noise. If you intend to scalp, you may reduce the period. In that case, your oversold/overbought regions can be considered at 20 and 80 rather than 30 and 70. Unfortunately, you cannot control the false signals then.
RSI trading strategies
There are lots of variations of trading strategies based on the indicator. However, RSI divergence has been quite popular amid the simplicity and accuracy of the system. So let’s find out more about it.
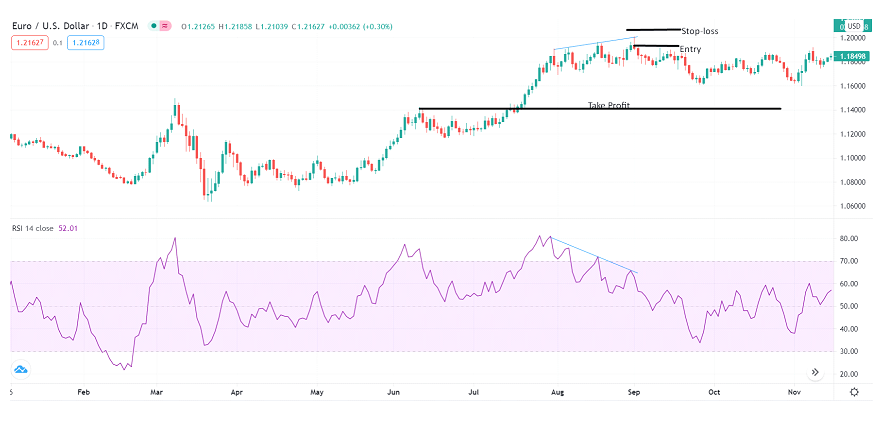
Bearish divergence
Do you know what a bearish divergence looks like? It appears when the prices are on the rise, but the indicator starts moving to the downside. This shows a discrepancy between the RSI and the price and an early sign of trend reversal.
After finding such a sign on your chart, you should wait for the current candle to close. Then you can enter a short position at the current market price. Like any other strategy, there’s always a risk while trading bearish divergence, so keep your risk limited by placing a stop-loss. Next, you can put a stop near recent swing highs. Then, you can book profit on the position near the next support level.
Bullish divergence
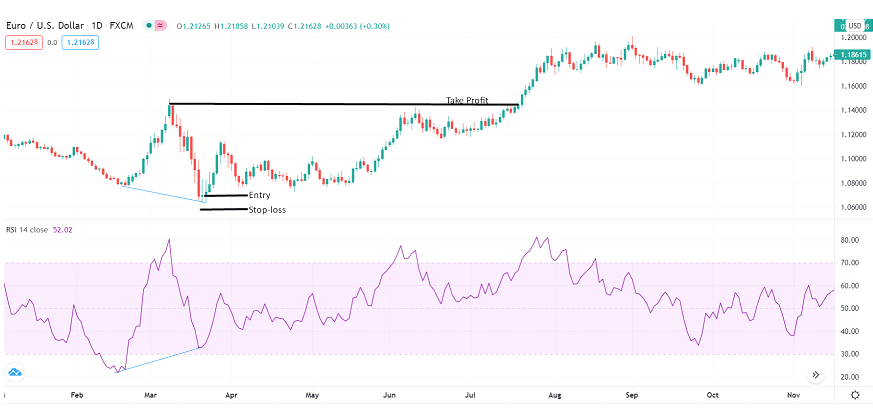
Bullish divergence appears on the chart when price forms two new lows, but the indicator posts fresh higher highs. The conflict between indicator and price is known as divergence.
If such bullish divergence appears on your chart, be ready to enter a long position. Just wait for the current candle to close. Once you enter the long position, place your stop-loss near the recent swing lows while the “take profit” can be placed near the next resistance zone.
What to remember when using RSI?
While using the tool, you should not forget that there is always a probability of wrong entry. Therefore, never leave your risk open and limit it with your stop-loss order. You may find numerous entry signals as the tool is lagging. It mainly depends on the historical price data.
If you trade on lower time frames or use decreased periods, you may find several fake signals. Hence, the best solution is to use increased periods on higher time frames to maintain accuracy.


Comments