Candlestick patterns reflect participants’ actions on a specific period on any financial asset. Learning them enables participating in trades with more profitability. Price action traders are intelligent market participants who often perform naked chart conduct analysis by patterns with other fundamental and technical info.
However, it requires basic skills to identify any pattern and trade with it. This article will introduce you to the evening star pattern. After completing, you can execute both short-term and long-term trades using it as we describe both with charts for better understanding.
What is the evening star pattern?
It is a combination of three different types of candles. It shares some similarities with the Doji star pattern. It is a standard pattern that technical analysts of the financial markets use to define when the current trend ends. This is a typical formation of candles that you will find at the end of an uptrend price movement of any financial asset. It usually generates a strong reversal signal on the asset price.
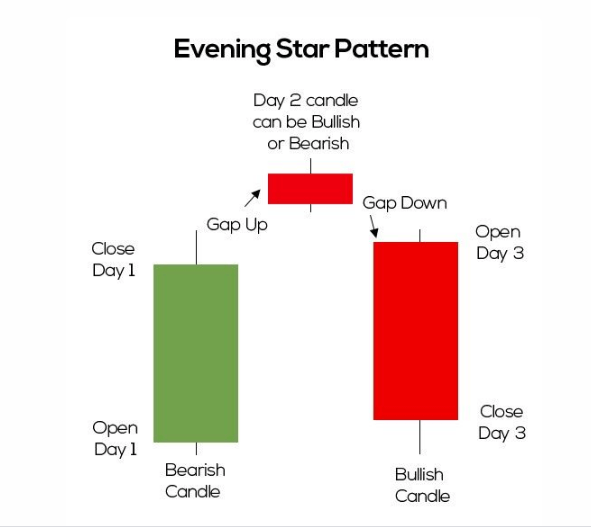 An ideal evening star pattern has four components or conditions, such as:
- This pattern will be visible at the end of an uptrend.
- The first candle of this pattern will be bullish.
- The second will have a more petite body than the other two, bullish or bearish — a small body with wicks on both sides.
- The third will be bearish, which completes the whole pattern.
This pattern is simple to explain; the price reaches the end of the bull trend till the first bullish candle. Then the next candle with a tiny body and wicks declares that participants may not have the same interest in buying as the previous day or have indecision. The third candle states that the sellers come back and continue to sell, and the price may decline more for the selling pressure.
How to trade with the evening star
You can perform naked chart trading or price action trading with this pattern if you have sufficient skills to identify support-resistance levels. You can also trade it with technical indicators such as RSI, MACD, MA crossover, ATR, Bollinger Bands, etc.
Trade idea using the evening star pattern
This pattern only generates signals for placing sell orders. Meanwhile, the contrary version of this pattern is the morning star pattern, which you will find at the edge of downtrends.
A short-term trading strategy
Besides evening and morning star patterns, we use support & resistance levels to identify potentially profitable trading positions for short-term trades. You can use any time frame to trade with this strategy.
Lower time frame charts involve fake swing highs/lows; we use an hourly chart to apply this strategy to avoid those counterfeit swing levels. Determine the support-resistance levels with other vital levels, such as historic levels, weekly-daily open, high, low, close, etc.
Bullish trading strategy
When price comes to any support level and the formation of the morning star pattern appears at the finishing line of a downtrend, you get a chance to place buy orders.
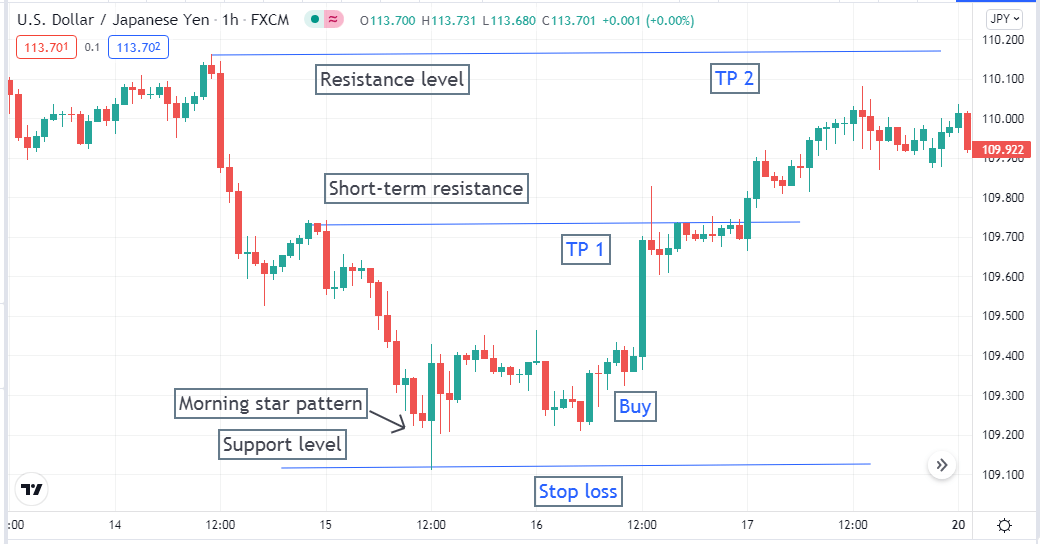
Bullish setup
Entry
When price candles reach support level, complete the morning star pattern. Place buy order.
Stop loss
The stop loss level of that buy order will be below the current support level.
Take profit
The first profit target will be below the nearest resistance level.
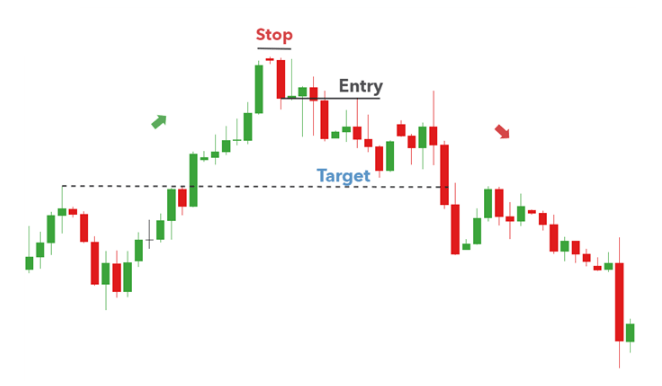
Bearish trading strategy
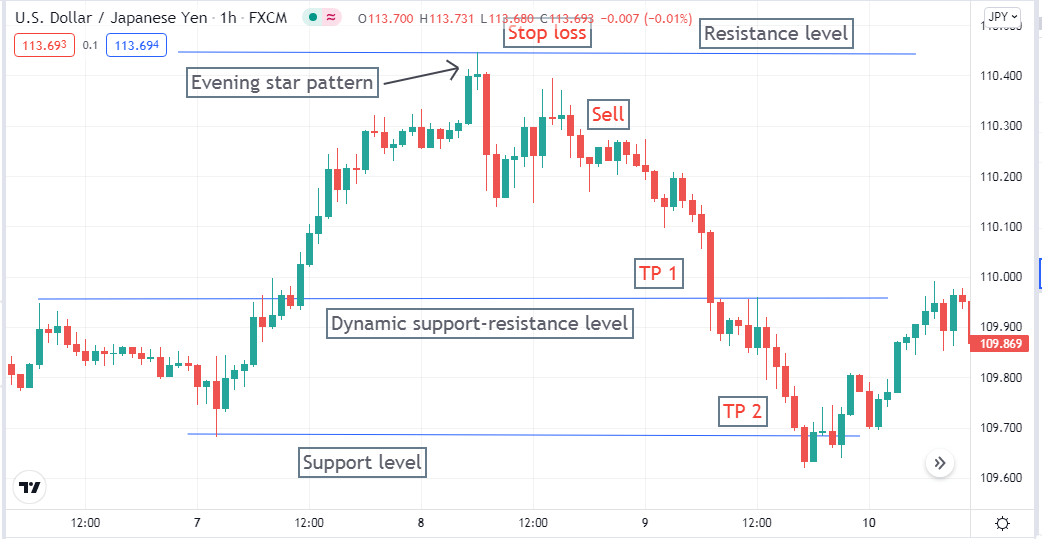
Check the price ends up the current uptrend by forming an evening star pattern. It is better if the pattern takes place near any resistance level. It enables your selling opportunity with more potentiality.
Bearish setup
Entry
When price candles reach resistance level, complete the entire evening star pattern. Place sell order.
Stop loss
The stop loss level of that sell order will be above the current resistance level, which is also above the pattern formation.
Take profit
The first profit target will be above the nearest support level.
A long-term trading strategy
We use a popular technical indicator, the RSI, besides evening and morning star patterns in our long-term trading method. Furthermore, it will help spot support resistance levels to determine entry/exit points of any executing trade.
This strategy works fine on every time frame chart for many financial assets, such as commodities, currency pairs, stocks, etc. We use the D1 chart to analyze the price movement through this strategy for better results.
Bullish trade setup
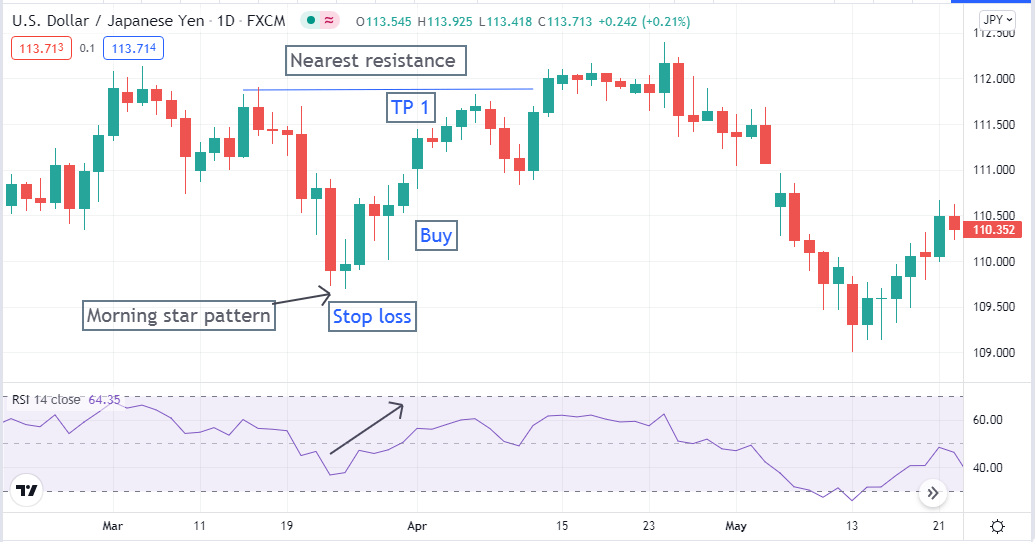
When you want to buy positions at your target asset, check the chart carefully and seek morning star formation at any support level. May the swing low of the current downtrend be the second candle of the morning star with a tiny body and wicks.
Bullish setup
Entry
When the whole morningstar pattern completes the formation check the RSI indicator window for more confirmation. The RSI signal line may signal oversold by remaining near the lower (30) line. After the morning star, the dynamic line may head toward the upside. Place buy order.
Stop loss
The stop loss level is below the current swing low.
Take profit
The profit target will be below the nearest resistance level. You can close the buy order when the RSI signal line reaches near or above the upper (70) line.
Bearish trade setup
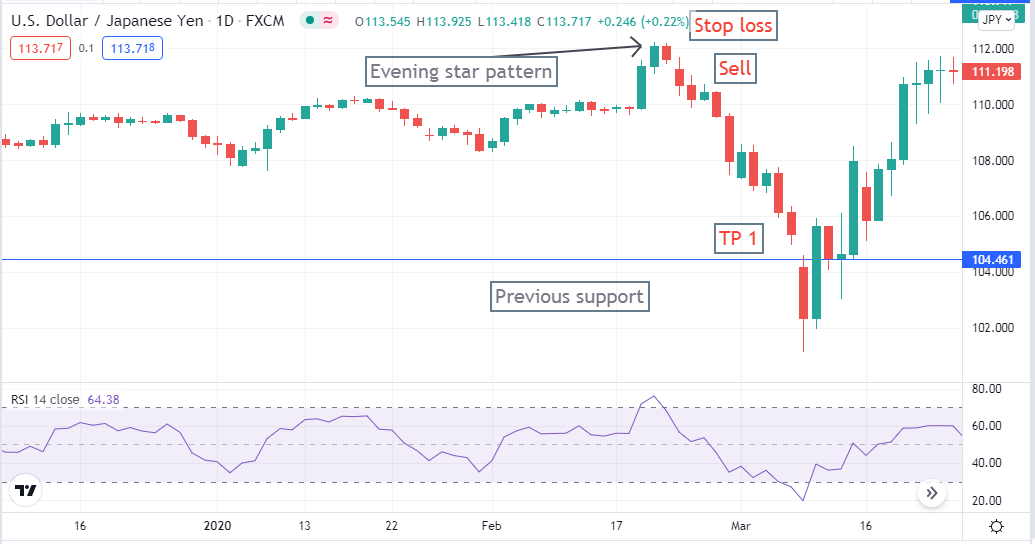
Check the chart carefully and seek evening star formation at any resistance level when you want to sell your target asset. May the swing high of the current uptrend be the second candle of the evening star with a tint body and wicks.
Bearish setup
Entry
When the whole evening star pattern completes the formation check the RSI indicator window for more confirmation. The RSI signal line may signal overbought by remaining near the upper (70) line. After the evening star, the dynamic line may head toward the downside. Place sell order.
Stop loss
The stop loss level is above the current swing high.
Take profit
The profit target will be below the nearest support level. You can close the sell order when the RSI signal line reaches near or below the lower (30) line.
Pros and cons
| Pros | Cons |
|
|
|
|
|
|
Final thought
This pattern is easily identified on the chart, even by beginners. Due to its simplicity and high probability of working off, it has not lost its popularity for several decades. To improve trading reliability, we recommend using patterns of this type from higher time frames and applying a filter in the form of horizontal levels.
Finally, when making an entry using this pattern, wait till the entire formation and check other supportive info. Be careful to trade with it during any trend-changing event, such as interest rate data, GDP, Central bank events, etc.


Comments