
NRMA stop and reverse is an efficient MT4 indicator that allows financial investors to determine the market context. Many financial investors use this indicator to generate trade ideas for many trading instruments as the concept is straightforward and effective. So it makes sense that the NRMA indicator can be an attractive trading indicator for crypto investors.
However, it is mandatory to have a particular level of understanding of any technical indicator when seeking to use it to participate in successful trades. This indicator introduces you to the NRMA and sustainable crypto trading strategies using it.
What is the NRMA stop and reverse indicator?
NRMA stop and reverse indicator is a popular MT4 indicator that detects the swing points and trend info by its unique calculation. This indicator has a green moving average line and a series of golden dots.
You may find similarities between the parabolic SAR and this indicator in visual, but this indicator is more efficient than parabolic SAR because it involves some additional calculation. Financial investors get trade ideas by combining the green MA line and golden dots’ appearance as the dots switch different sides of price candles.
How to trade using the NRMA stop and reverse indicator?
To understand the market context, you have to check on the MA line and NRMA dots and combine both. The MA line starts sloping on the upside when the price surge upwards. Meanwhile, the NRMA dots start appearing on the bottom side of price candles.
On the other hand, when the price starts declining, NRMA dots switch on the upside, and the MA line starts sloping on the downside. Combining both these, investors detect the price movement. You can use this concept independently to generate trade ideas or combine other technical indicators and tools to determine more efficient entry/exit points.
Short-term trading strategy
This trading method combines the stochastic oscillator and the NRMA stop and reverse indicator to determine trading positions.
First, we observe the NRMA indicator reading and then match it with the stochastic indicator window to confirm the entry direction. This method suits many trading assets in different time frame charts.
We suggest using 15 min or H1 charts to catch the most potent short-term trades, and checking upper time frame charts will help determine the actual price direction.
Bullish trade scenario
Apply both indicators to your target asset chart and seek opening buy positions by observing the conditions below:
- The MA line of the NRMA indicator starts sloping upwards.
- NRMA dots start appearing at the bottom side of price candles.
- On the stochastic oscillator indicator window, the light green dynamic line reaches above the dynamic red line near the lower (20) level.
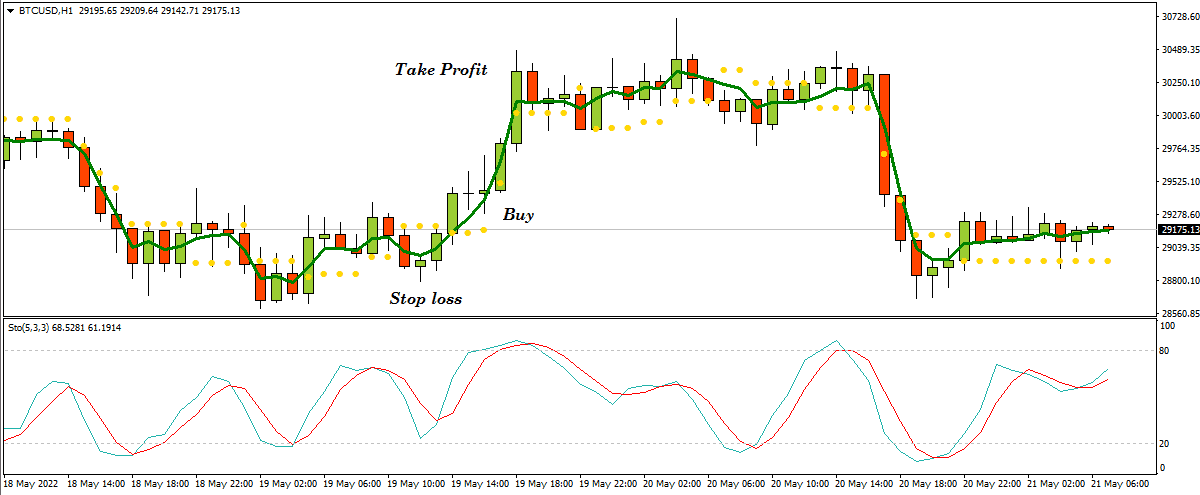
Bullish setup
Entry
Match these conditions above and open a buy position.
Stop loss
The initial stop loss level will be below the recent swing low with a 5-10 pips buffer.
Take profit
Close the buy order by checking the conditions below:
- The MA line of the NRMA indicator starts sloping downside.
- NRMA dots switch on the upside of price candles.
- The light green and the dynamic red lines reach near the upper (80) level or above and start declining after getting there.
- The light green dynamic line reaches below the dynamic red line.
Bearish trade scenario
Apply both indicators to your target asset chart and seek opening sell positions by observing the conditions below:
- The MA line of the NRMA indicator starts sloping downwards.
- NRMA dots start appearing at the top side of price candles.
- On the stochastic oscillator indicator window, the light green dynamic line reaches below the dynamic red line near the upper (80) level.
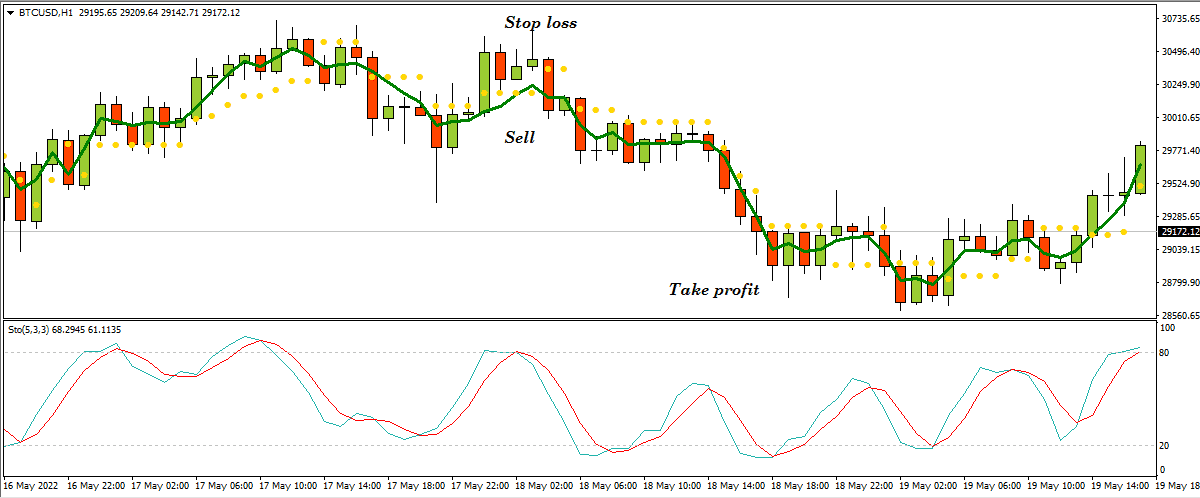
Bearish setup
Entry
Match these conditions above and open a sell position.
Stop loss
The initial stop loss level will be above the recent swing high with a 5-10 pips buffer.
Take profit
Close the sell order by checking the conditions below:
- The MA line of the NRMA indicator starts sloping upside.
- NRMA dots switch on the downside of price candles.
- The light green and the dynamic red lines reach near the lower (20) level or below and start rising after getting there.
- The light green dynamic line reaches above the dynamic red line.
Long-term trading strategy
We use the RSI indicator as a supportive indicator alongside the NRMA indicator to generate trade ideas in this trading strategy. First, we check the NRMA indicator reading and then match the info with the RSI indicator before confirming the entry. This strategy suits many time frame charts, and we recommend using it on an H4 or D1 chart to catch the most potent long-term trades.
Bullish trade scenario
Set both indicators and observe the readings below:
- The MA line of the NRMA indicator starts sloping on the upside.
- NRMA golden dots take place below price candles.
- The RSI dynamic line remains near the mid (50) level and heads on the upside.
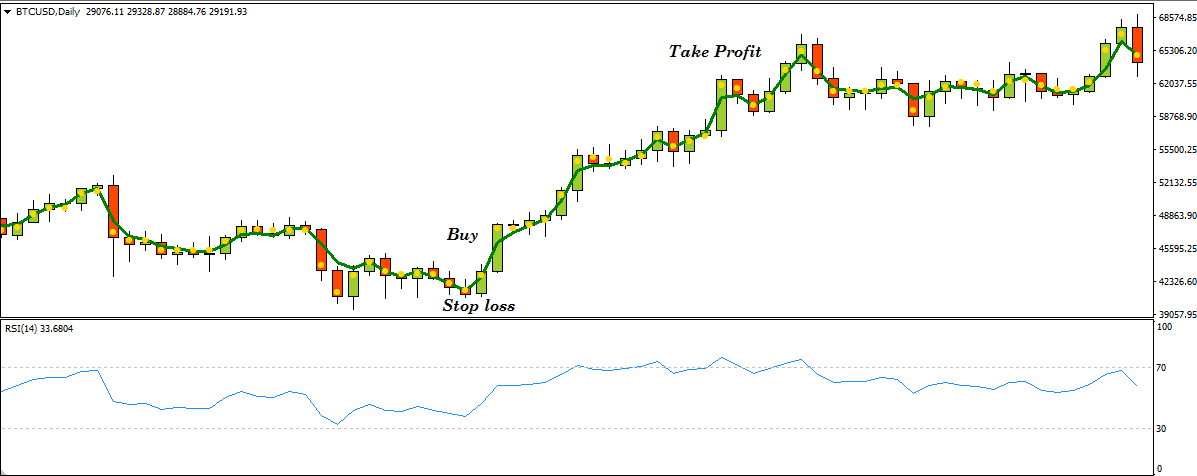
Bullish setup
Entry
Match these conditions above and open a buy position.
Stop loss
The initial stop loss will be below the current bullish momentum.
Take profit
Close the buy order when:
- The NRMA golden dots switch above price candles.
- The RSI dynamic line reaches the upper (70) level or declines after getting that level.
Bearish trade scenario
Set both indicators and observe the readings below:
- The MA line of the NRMA indicator starts sloping on the downside.
- NRMA golden dots take place above price candles.
- The RSI dynamic line remains near the mid (50) level and heads on the downside.
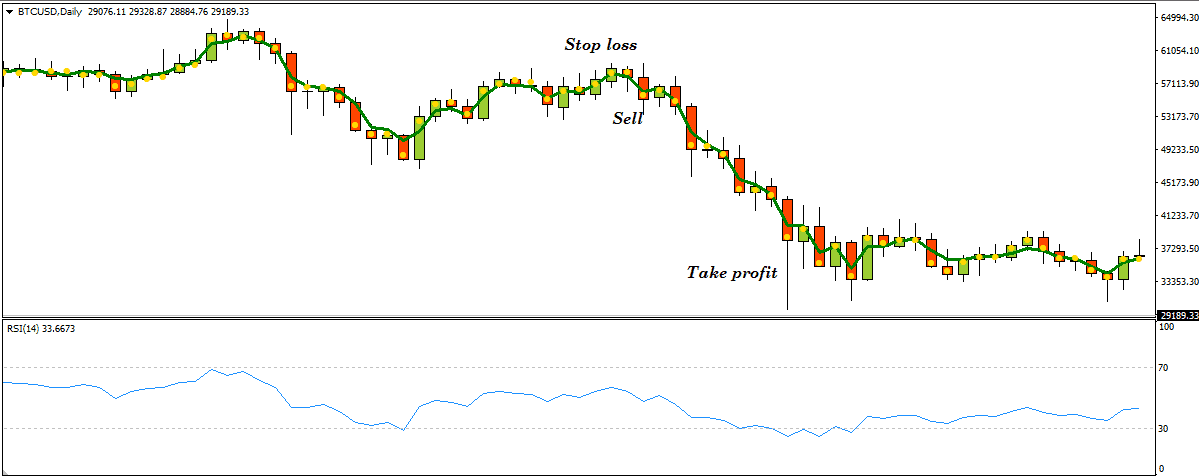
Bearish setup
Entry
Match these conditions above and open a sell position.
Stop loss
The initial stop loss will be above the current bearish momentum.
Take profit
Close the sell order when:
- The NRMA golden dots switch below price candles.
- The RSI dynamic line reaches the lower (30) level or rises after getting that level.
Pros and cons
| Pros | Cons |
|
|
|
|
|
|
Final thought
Finally, this article introduces you to one of the most powerful technical indicators in the financial market. This indicator can generate constant profitable trade ideas on crypto assets.


Comments