Bollinger Bands indicator is one of the best and most popular. This indicator is the real value in the hands of an experienced trader. A vast number of trading strategies and systems are based on it. But most traders don’t know how to use it effectively.
This article will go through this classic technical analysis indicator and tell you how to use and understand it correctly.
What is the Bollinger Bands indicator?
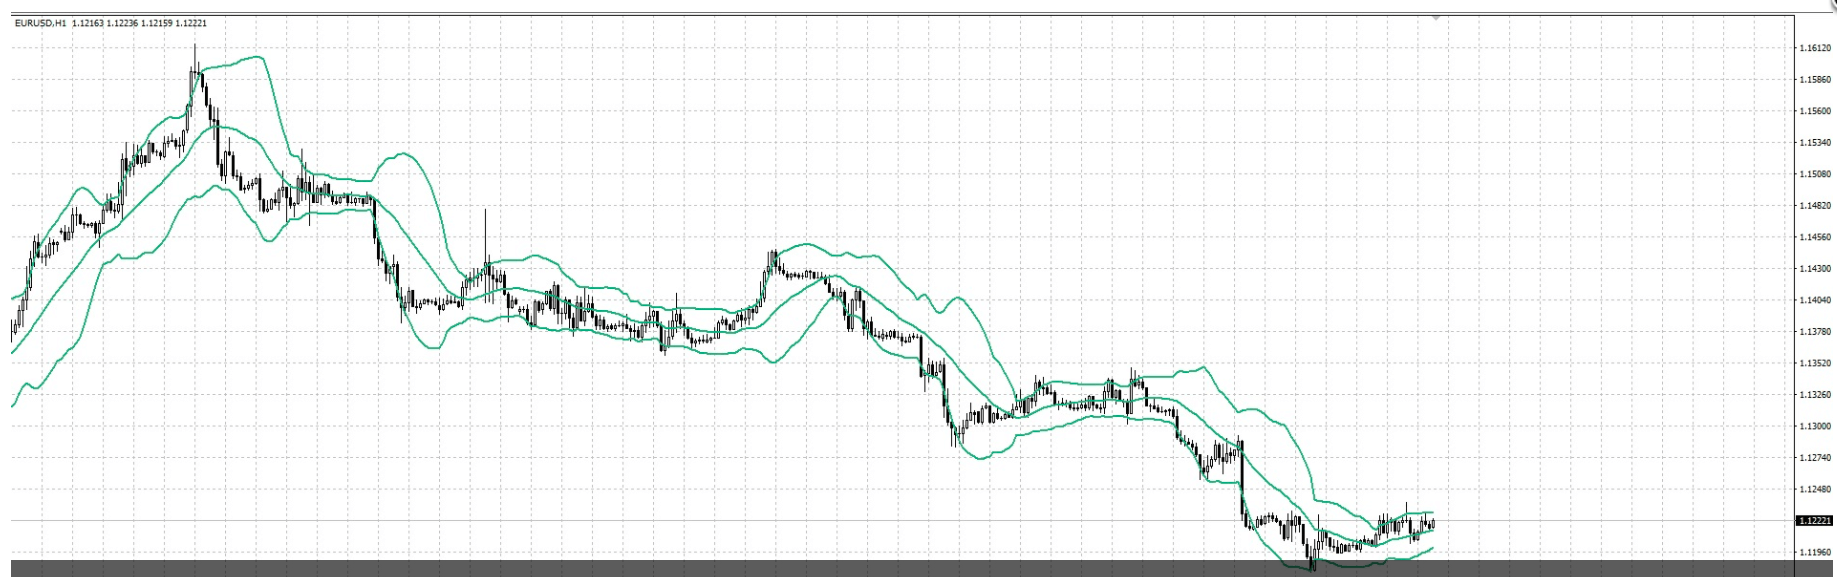
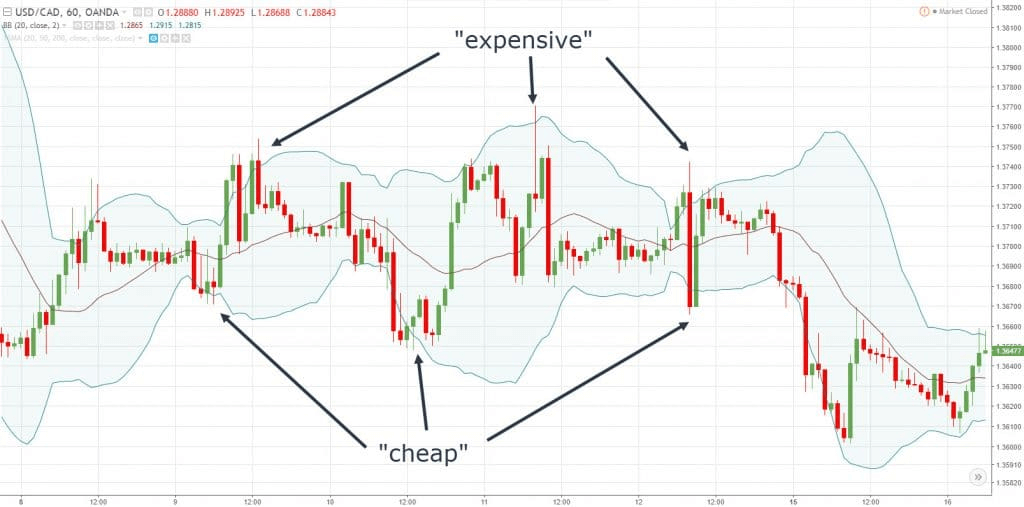
Bollinger Bands are two lines that limit price movements from above and below. These are support and resistance lines located at levels far from the price most of the time.
The basic rule when drawing Bollinger lines is that about 5% of prices should be outside these lines, and 95% should be inside.
When there is a lot of volatility in the market, for example, during a news release, the band widens. When the market is calm, it narrows.
How are the Bollinger Bands formed?
They are formed from three lines:
- The top line is the middle strip shifted up by a certain number of standard deviations (D).
Top line = CL + (D * StdDev)
- The central line is a moving average.
Central line = SUM (CLOSE, N) / N = SMA (CLOSE, N)
- The bottom line is the middle strip shifted down by the same number of standard deviations.
Bottom line = CL – (D * StdDev)
Here:
SUM over N — the number of periods used for the calculation
CLOSE is the closing price
SMA is the simple moving average
SQRT is the square root
StdDev is the standard deviation
StdDev = SQRT (SUM ((CLOSE — SMA (CLOSE, N)) ^ 2, N) / N)
To calculate the band boundaries it is recommended to use from 14 to 24-period SMA as the centerline and from 2 to 5 standard deviations.
The history of Bollinger Bands indicator
Perry Kaufman first described this indicator in 1987 in his book The New Commodity Trading Systems and Methods. The method became widespread thanks to the American technical analyst from California and the author of this indicator John Bollinger.
From 1984 to 1991, J. Bollinger developed his system of rational and efficient analysis. His book Bollinger on Bollinger Bands is a detailed guide to using this tool individually and in conjunction with other indicators. In 1996, he was recognized as the best software developer for financial analysis.
Bollinger Bands have the following standard settings:
-
Period
An increase in the period and deviation will affect the indicator’s sensitivity, and a decrease will affect the performance — many false signals will appear.
-
Shift
It is best to leave the shift as standard, i.e., equal to 0. Traders sometimes use a change of 1. This does not affect the overall picture, but the indicator does not redraw above and below the emerging candlestick.
-
Price
To build BB, most often, traders use closing prices. Traders use the indicator when plotting the prices at which the candle closed.
-
Timeframes
The indicator works excellent on all timeframes, but different assets can behave differently. Better to select the indicator settings individually.
What is the meaning of the BB indicator?
Determine sharp deviations from the average rate of the current trend of the currency pair. If BB is selected correctly, then it’s moving average — the central line is a good support/resistance level. So the BB channel boundaries can serve as targets when opening positions.
Usually, traders plot BBs on the price chart. But they can also be applied to any indicator displayed in a separate window, for example, an oscillator.
If the BB moves up, the price bounces until some powerful enough force stops the price movement. A stagnation zone forms below the upper or above the lower Bollinger Bands. The state of stagnation may continue until the Bollinger market reverses and starts to open, moving away from the price bar. This will indicate that the resistance is being overcome.
The price can shoot in the direction of the current trend and stick to the Bollinger Band. But keep in mind that the final price movement depends on all support/resistance levels, not just those associated with the BB.
Bollinger Bands application methods
The developer himself notes the following features of BB:
- Sharp price changes usually occur after a narrowing band corresponding to a decrease in volatility.
- If prices go beyond the band, wait for the current trend.
- If peaks and troughs follow peaks and troughs outside the band within the band, a trend reversal is possible.
- A price movement that started from one of the band boundaries reaches the opposite border. The latter observation helps predict price targets.
Let’s check some examples.
The exit of prices beyond the boundaries of BB
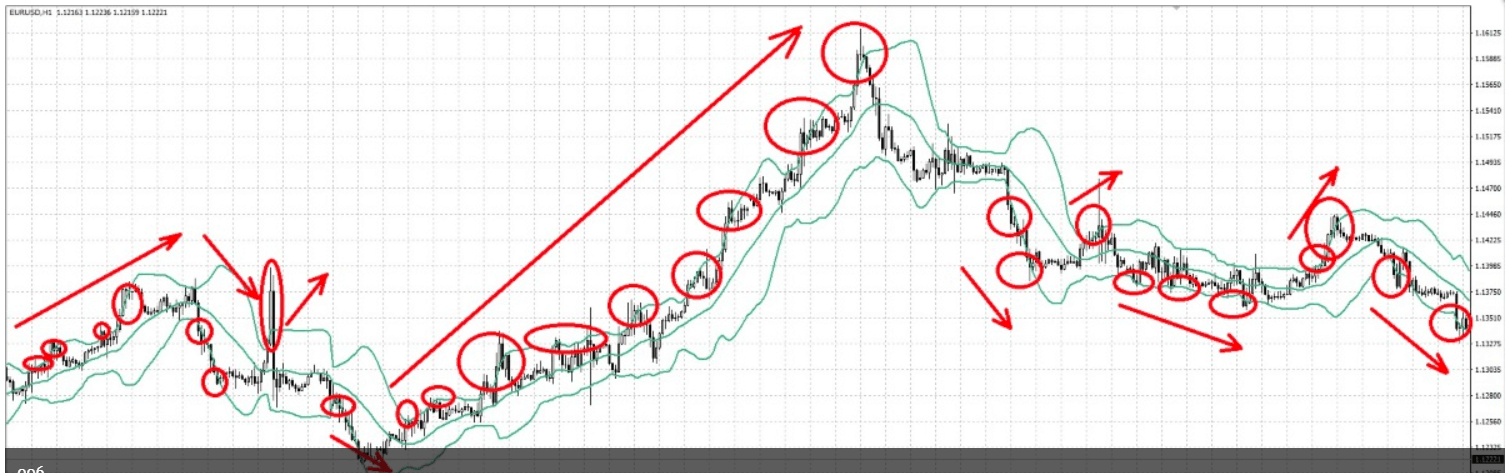
As a rule, going beyond the BB boundary means the beginning or the continuation of the trend. This is how you can judge the market’s direction — as long as prices touch and break through the upper border. The trend is upward. While prices break through the lower barrier — the movement is a downtrend.
Sometimes going beyond the Bollinger line means false breakout. That is when prices tried a new level and immediately returned. There is an opportunity to work against the trend, but you need to evaluate whether the breakout is false.
Price rebound from the middle line BB and its intersection
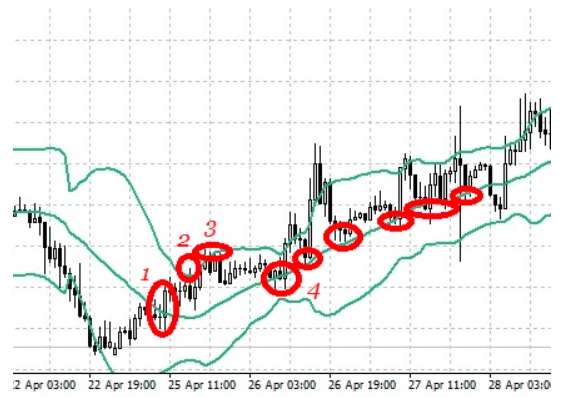
Correct selection of the indicator period turns the BB middle line into a dynamic support/resistance level that works excellent on a confirmed trend.
Crossing the middle line of an indicator often means a trend change.
- At point 1 — the trend crossed.
- At point 2 — the trend has changed, and there is confirmation of this. Prices touched the upper border of the indicator.
- At point 3 — prices again felt the upper frame.
- At point 4 — prices touched the middle line.
Confirmation of the point by candlestick formations, other indicators, or graphical analysis provides a reliable entry point towards a new trend.
The slope of the indicator and the location of the price relative to the BB lines
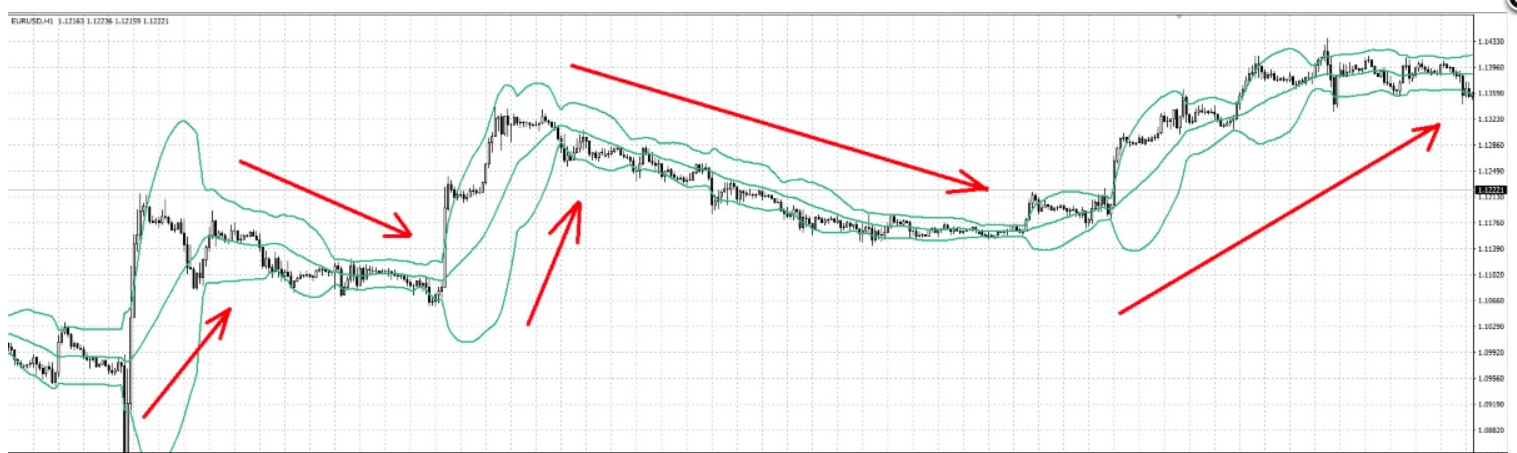
By the slope of the Bollinger Band and the price relative to the middle line, the trader can judge the current direction of the trend.
If BB tilts upwards, the trend is up. When BB leans down, the movement is a downtrend. If prices are above the centerline, we can talk about an uptrend.
Recognizing patterns with BB
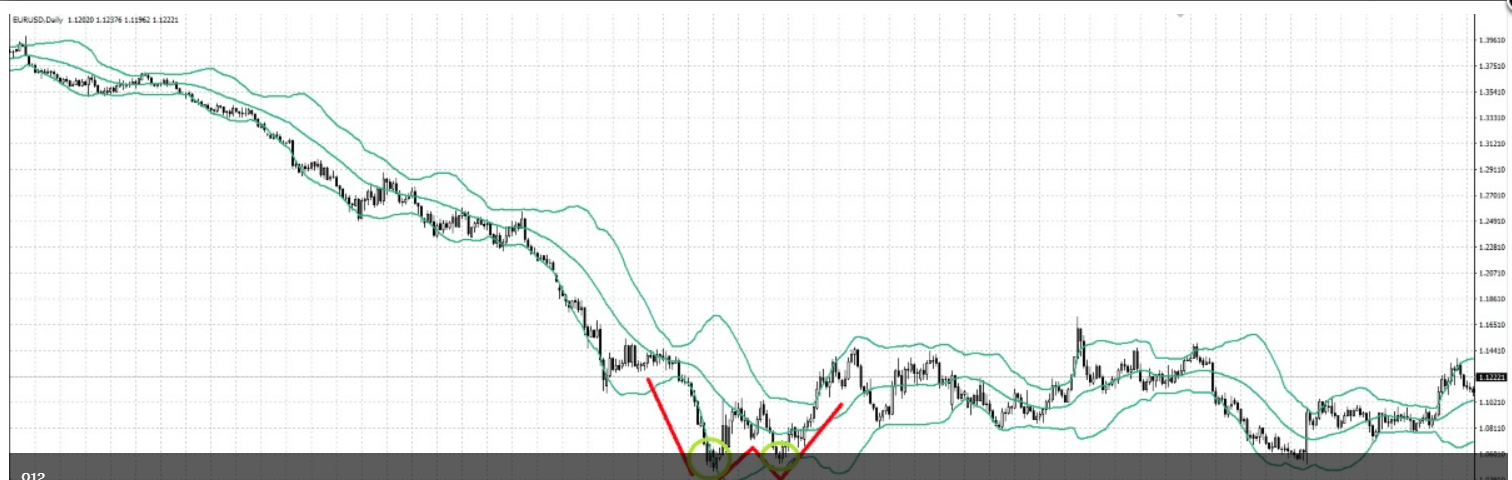
Take the double bottom pattern, which consists of a decline to a low followed by a recovery and a drop to the previous low. After that, a reversal occurs, accompanied by an increase or at least the completion of the last trend.
If the first low is below the lower band, and the second low is at or above the lower bar, we have an interesting setup — divergence. Here, the second low is relatively above the first, regardless of their absolute price levels.
Add confirmation and discipline here, and you have a valuable trading tool.
Conclusion
If you use moving averages in your trading, you need to consider the option of your trading system using such a multifunctional indicator as Bollinger. If you haven’t come across any moving averages or BB before, we recommend that you try the options for using it outlined in this article — they are at least worth considering.


Comments