
The financial market leaves footprints through candle formations. Each candle contains various market data during any specific period, so no wonder traders follow candle formations to seek potential trading positions. The 3 black crows pattern is familiar to financial traders and investors as they often make trade decisions using it.
However, when you seek to make trades using any multi candle pattern, it requires understanding the complete formation to execute trades. This article will introduce you to the 3 black crows’ patterns. Additionally, we describe trading strategies using this pattern, besides listing the top pros and cons.
What is the 3 black crows’ pattern?
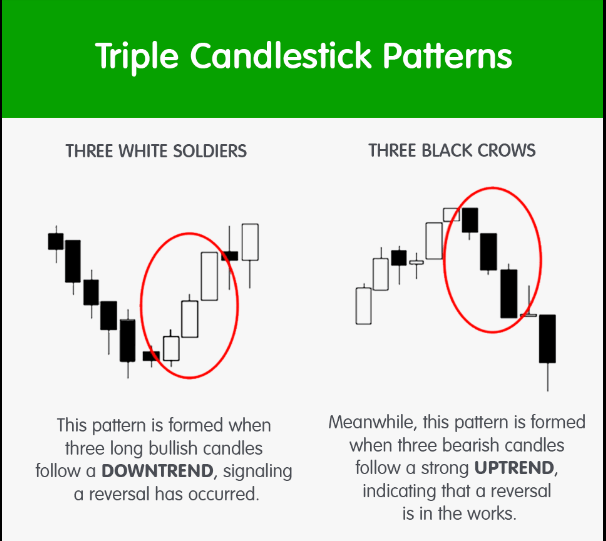
It is a multi candle formation that includes 3 bearish candles, signaling a possible declining price movement on any trading asset. This pattern is fully potent when it occurs near any resistance level or the finish line of an uptrend. Its formation is precisely the opposite of the 3 white soldiers’ pattern.
Multi candle patterns
- The first candle of this pattern is bearish after a bullish trend, so the closing of the candle will be below the opening price.
- The following candle opens near the previous candle’s close, and the closing will be below that.
- The third candle will be similar to the second candle of this pattern.
Historically, this pattern has conditions as no wicks are allowable; every candle will be completely bearish. These days, many ignore those strict facts that cause 3 bearish candles to define a fine upcoming bearish price movement.
How to trade using the 3 black crows pattern
The pattern generates trade ideas for any assets. Identifying the pattern is so simple and easy.
Trade idea
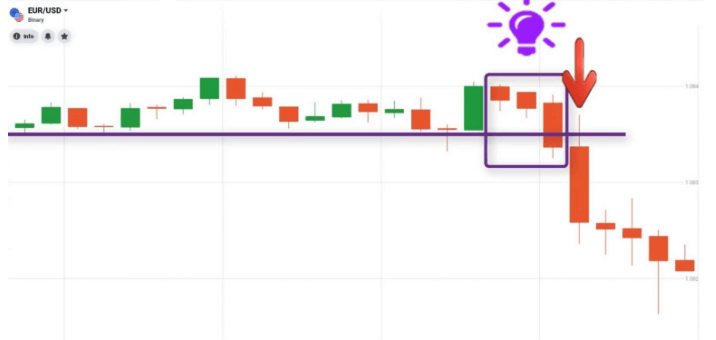
You already know the pattern is most potent near any resistance level. So when you decide to trade using this pattern, mark it near resistance level and combine it with other technical market contexts to determine accurate entry/exit positions or create complete strategies.
For example, you mark the 3 black crow near any resistance level, and the price may break below near-term support during the pattern formation. That indicates a declining pressure on the asset price. After breaking that support, you may place a sell order and close that sell order when the price reaches the nearest next support level.
You can use many technical tools and indicators such as the Fibonacci retracement, MACD, ADX, parabolic SAR, MA crossover, RSI, etc., to make successful trading strategies using this pattern.
A short-term trading strategy
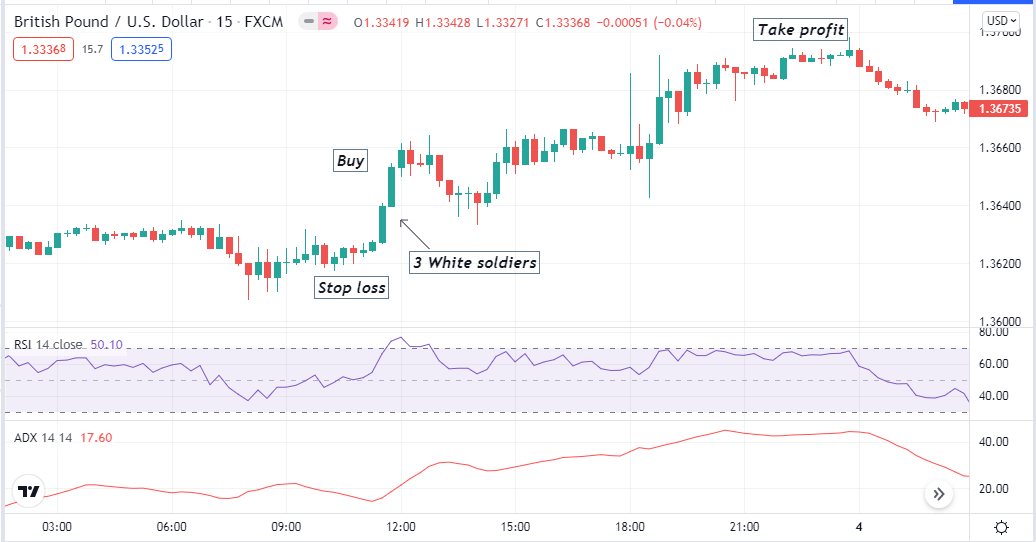
We use 3 candle patterns besides the two most popular technical indicators in this short-term trading method. We use the RSI indicator to identify the trend and the ADX indicator to determine the strength.
Combining these indicators helps to make successful trade executions. Although this strategy suits any time frame chart, we recommend using a 15-min or hourly chart of assets with sufficient volatility to catch the best short-term trading positions.
Bullish trade scenario
- Mark 3 white soldiers’ pattern near any support level and observe the indicators window.
- Seek when the dynamic signal line of the RSI indicator window is at or near the central (50), heading towards the upper (80) line. The ADX value is above 20.
Bullish setup
Entry
These conditions above declare the price may be going to make an uptrend. Place a buy order when these conditions match with your target asset chart.
Stop loss
Place an initial stop loss for your buy order below the recent swing low.
Take profit
Close the buy order when:
- The dynamic signal line of the RSI indicator window comes back to the central (50) line after reaching the upper (80) level or above.
- The ADX value drops below 20.
Bearish trade scenario
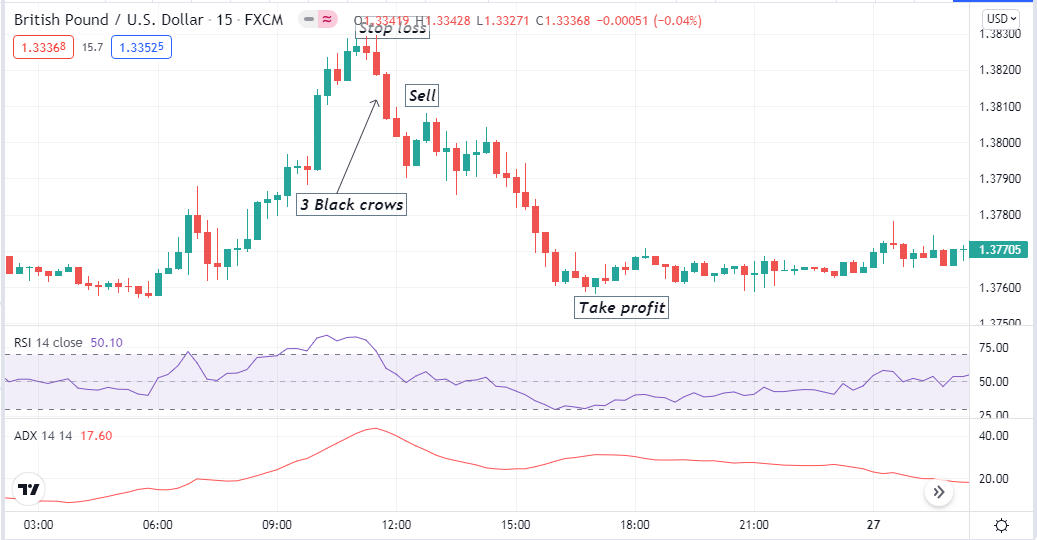
Mark 3 black crows patterns near any support level and observe the indicators window.
Seek when:
- The dynamic signal line of the RSI indicator window is at or near the central (50), heading towards the lower (20) line.
- The ADX value is above 20.
Bearish setup
Entry
These conditions above declare the price may be going to make a downtrend. Place a sell order when these conditions match with your target asset chart.
Stop loss
Place an initial stop loss for your sell order above the recent swing high.
Take profit
Close the sell order when:
- The dynamic signal line of the RSI indicator window comes back to the central (50) line after reaching the lower (20) level or above.
- The ADX value drops below 20.
A long-term trading strategy
This trading method uses the MACD and the ADX indicator to determine entry/exit positions of trades besides 3 candle patterns. This strategy gives the best results on an H4 or above timeframe chart to catch long-term trading positions.
Bullish trade scenario
Seek buy orders when you mark any 3 white soldiers pattern near the finish line of any downtrend. Observe the indicators window:
- The dynamic blue line crosses the dynamic red line on the upside at the MACD window.
- Green histogram bars take place above the central line on the MACD window.
- The ADX value is above 20.
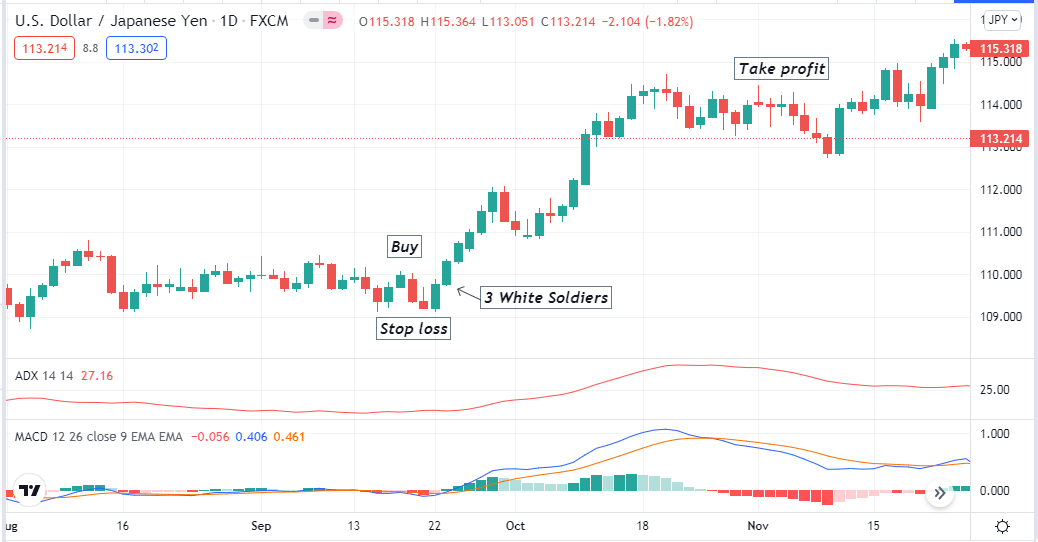
Bullish setup
Entry
Match these conditions above and place a buy order after the current candle closing.
Stop loss
Place an initial stop loss below the recent swing low of the pattern formation.
Take profit
Close the buy order when:
- The dynamic blue line crosses below the dynamic red line of the MACD window.
- MACD red histogram bars take place below the central line.
- The ADX value drops below 20.
Bearish trade scenario
Seek sell orders when you mark any 3 black crows patterns near the finish line of an uptrend. Observe the indicators window:
- The dynamic blue line crosses the dynamic red line on the downside at the MACD window.
- Red histogram bars take place below the central line on the MACD window.
- The ADX value is above 20.
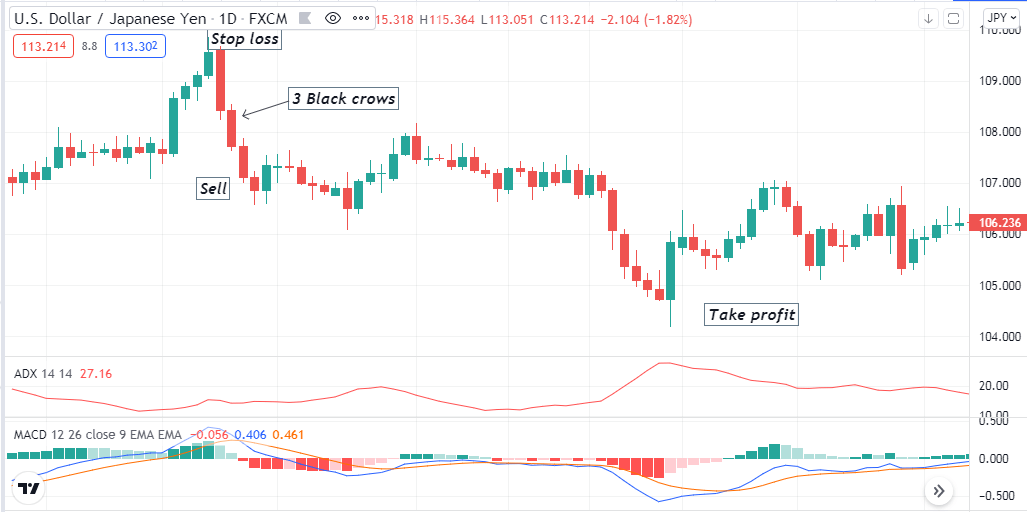
Bearish setup
Entry
Match these conditions above and place a sell order after the current candle closing.
Stop loss
Place an initial stop loss above the recent swing high of the pattern formation.
Take profit
Close the sell order when:
- The dynamic blue line crosses above the dynamic red line of the MACD window.
- MACD green histogram bars take place above the central line.
- The ADX value drops below 20.
Pros and cons
| 👍 Pros | 👎 Cons |
|
|
|
|
|
|
Final thought
Finally, the 3 black crows pattern is typical in the forex market. Successful forex traders have been following this pattern with many other candlestick patterns to make their trade decisions. You can master the concept and execute constant successful trades using this pattern with some practice.


Comments