Many traders are using indicators to create potentially profitable trading strategies. Using technical indicators for trading enables financial traders to manage risks and increases chances to catch more absolute trading positions with entry/exit points. The average directional movement index or ADX is among financial investors and traders’ most popular technical indicators.
However, several indicators involve different calculations to determine the market context in various ways and generate trade ideas depending on those calculations. This article contains descriptions of the ADX indicator and trading strategies with chart attachments, besides listing the top pros and cons.
What is the ADX indicator?
It is a technical indicator to determine the current trend’s strength. Meanwhile, it also identifies the trend changing force of price movements through two other direction identifier lines DI+ and DI-. DI+ declares the buoyant force on asset price, and DI- represents the opposing force. Meanwhile, a crossover between these two lines declares uptrends or downtrends, so this indicator determines the trading asset’s momentum, trend direction, and strength.
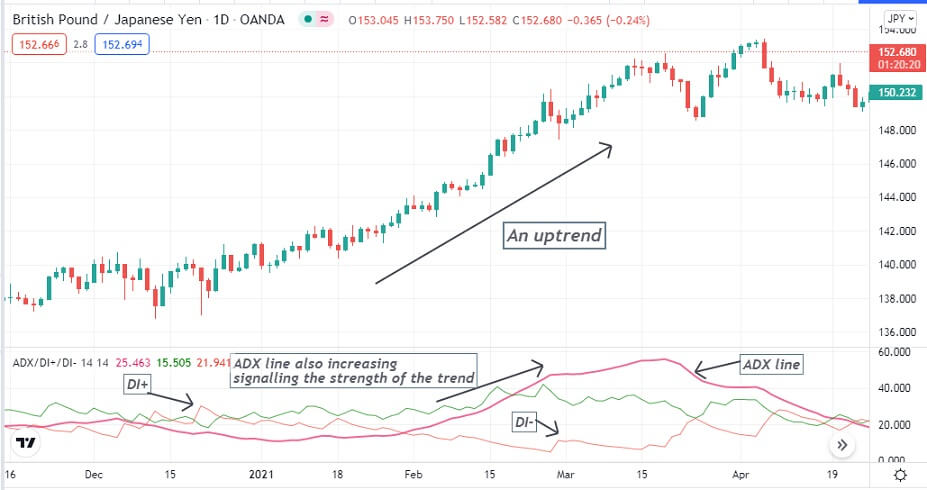
The ADX indicator on GBP/JPY daily chart
The developer of this trading indicator was J. Welles Wilder in 1978. The ADX line uses period 14 and measures the current trend’s strength between the range of 0-100. When the ADX line is above 20, it indicates a sufficient strength of the current trend, either bullish or bearish and continues upward as the strength increases.
Many consider the ADX value 25 or above the adequate pressure of buyers or sellers to make their trade decisions. The ADX value over 40 declares a trendy solid movement on the asset price. Remember, no “magical number” or theory will always work in the forex market.
How to trade with the ADX indicator?
It is so easy when you know the functionality. You can trade any trading asset with this indicator, and it works fine on any timeframe chart. You can make trades through this indicator or combine other technical or fundamental data to make trade decisions.
When the ADX reading is above 20, observe the DI+ and DI- lines. If the DI+ line or green line crosses the DI- or red line on the upside, the buyers dominate at the asset price and vice versa when the opposite crossover occurs between these two lines.
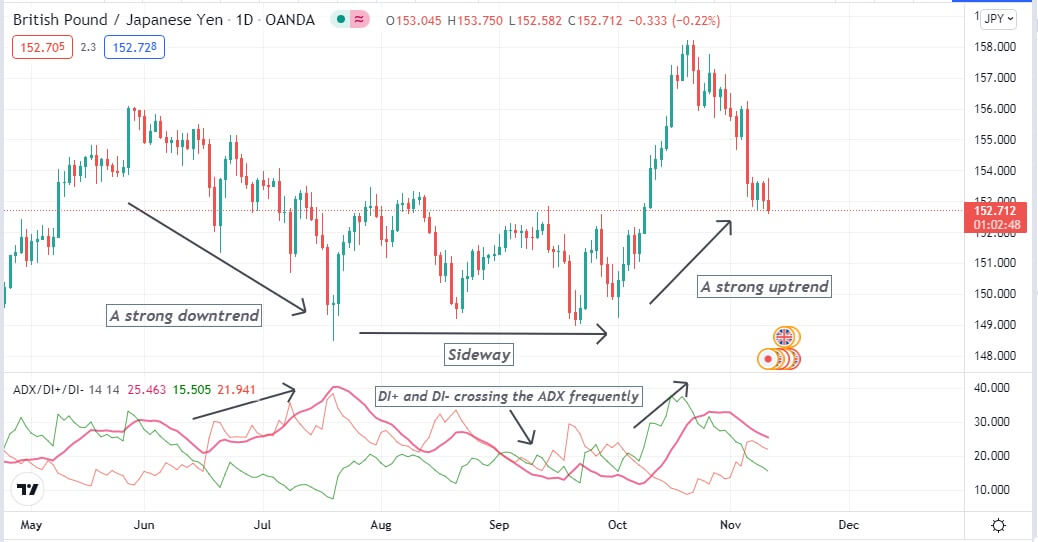
Different trends through the ADX indicator
So what if the ADX is sloping at the downside?
When the ADX line is sloping to the downside, it means the trend is weakening; it doesn’t mean a reversal is coming. The current trend can continue further. If the market remains on a sideway, avoid entering trades using this indicator. It declares sideways when DI+ and DI- lines frequently cross the ADX line above or below.
A short-term trading method
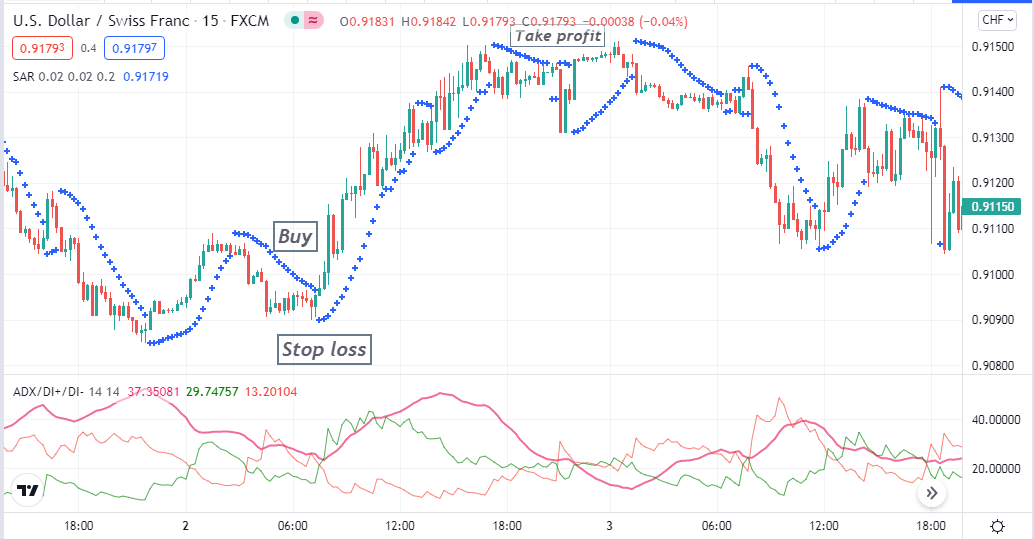
We use the parabolic SAR besides the ADX indicator in our short-term trading method. Parabolic SAR creates dots above or below price candles after the price movement makes any valid high or low. It is a helpful indicator to determine trends. When the price movement shifts to bullish, this Parabolic SAR dot appears below price candles.
Inversely when the price movement changes to bearish, the Parabolic SAR dots start appearing above price candles. This trading method is suitable on any timeframe chart; we recommend using a 15-min chart to seek potential short-term trading positions through this strategy.
Bullish trade scenario
Observe the chart and check:
- The parabolic SAR dot takes place below price candles.
- The ADX value is above 20.
- DI+ (green) line crosses the DI- (red) line on the upside.
Bullish setup
Entry
When these conditions above match with your target asset chart, place a buy order.
Stop-loss
This level will be below the current swing low with a buffer of 5-10pips.
Take profit
Close the buy position when at least two of these conditions match with your chart:
- The ADX value is below 20.
- Parabolic SAR dot takes place above price candles.
- DI+ line crosses DI- line on the downside.
Bearish trade scenario
Observe the chart and check:
- The parabolic SAR dot takes place above price candles.
- The ADX value is above 20.
- DI+ (green) line crosses the DI- (red) line on the downside.
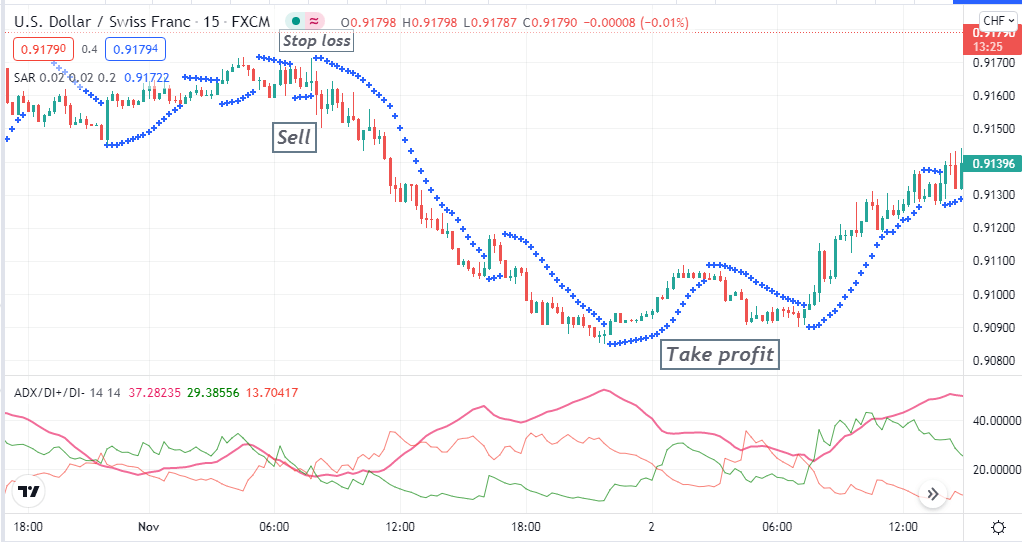
Bearish setup
Entry
When these conditions above match with your target asset chart, place a sell order.
Stop-loss
The stop-loss level will be above the current swing high with a buffer of 5-10pips.
Take profit
Close the sell position when at least two of these conditions match with your chart:
- The ADX value is below 20.
- Parabolic SAR dot takes place below price candles.
- DI+ line crosses DI- line on the upside.
A long-term trading strategy
Our long-term trading technique involves using support resistance levels beside the ADX indicator for more efficient trading positions. This trading method works fine on any timeframe chart. We recommend using an H4 or above chart to avoid fake swing high/low of lower time frame charts.
Bullish trade scenario
When price breaks above any dynamic or statistic resistance, check the ADX window:
- The ADX value is above 20.
- The DI+ (green) line crosses the DI- (red) line on the upside.
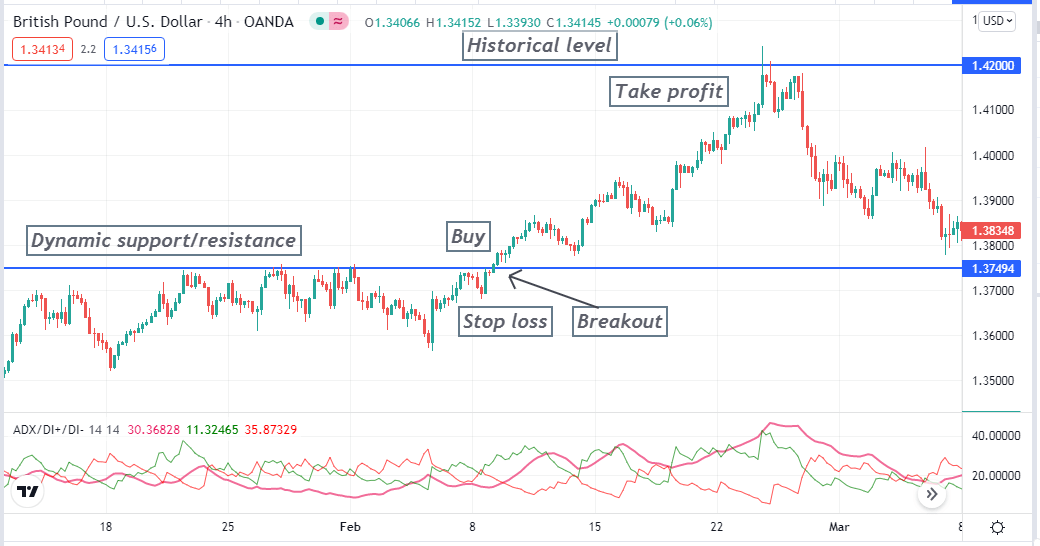
Bullish setup
Entry
When these conditions above match with your target asset chart, place a buy order.
Stop-loss
Set initial stop-loss for your buy order below the breakout or support resistance level.
Take profit
The first profit target will be below the next support resistance level. You can continue your buy order if the price breaks above the next support resistance. Otherwise, exit from the buy position when:
- ADX value is lower than 20.
- The DI+ line crosses the DI- on the downside.
Bearish trade scenario
When price breaks below any dynamic or statistic resistance, check the ADX window:
- The ADX value is above 20.
- The DI- (red) line crosses the DI+ (green) line on the upside.
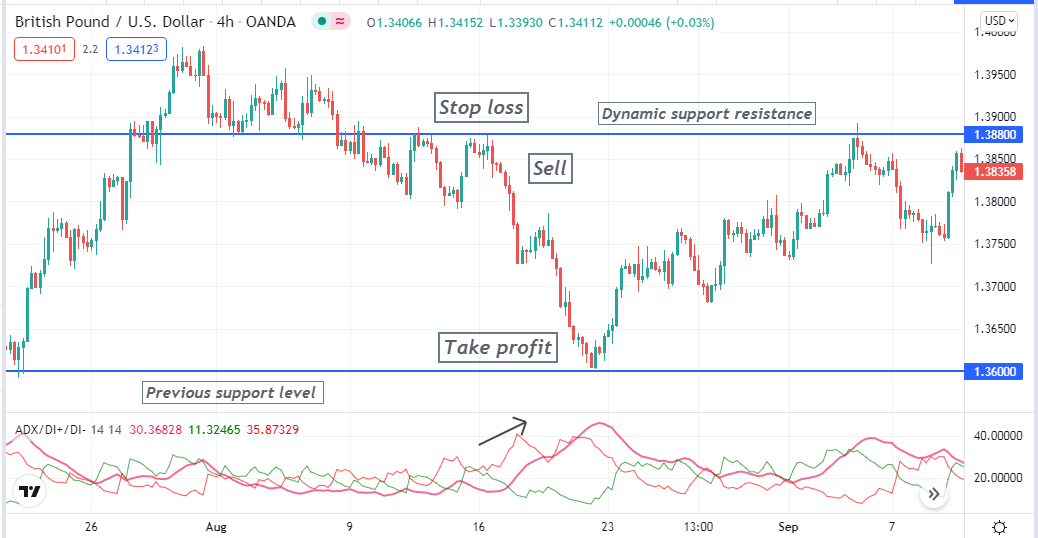
Bearish setup
Entry
When these conditions above match with your target asset chart, place a sell order.
Stop-loss
Set it for your sell order above the breakout or support resistance level.
Take profit
The first profit target will be above the next support resistance level. You can continue your sell order if the price breaks below the next support resistance. Otherwise, exit from the sell position when:
- ADX value is lower than 20.
- The DI+ line crosses the DI- on the upside.
Pros and cons
| 👍 Pros | 👎 Cons |
|
|
|
|
|
|
Final thought
Finally, these are the elemental facts of the ADX indicator. You can make thousands of pips using this indicator and the strategies above. We suggest practicing in demo trading to master the concept before using it on live trading.


Comments