
Market participants often use various technical tools that enable traders to sort out the most accurate and potentially profitable trading positions. A Fibonacci retracement method is such a standard helpful technical tool for newcomers to professional traders.
However, creating complete strategies using the Fibonacci retracement tool involves understanding the concept correctly and knowing appropriate techniques to use it.
This article includes all helpful information about the Fibo retracement tool. Moreover, we describe complete short-term and long-term trading strategies with charts attached. So you learn to use the Fibonacci retracement tool properly in your trading.
What is a Fibonacci trading strategy?
Leonardo Fibonacci is the inventor of this series concept, who was born in 1170 AD. The series is interesting as the summation of two numbers will produce the following number.
So the series is 0, 1, 1, 2, 3, 5, 8, 13, 21, 34, 55, 89, 144 and so on with the sequence. There is also a golden ratio number which is 1.618. This strategy followers consider it as the most amazing part of the author’s work. When you divide any number of the series by the previous number, you will get 1.618, or inverse number 0.618. You can find this ratio around everywhere, such as medical science, architecture, nature, etc.
The Fibonacci series for use as a trading tool has the same phenomena:
- 23.6%
- 38.2%
- 61.8%
- 76.4%
These levels are adequate for pullback or continuation of the trend. There are many indicators you can find that use this series for generating trade ideas. Any strategy that involves the Fibonacci retracement tool is a Fibonacci trading strategy.
Why is a Fibonacci trading strategy worth using?
You can use the Fibo retracement tool in various ways in your trading strategy. You can use this series to find out support-resistance levels, entry, stop loss or setting profit targets, etc.
You can also use this tool as a primary mechanism to create any trading strategy. Every forex exchanger uses this tool at some point in their trading career to find more accurate trading positions. Some may use it for a certain period of their career, while others may use it regularly in their trading.
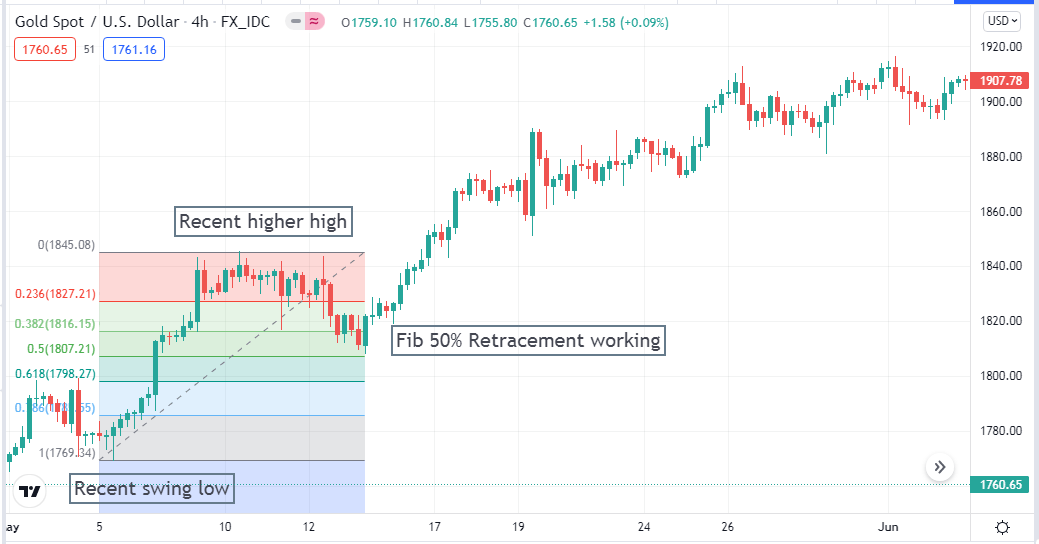
XAU/USD daily chart
However, it doesn’t matter how much time you use this tool; you must use it properly, that’s important. Using this tool, you can find out the zones where prices may pull back or continue to decline. Reaching any zone is not a signal for something to occur; check other confirmation before entering trades.
A short-term strategy
We use a popular technical indicator, Relative strength index (RSI), beside the Fibonacci retracement tool to find short-term trading positions in forex currency pairs. You can get the best results by using this strategy on 1-hour charts. We will confirm the price trend from upper charts such as 4-hours or daily charts and seek trading positions at the hourly charts. Our prior levels are historical support-resistance levels, daily-weekly high-low, opening, and closing prices, etc.
Bullish trade setup
When price movement reaches any support level and makes a higher high, set the Fibo retracement tool. Wait until the price reaches the retracement zone, start to pull back toward the upside, and check the RSI window for more confirmation.
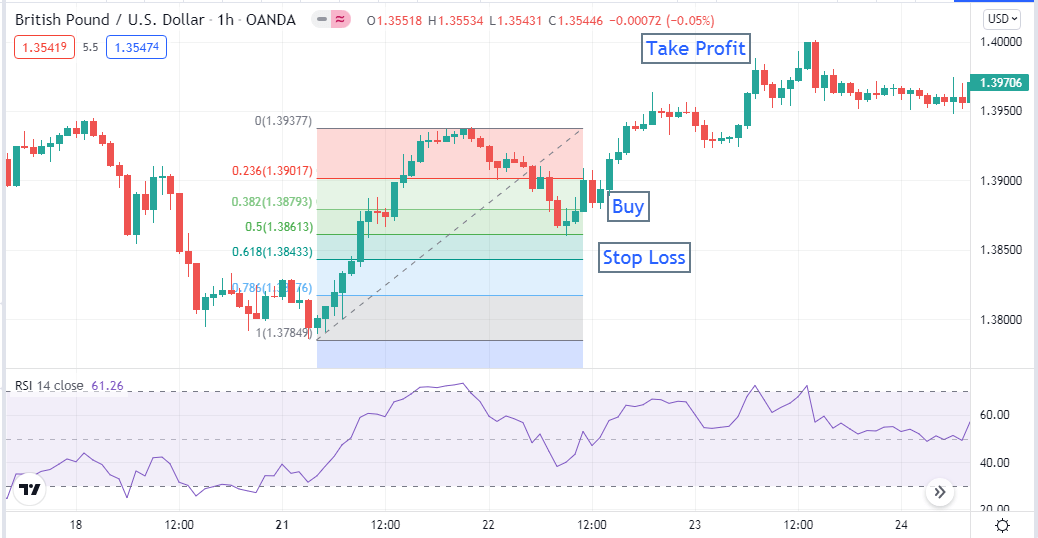
Short-term bullish setup
When the RSI signal line crosses above the middle line and moves toward the upper line, it’s the right place to take a buy order. Put an initial stop loss below the recent swing low with a buffer of 10-12pips. Close the buy position when the RSI signal line starts coming back toward the middle line after reaching the upper line.
Bearish trade setup
When price reaches any resistance level and starts to decline, set the Fibo tool. When the price comes at any significant retracement level, check the RSI window for confirmation.
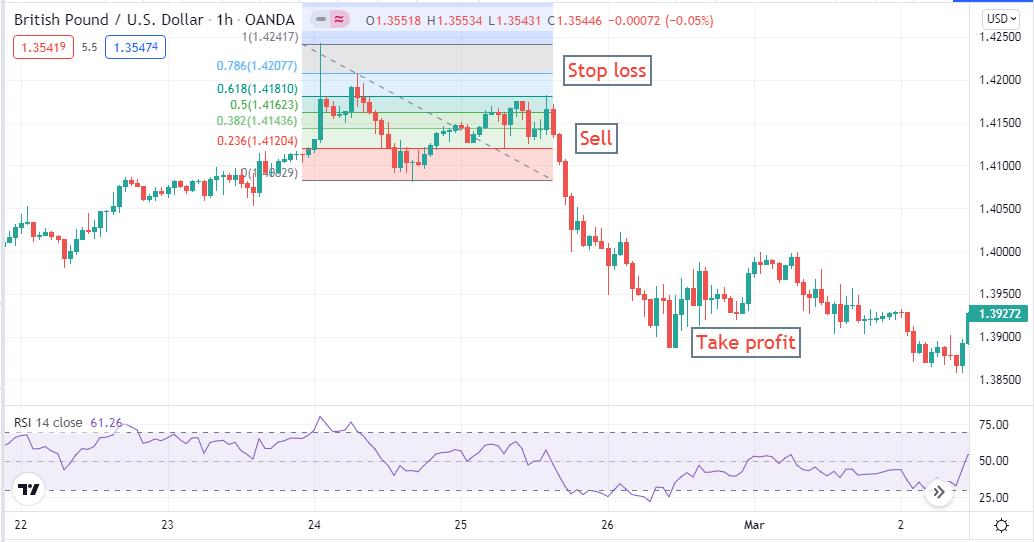
Short-term bearish setup
Place a sell order if the RSI signal line crosses below the middle line and heading toward the lower line. Initial stop loss will be above the recent swing high with a buffer of 10-12pips. Close the sell position when the RSi signal line moves toward the middle line after reaching the lower line.
A long term strategy
In our long-term trading method, we use the MACD indicator beside the Fibonacci retracement tool. This strategy works fine on the daily chart. We find the support-resistance levels depending on historical data, weekly-monthly opening-closing, and high-low. Then set this tool and enter by confirmation of the MACD indicator window.
Bullish trade setup
When the target currency pair reaches any support level and makes a recent low, set the Fibonacci retracement tool — the zero to the current high and the one to the recent low. Observe the price movement at retracement levels; check the MACD window for confirmation when it is working.
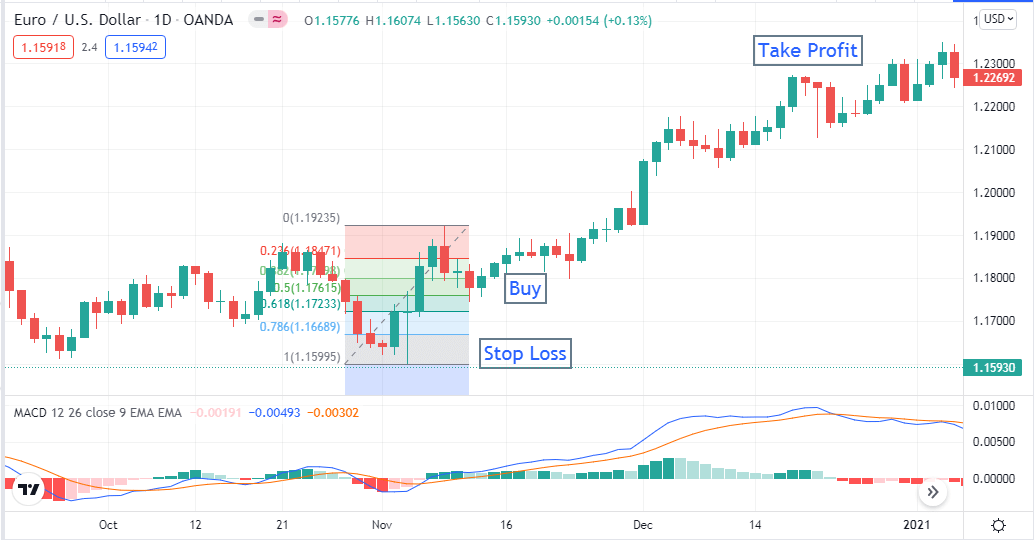
Long-term bullish setup
Enter a buy order when MACD signal lines and histogram bars cross above the middle line of the indicator window. Place stop loss below the recent low which is at the retracement level with a buffer of 10-15pips. Exit from the buy order when MACD histogram bars appear below the middle line or bearish crossover occurs between MACD signal lines.
Bearish trade setup
Price reaches any resistance level and starts to decline. Set the Fibonacci retracement tool at the recent low and high. Set zero at the current low and one at the recent high. When any retracement level starts to work, then check the MACD indicator window for more confirmation.
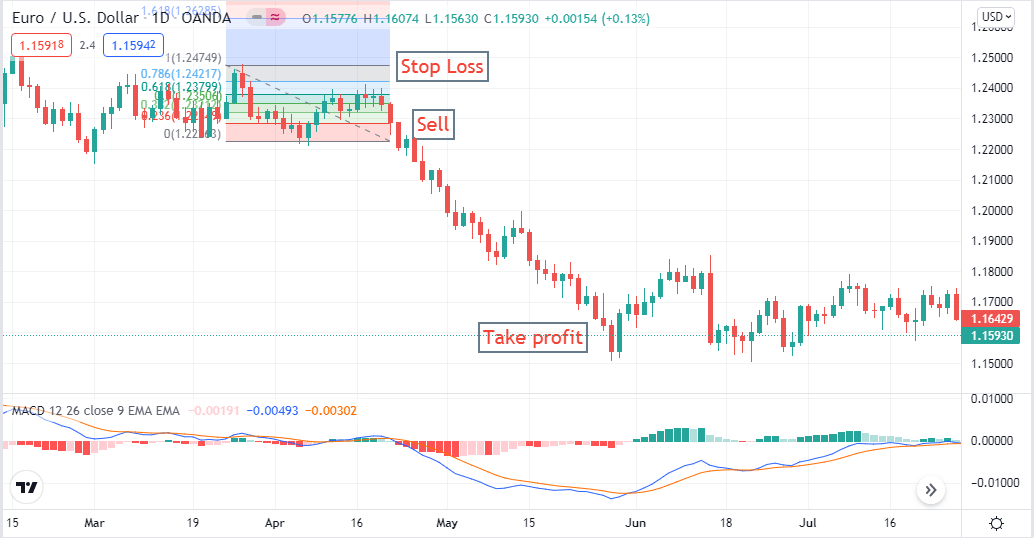
Long-term bearish setup
Place the sell order when MACD histogram bars and signal lines are below the middle line. Put a stop loss above the recent swing high with a buffer of 10-15pips. Close the sell order when the bullish crossover occurs between MACD signal lines or histogram bars appear above the middle line.
Final thought
Finally, using the Fibonacci retracement tool for finding profitable trading positions is common among traders of various financial assets, such as forex, stocks, commodities, etc.
We suggest being careful when setting the Fibonacci retracement tool at the chart and using multi-time frame analysis to avoid fake swing highs and lows.


Comments