The triangle pattern is one of the profitable price action patterns in forex trading that is very effective for most price action traders. However, getting the maximum benefit from a triangle pattern needs additional attention to the market context.
When a trader can distinguish a high probable and low probable triangle pattern, he is ready to make a huge profit from it. If you are confused about the triangle pattern or don’t know anything about it, the following section is for you.
Let’s discuss the nuts and bolts of triangle patterns in the context of short-term and long-term trading.
What is a triangle pattern in forex trading?
It is a stage where bulls and bears become less active in the market. As a result, the price squeezes to a zone rather than making new highs or lows.
In FX trading, institutional traders are the key price driver. They become active in the market when there is an active trading session. Therefore, either bullish or bearish, a sharp move may show in the London or New York trading session. On the other hand, in the Asian to London session, make remains quiet and calm. Therefore, most of the intraday triangle patterns are available in the Asian session.
Meanwhile, fundamental releases work as a key price driver. Therefore, when there are fewer fundamental releases, the market remains corrective. The correctness may lead the price to follow a point by creating a triangle.
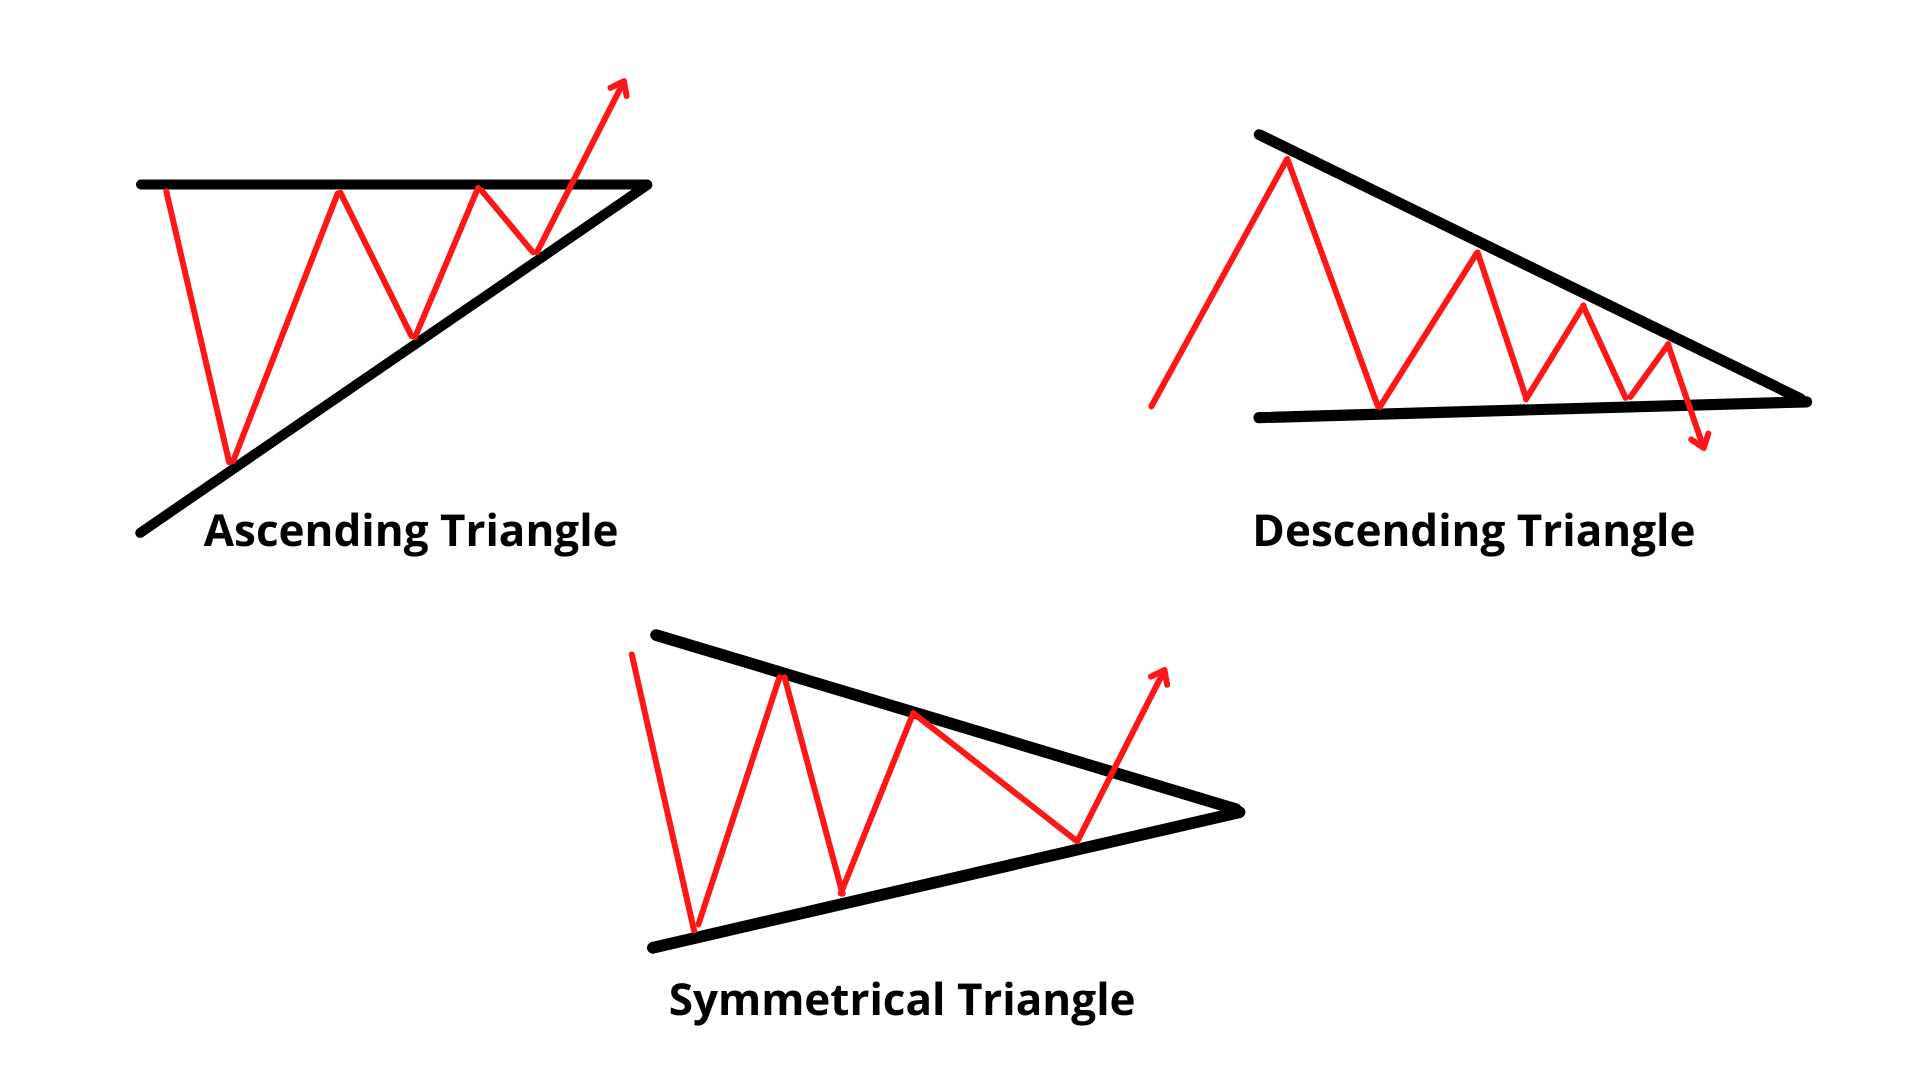
Different types of triangles in a single image
As per the above image, if the price makes lower highs but now higher highs, it is called ascending triangle. The opposite version is the descending triangle where the price does not make any new lower low. On the other hand, the symmetrical triangle happens where both highs and lows move at a certain point.
We can represent the triangle as the following story of the market:
- Ascending — buyers are active, sellers are less active.
- Descending — sellers are active, buyers are less active.
- Symmetrical — both buyers and sellers are losing their momentum.
Why is the triangle pattern strategy worth using?
The triangle patterns represent a correction in the market. So if any triangle breakout happens towards the current market trend, it is more likely to work than triangle patterns towards the counter-trend.
Let’s see an example.
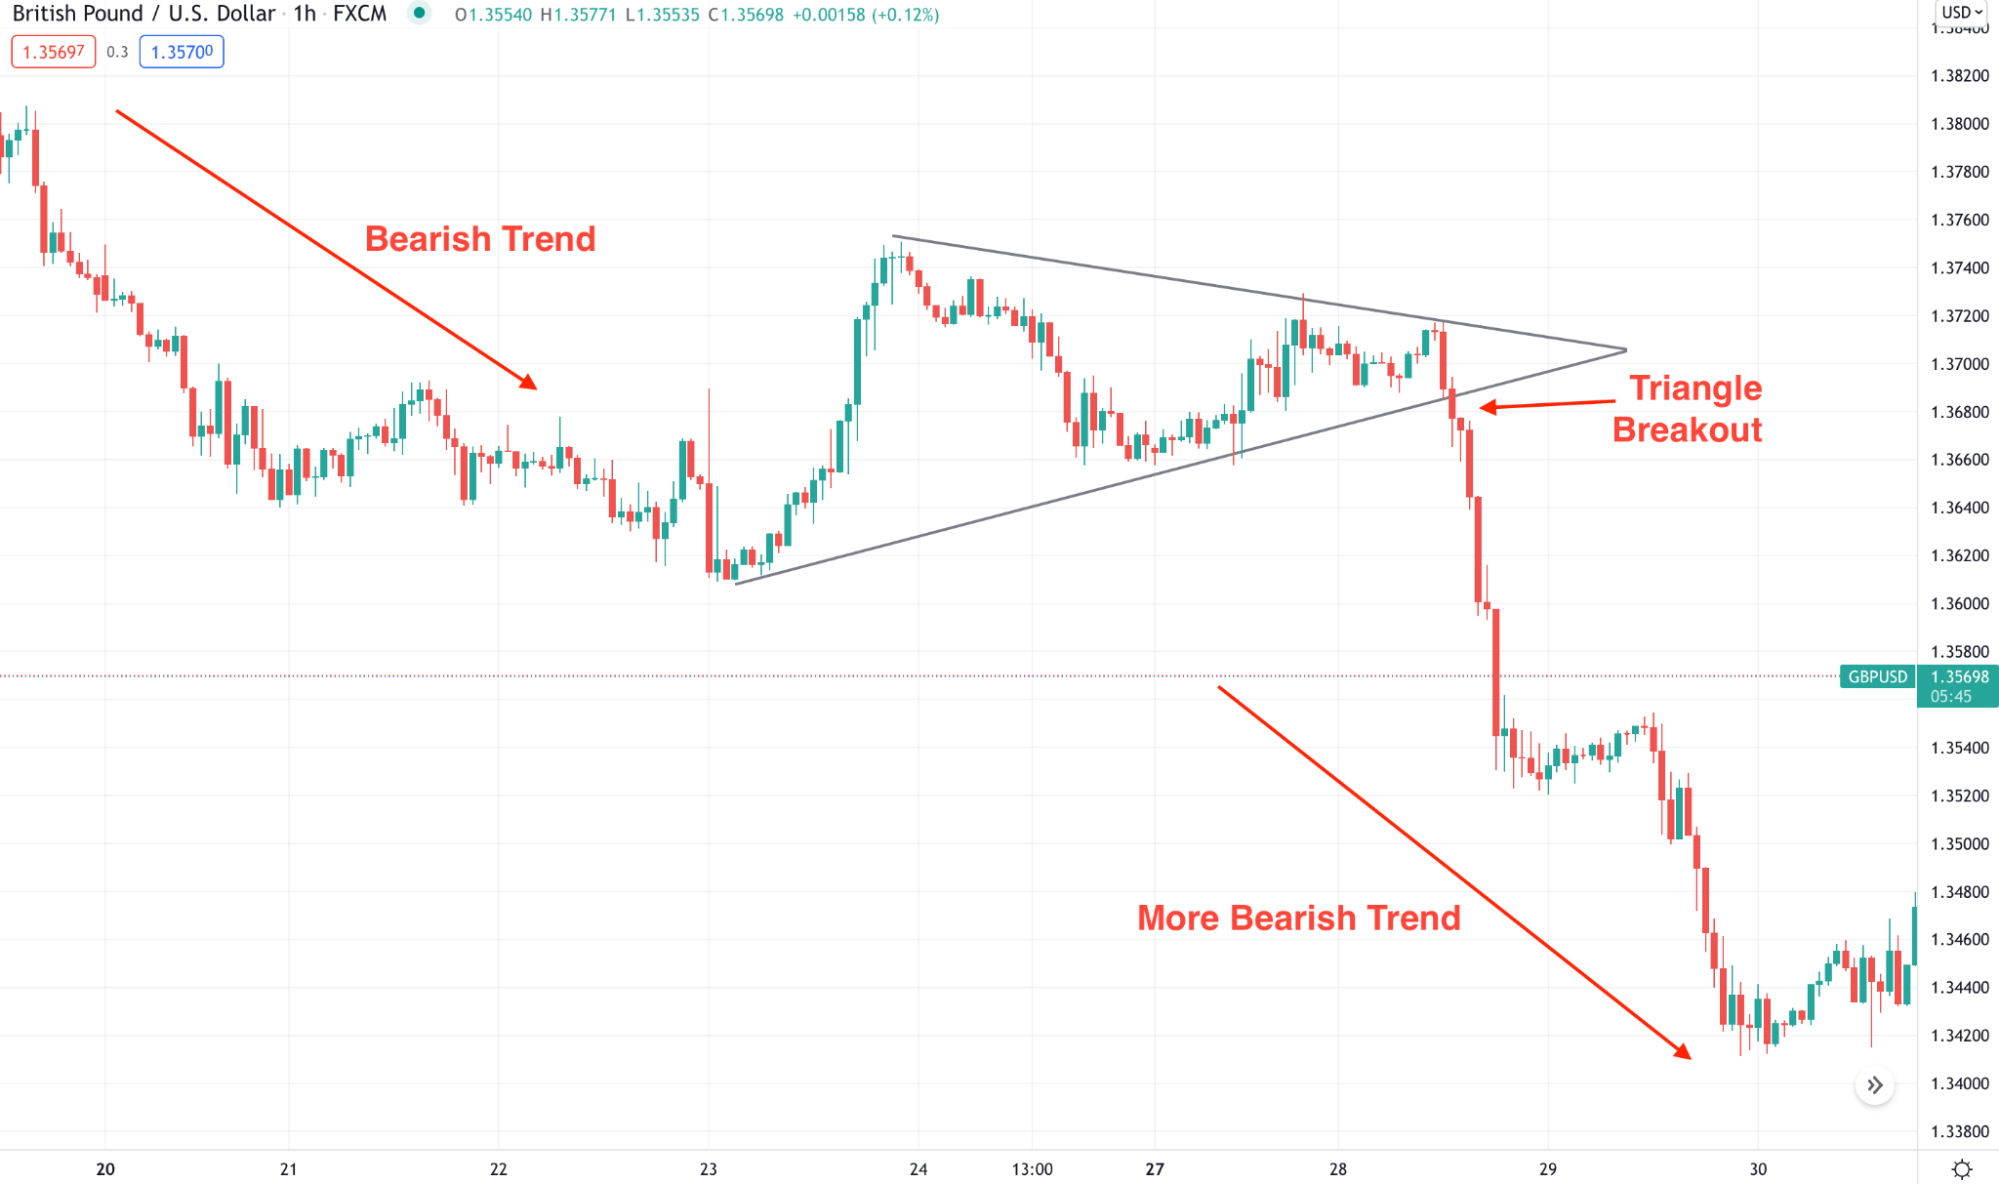
GBP/USD chart
The above image shows the H1 chart of GBP/USD, where the price is moving down. After making some bearish pressure, a triangle pattern formed where the breakout happens towards the trend. Therefore, the price resumed the bearish sentiment.
The most effective factor of the triangle pattern is that it can represent the real story of the market. In an impulse, traders remain active, but the triangle formation indicates that traders are interested in profit-taking before continuing the trend. Therefore, when the pattern completes the formation and a breakout happens, it creates a strong trading opportunity.
A short-term strategy
We aim to catch the intraday market trend in the short-term trading strategy during the active trading session. In that case, we should find where the major trend is moving. If the overall market trend is bullish, we will focus on buy trades only. Similarly, we will only look for a triangle breakout on the downside if the market trend is bearish.
Best time frames to use
The short-term triangle trading is applicable on a time frame from 1 minute to 30 minutes, but we will stick to the 15 minutes chart in this system.
Entry
The aggressive entry is when a candle closes above or below the triangle pattern. However, the best approach is to find a correction and open the trade after a rejection.
Stop loss
The aggressive stop loss is above or below the rejection candle, and the conservative approach is to find the most recent swing high or low and set the SL with some buffer.
Take profit
As it is a trend continuation strategy, you can hold the trade as long as possible. However, do not forget to book some profit when the price faces reversal pressure.
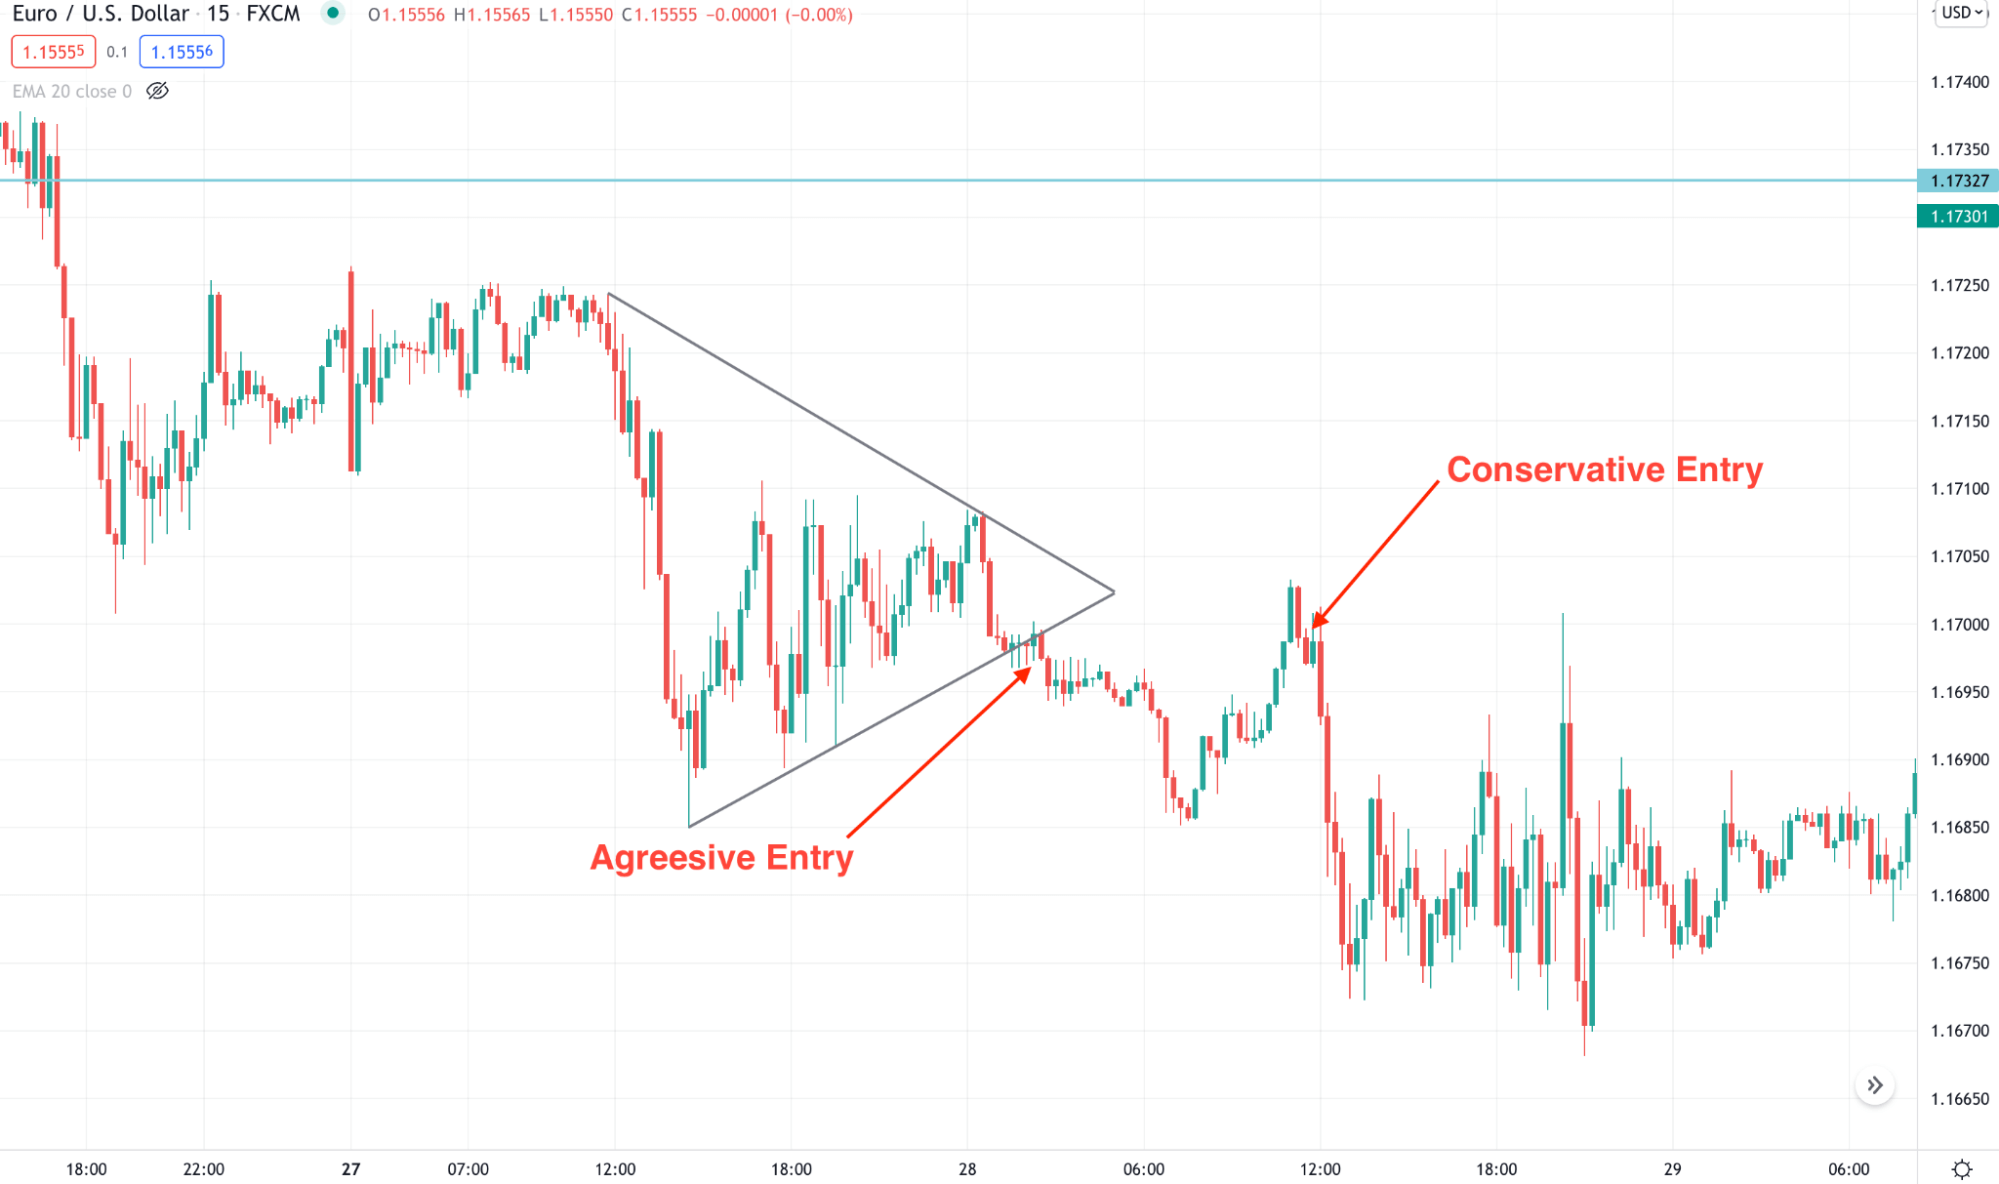
EUR/USD m15 chart
A long-term strategy
The long-term approach moves beyond the intraday market noise and open trade based on what long-term traders are doing. Long-term traders are institutional investors in the FX market, and their activity works well in long-term methods.
Best time frames to use
The ideal time frame for the long-term strategy is the daily chart.
Entry
The aggressive entry is when a daily candle closes above or below the triangle pattern. However, the best approach is to find a correction and open the trade after a rejection.
Stop loss
The aggressive stop loss is above or below the rejection candle, and the conservative approach uses swing levels.
Take profit
As it is a trend continuation strategy, you can hold the trade as long as possible. However, do not forget to book some profit when the price faces reversal pressure.
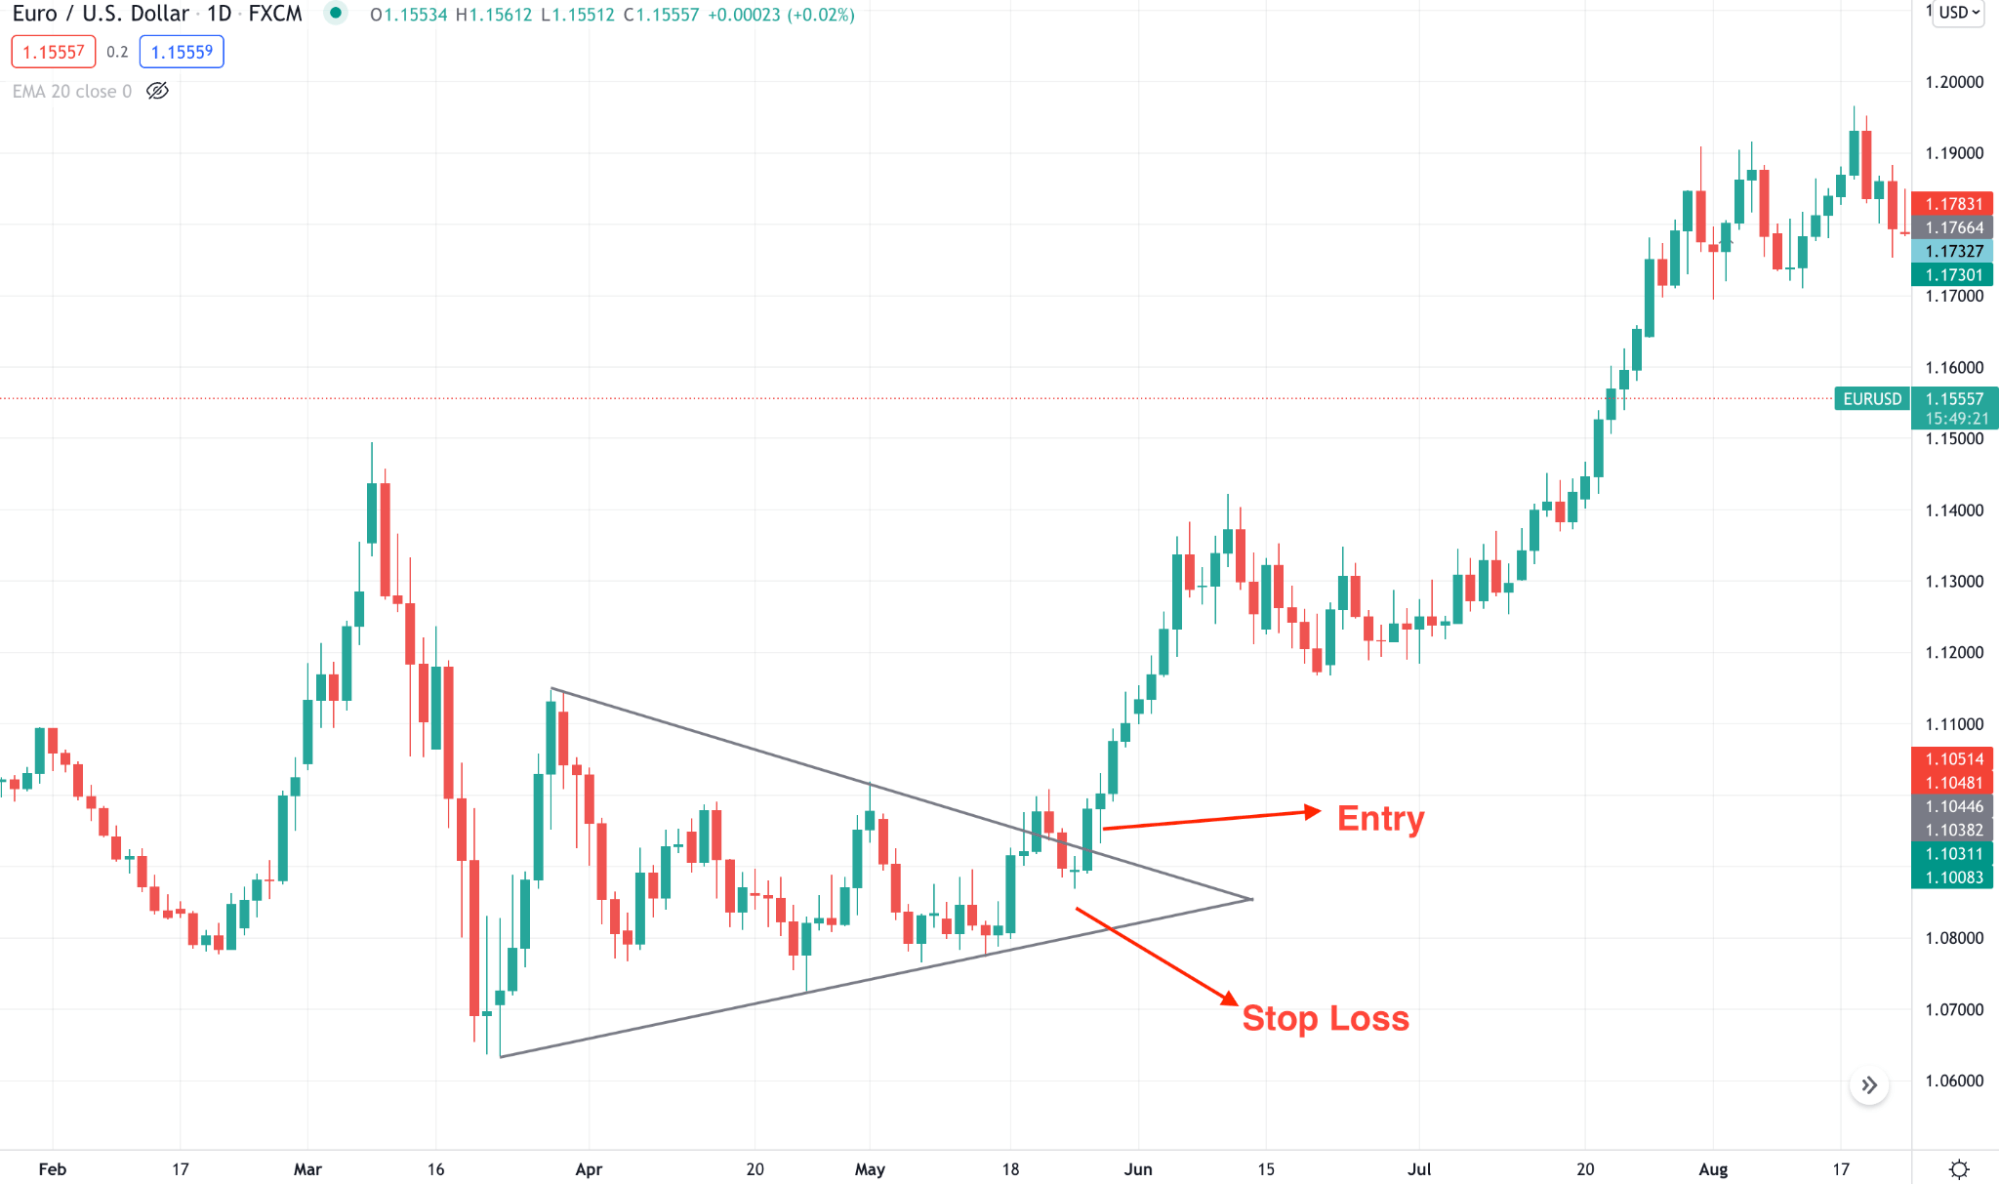
EUR/USD daily chart
Pros and cons of the triangle pattern strategy
Let’s see the pros and cons of this strategy that might help you make a proper trading decision.
Pros |
Cons |
|
|
|
|
|
|
Final thoughts
Finally, we have seen how the triangle pattern works in the FX market, including the short-term and long-term methods to trade this pattern.
Although the triangle pattern is very effective for price action traders, it has some drawbacks that a trader should consider. Moreover, there is no guarantee that the pattern you see in the chart can benefit you.
Therefore, focus on building strong money management and trade management rules so that you can keep your funds safe while trading.


Comments