
There is a vast category of traders worldwide with different trading styles. Some market participants like trend trading, some go against it, few stand by for the break and retest, while a majority wait for the reversal.
Reverse trading is one of the most popular among traders. It does not happen all the time; traders lose a good portion of money by chasing the trade to complete the first part of the reversal. Such trading keeps you ahead of other market participants if done right, and the reason is that you tend to have an opportunity to achieve the best risk-reward.
Trading the reversal setup can be done using either indicators or price action patterns. Now, this part can be overwhelming for many of you reading this. As you might know, there are a lot of reversal patterns in FX. But, there is only one hand full of them that works, and one among them is the head and shoulders pattern.
Understanding reversal pattern
In trading, if any price pattern indicates the price direction changing from bullish to bearish or vice versa is called the reversal pattern.
For example, let’s take you into a price action trader and use chart patterns. By analyzing the chart, you took a long trade in GBP/JPY because the price was making a higher high and a higher low, and you executed the trade when the price took a dip to make a higher low.
Now at this point, you wanted to price to make another higher high, but unfortunately, the price did not break the high and instead formed a lower high and then a lower low. The whole scenario here shows the trend reversal from bullish to bearish.
Head and shoulder pattern: one of the best
We can debate with anyone about this pattern because it works almost all the time. But let’s look at how it works in practice.
In trading
This pattern is a candlestick chart formation with three peaks:
- Left shoulder
- Head
- Right shoulder
They together form the head and shoulder pattern with a baseline or a neckline at the bottom connecting all three peaks.
This reversal pattern has two types:
-
Head and shoulder
It shows the trend change from bullish to bearish and will be formed at the top of the price chart.
-
Inverse head and shoulder
It shows the trend change from bearish to bullish and will be formed at the bottom of the price chart.
Trading the head and shoulder pattern
This pattern is not something that you can find easily on the chart, it is rare, and thus it makes it more accurate. This section will help you understand how to trade it after finding it on the price chart.
- Notice which time frame the pattern is formed; the higher, the better.
- Set your chart to a 4hr time frame and look if this pattern is forming. If the formation is head and shoulder, the trend is bullish, and the price will change the trend to bearish.
- If it is inverse head and shoulder, it will signify the trend was bearish, and the market will reverse to be bullish.
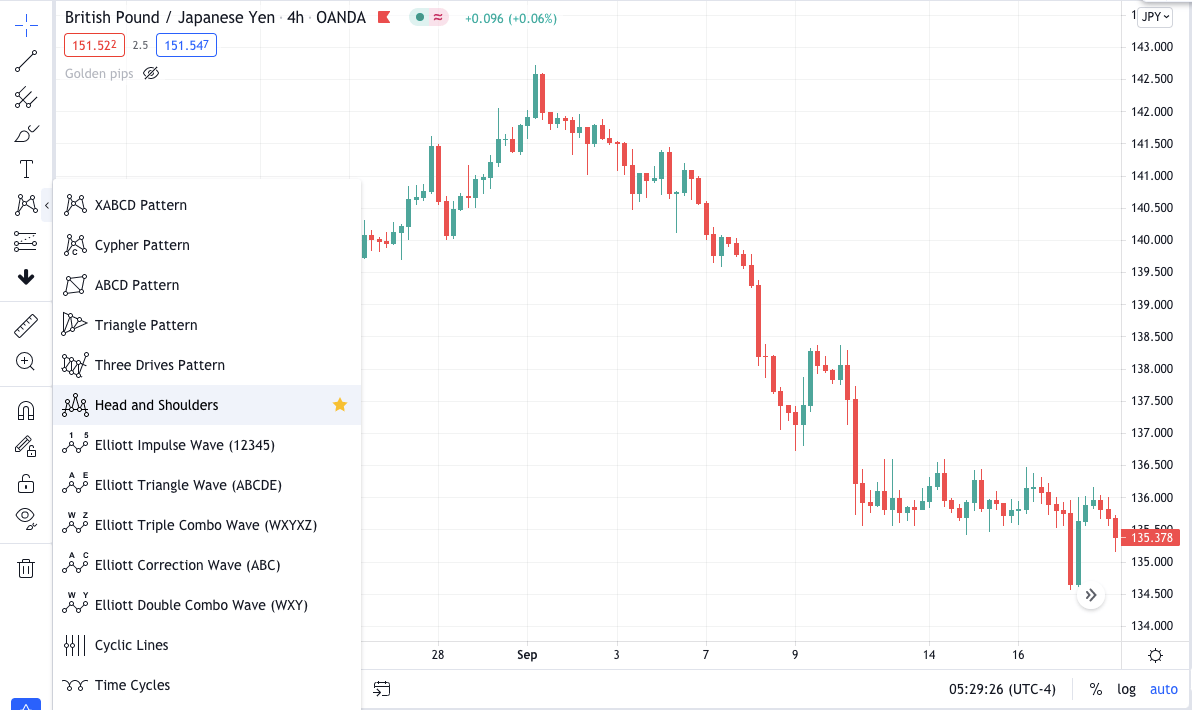
 If you see the pattern formation, select the head and shoulder or inverse pattern from the toolbar.
 Head and shoulder
After selecting the tool, draw the pattern on the chart and wait for the neckline break. If the neckline is not broken, you cannot enter the trade, and hence the setup will be invalid.
The significance of this pattern is relatively easy to understand.
- An uptrend means the price is making a higher high and higher low.
- Then you realize after making the higher high; the price went down to make the higher low.
- But the price could not break the previous high instead of breaking the low, making it the start of a trend down.
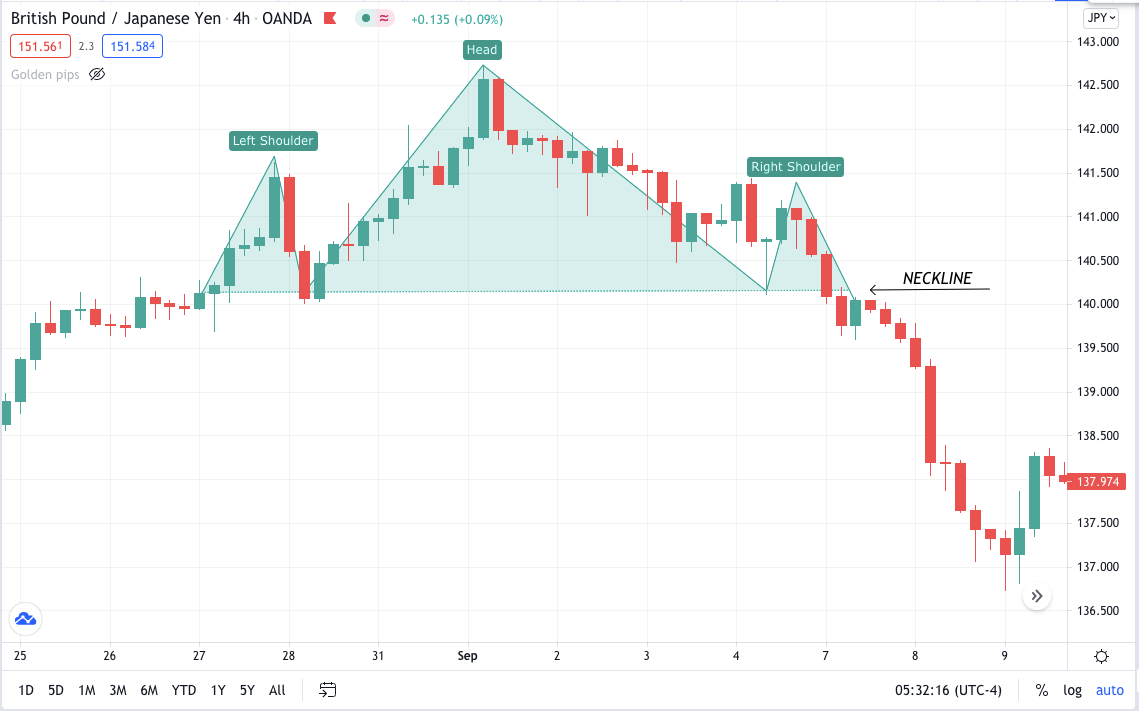 In the above GBP/JPY chart, you can see this pattern formation. Once you have plotted the tool, you need to wait for some solid bearish candle to break the neckline or the swing low. Here you will need to take the trade after the breakout immediately, but instead, wait for the retest of the break for more accurate trade confirmation.
Finally, you can move to the 1hr time frame and enter a short trade by putting the stop loss to the previous support zone.
Inverse head and shoulder
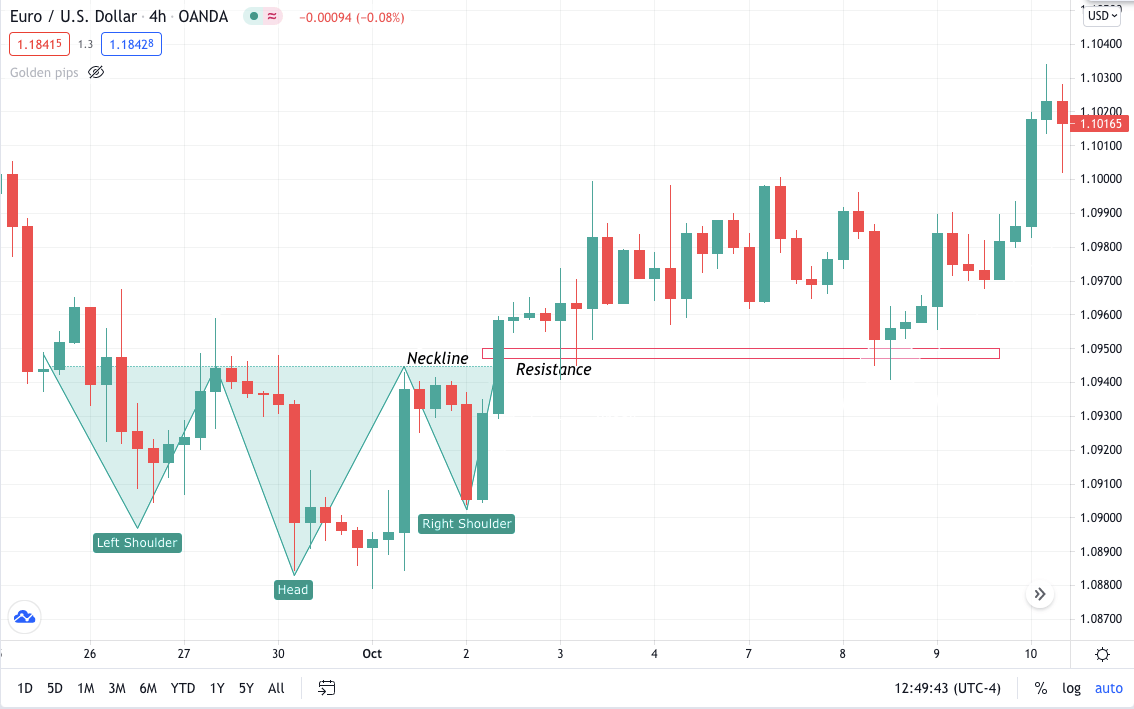
This chart pattern is precisely opposite to the head and shoulder one. The inverse pattern forms at the end of a bearish trend.
Below is the EUR/USD chart of the 4hr time frame showing inverse head and shoulder pattern formation. You can see the price breaking the neckline with a bullish engulfing candle. Price then came back to retest the broken level, giving a good long opportunity.
 Final thoughts
It is hard for beginners to find this pattern on the trading chart. Also, sometimes the neckline break is because of a large candle, thereby not allowing you to enter the trade. Due to this case, a stop loss goes further away from the entry point, increasing the risk.
Although just one pattern is not enough in any form of trading, use candlestick and keep an eye on the overall trend. Sometimes you may find this famous pattern in the middle of the sideways market but keep in mind that is not a proper setup. Always take this pattern setup when it is formed at the end of the trend.
You may choose to wait for the retest after the breakout of the neckline. By doing this, you will have a better risk to reward ratio. Some aggressive traders take their trades immediately after the break. If you use any pattern with confluence, it will make your trading setup more accurate.


Comments