
Trading strategies involve choosing time frames to understand buyers’ and sellers’ activity in the price. Day candles are the most common and best time frame that professionals and successful traders follow. The daily chart helps traders understand the current trend of price movement, and you don’t need to spend a lot of time in front of monitors when you follow it.
However, many people choose to be full-time traders or scalpers, which daily chart trading doesn’t allow. Instead, it focuses on several trading practices such as position trading, swing trading, etc. You need to know which one is suitable for your trading style before you start to follow day charts.
This article includes all essential information about day trading, the pros, and the cons. Let’s learn bullish and bearish day trading strategies that are easily adaptable.
What is a daily chart trading strategy?
A daily chart trading strategy is simply a trading method using a daily chart for any asset. Several time frames show the price movement of financial assets. Traders use methods or techniques to approach the marketplace that involves time frames, entry-exit, trading duration, technical/fundamental analysis, etc. Identifying profitable trading positions by using a daily chart is common among professional traders and institutions.
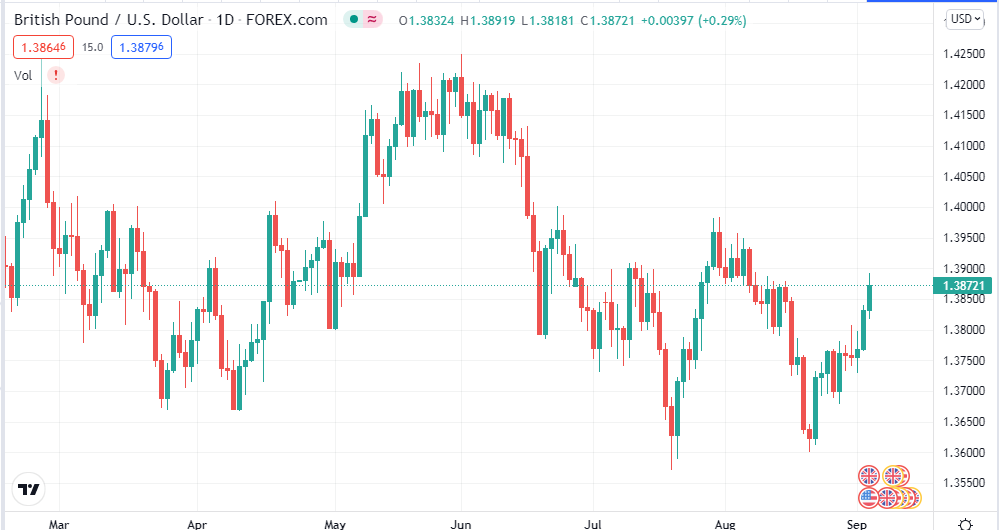
The daily chart of GBP/USD
Why can’t you relax?
Relaxation or flexibility is an essential thing for traders. Full-time traders or traders who use lower time frames for their trading involve stress and emotional trading more than daily chart traders.
Suppose a trader who uses a five-minutes chart to perform trading has little time making trade decisions such as entry, exit, or holding the position. It takes only five minutes to form each candle.
On the other hand, the traders who use daily charts to perform analysis and trading only have to spend a little time in front of the chart and get enough time to make trading decisions. So they can make more excellent trading decisions as they have more time to think.
Why don’t events matter?
Fundamental events such as FOMC, GDP, NFP, etc., cause volatility on the forex currency pairs. So these events create much tension and stress among traders who use lower time frames. The figure below shows a five min chart of EUR/USD of an NFP news release.
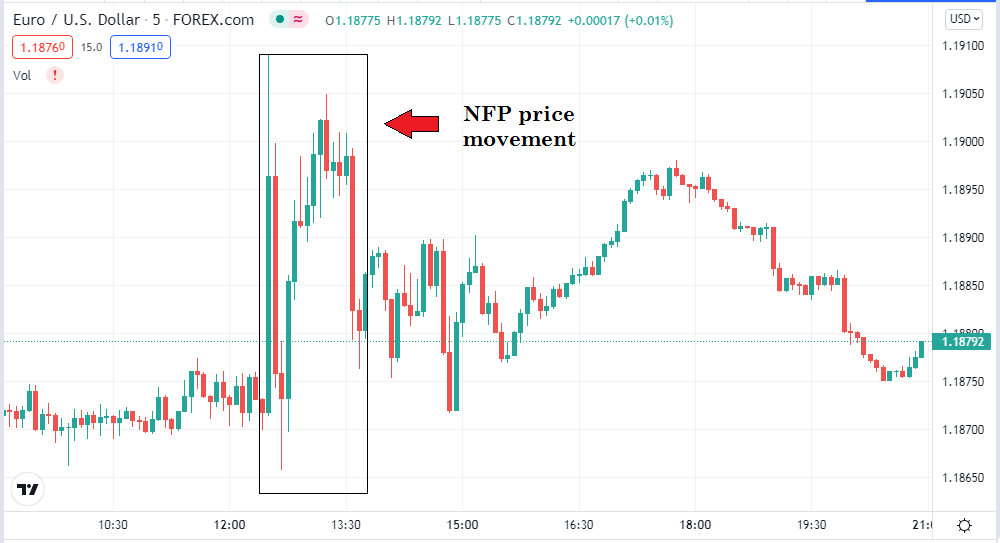
NFP movement in the EUR/USD m5
Traders who use lower time frames face confusion in decision-making as the market remains volatile. Meanwhile, daily chart traders don’t need to face much tension as it is only a candle. Moreover, they might find opportunities in these news events.
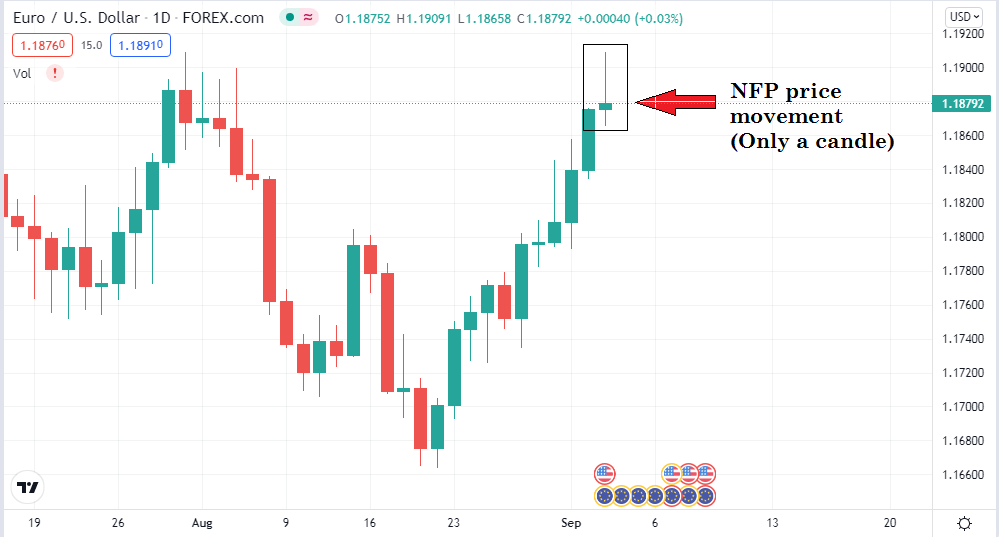
NFP movement in a D1 chart
Why do you have no freedom?
When you choose lower time frames for trading, you need to follow the market and seek opportunities at least every session, such as Asian, European, American, etc. Meanwhile, using a daily chart gives you much flexibility and freedom as you only have to check your chart daily, maybe once or twice, till the new candle forms.
Why can’t you focus on the process and become a profitable trader fast?
Traders come into the financial market to become millionaires. Most of the newcomers choose to be full-time traders. They see the forex market as a money-making machine that’s a wrong concept. As a result, they end up losing capital. You need to focus on the process, have patience, follow the rules and strategies to become a successful forex trader. You need to spend more time researching and making skills rather than taking trades in the beginning period.
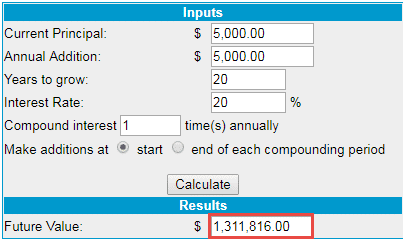
Yearly 20% growth calculation
In less than 20 years, you can be a millionaire with only a 20% yearly growth rate from a 5000$ trading account.
Trading strategies using a daily chart
Using a daily chart, you can use several trading methods such as position trading, swing trading, etc. Position traders often hold positions for longer periods than swing traders. Position traders are familiar with losing positions to become profitable.
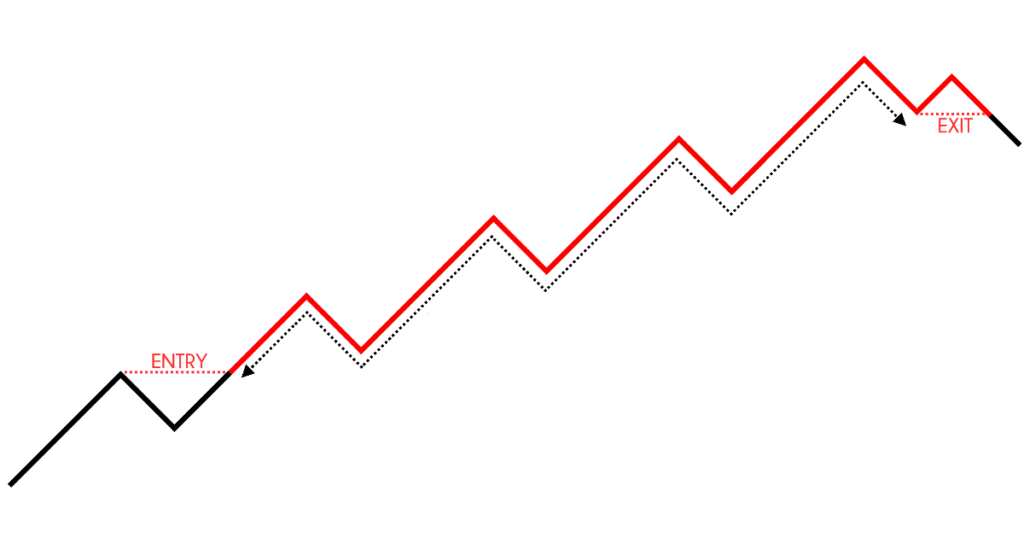
Position trading pattern
Swing traders take positions when the opportunities come and often perform more trades than the position traders.
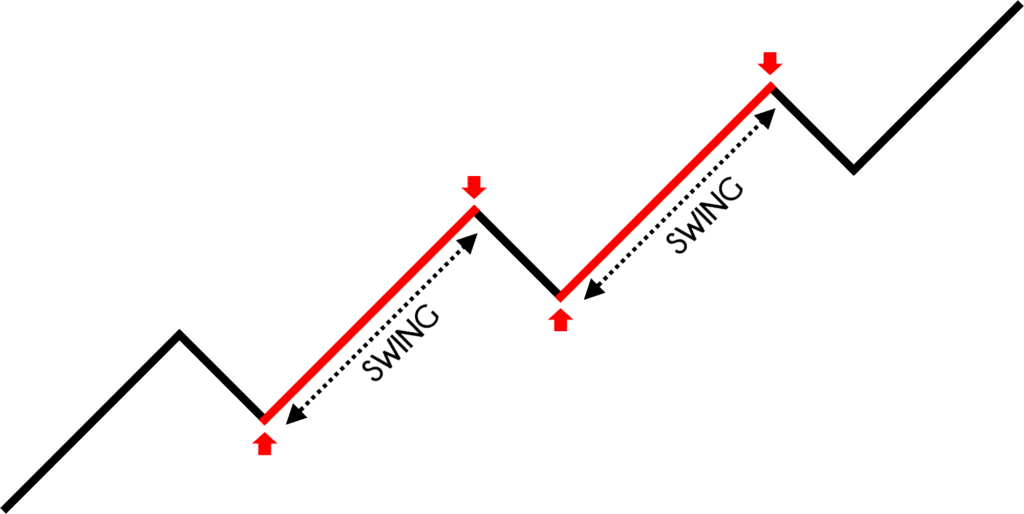
Swing trading pattern
Bullish trading strategy
It is a simple MA crossover strategy to catch the potentially profitable trading positions. We use simple moving averages periods of 24 and 9. This crossover strategy works fine on the daily chart.
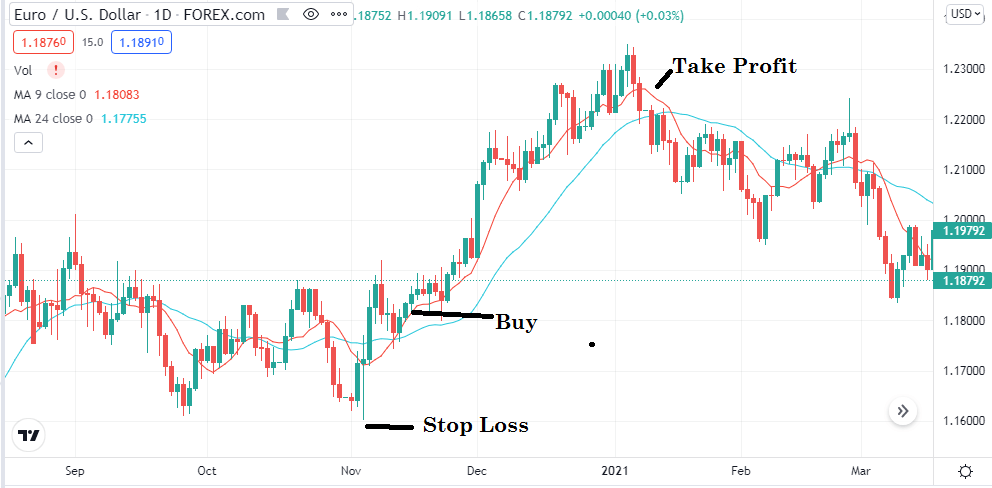
EUR/USD daily chart
- Here the blue line is 24 SMA, and the red line is 9 SMA.
- When the red line crosses above the blue line, the market enters a bullish phase and is suitable to place buy orders.
- Place buy when the candle closes above both SMA signal lines.
- Initial stop loss will be below the recent swing low.
- You can continue the buy position till the price candle remains above the red signal line.
- Close the buy position when the price candle starts to close below the red signal line.
- When the red SMA line crosses below the blue SMA line, the bullish phase ends.
Bearish trading strategy
A bearish setup for the MA crossover strategy is just the opposite of a bullish setup. This strategy also works fine on the daily chart. When the red SMA line crosses below the blue SMA line piece enters a bearish phase. Place sell orders when the candle closes below both signal lines.
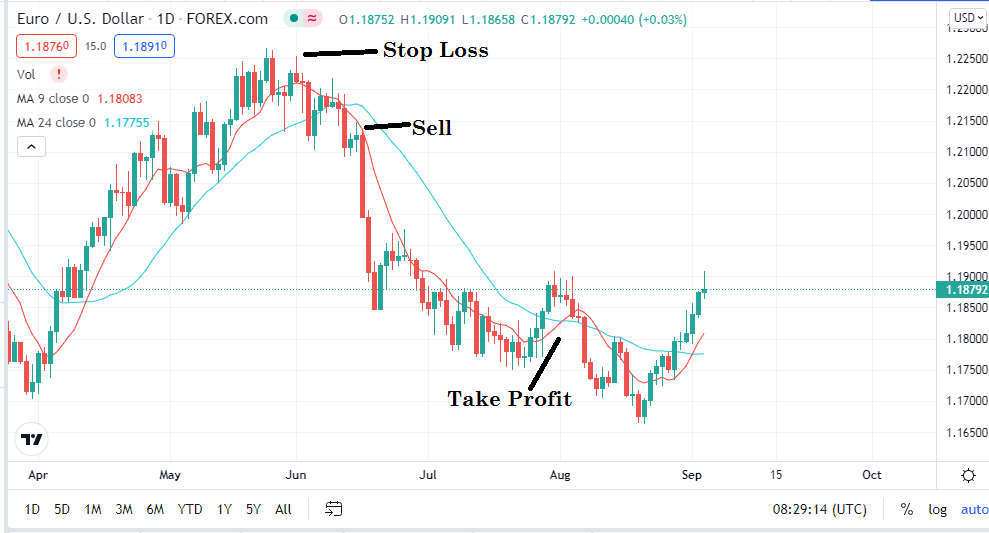
EUR/USD daily chart
Initial stop loss will be above the recent swing high. Sell orders are safe till the candles start to form below the red signal line, and when the red SMA line crosses above the blue SMA line, that’s the exit for sell orders.
Pros and cons of using daily charts for trading
Besides all the positive facts, there are also some limitations on trading using daily charts. In this part, we will list the basic pros and cons of daily chart trading strategy.
Pros |
Cons |
|
|
Final thoughts
Finally, now you know the basics of daily chart trading. To become a successful trader, you need to perform several practices using daily charts such as monitoring schedule, observation notes, wrong or right trading decisions, etc. When you can sort out your mistakes, you can avoid them and can enjoy more winning trades.


Comments