
Whether you are a stock, forex, or crypto trader, you must have used or at least heard about trend lines and channels. To become successful in trading, you need to master the basics, i.e., support, resistance, and trendline. I have seen and read about traders and investors winning the markets by just using these simple tools.
A trendline is very easily recognizable diagonal lines drawn by the traders on the trading chart. Yes, you also might know a trendline is very common, but that does not mean that every trader knows how to draw it perfectly.
Also, just learning how to remove the trendline will not help you execute the deal. It would help if you also had a strategy that works. This article will show how to draw and trade using trendlines and channels like a pro.
What is the trendline?
It is a line drawn diagonally on the trading charts that acts as a support and resistance. Thus, trendlines are the most utilized form of technical analysis in stocks and the FX.
Traders draw this line to follow or analyze the market trend.
- In an uptrend, the trendline touches the swing lows.
- It touches the swing highs in a downtrend.
These touches are relevant and visible to the vast majority of traders around the globe, thus giving a potential buy or sell signal.
How to draw a perfect trendline
When drawing a trendline, always keep in mind that you are drawing support or resistance, just not horizontally but diagonally. So, to draw a perfect trendline, first, switch your chart from candlestick to line chart form.
Once you have the line chart, select the horizontal line and draw it diagonally, touching at least three low swings if it’s an uptrend and touching three highs if it’s a downtrend. Once the trendline is done, switch back to the candlestick chart and adjust the touches.
The trendline can either touch the body or the wick.
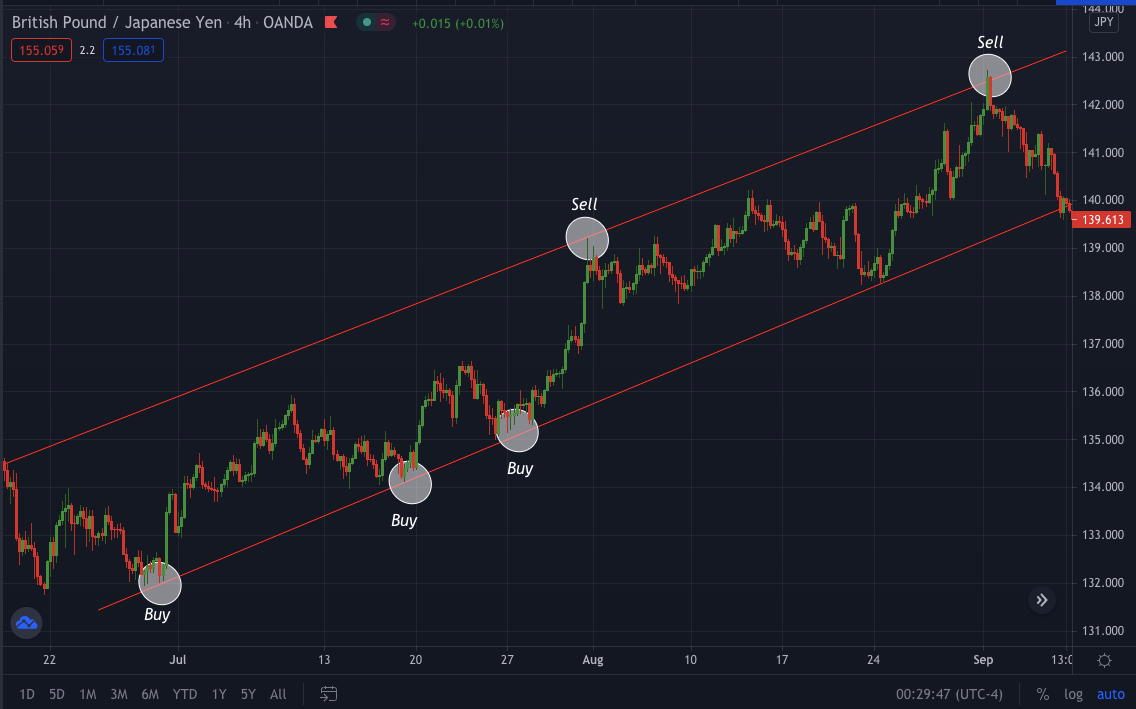
What is a channel?
A trading channel is a channel drawn on an asset trading price chart by graphing two parallel trend lines drawn at resistance and support levels. Generally, traders believe that asset prices will remain within a trading channel and buy at channel support and sell at channel resistance.
How to draw a perfect channel
Drawing a perfect channel is very easy as it is just a parallel diagonal line to the trendline. Draw the trendline first by touching two candles or wick touching the candles from the bottom, adding a new trendline connecting the upper part of the candle and making sure it is precisely parallel to the previous trendline.
How to trade trendline and channel
As FX is a volatile market, you alone cannot depend on one strategy tool or setup. Therefore, it is essential to confluence a trendline with other charting tools, say support, resistance, or any technical indicator.
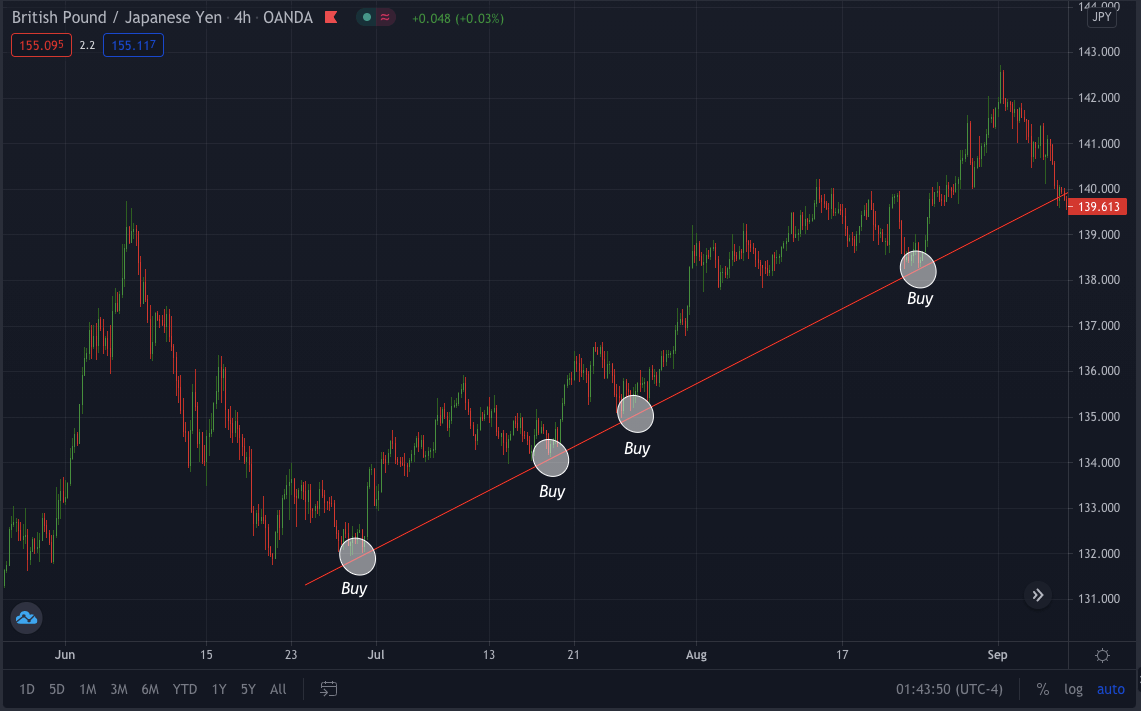
Trading trend continuation
First, you need to draw your dynamic support & resistance in a 4hr time frame. Once S&R is done, you can then remove your trendline diagonally with at least three candle touches.
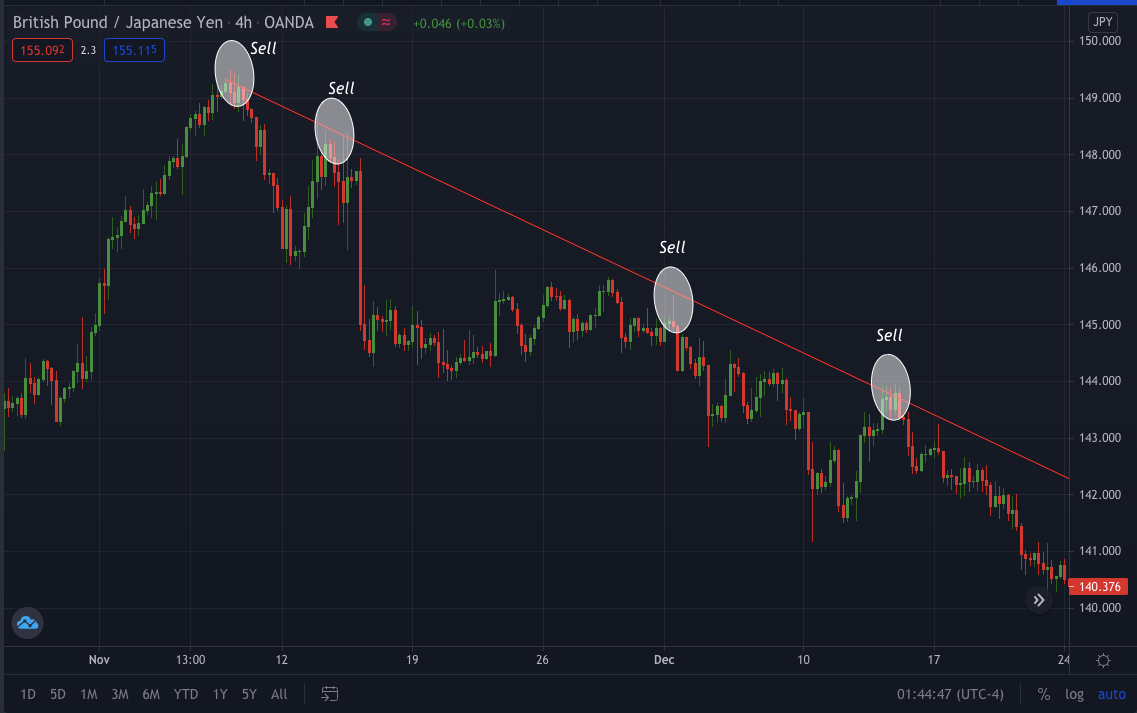
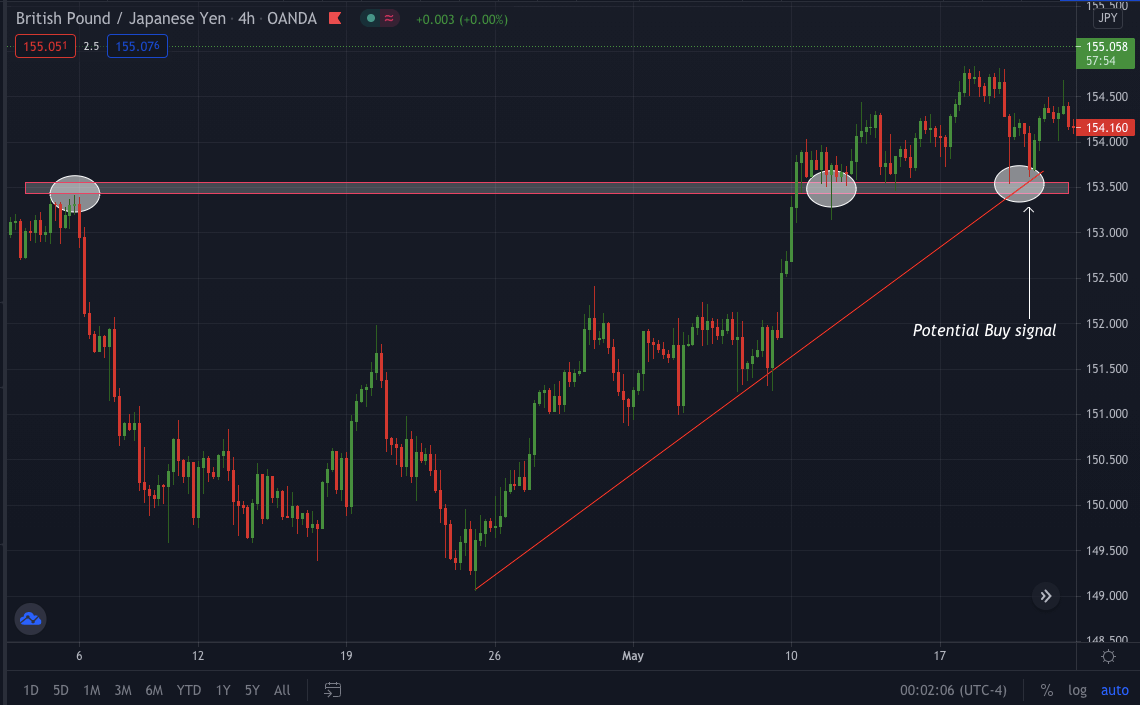
While trading trend continuation in the bull market, look out for buy trading opportunities at the swing low, while in a bear market, look out for sell trading opportunities at the swing high
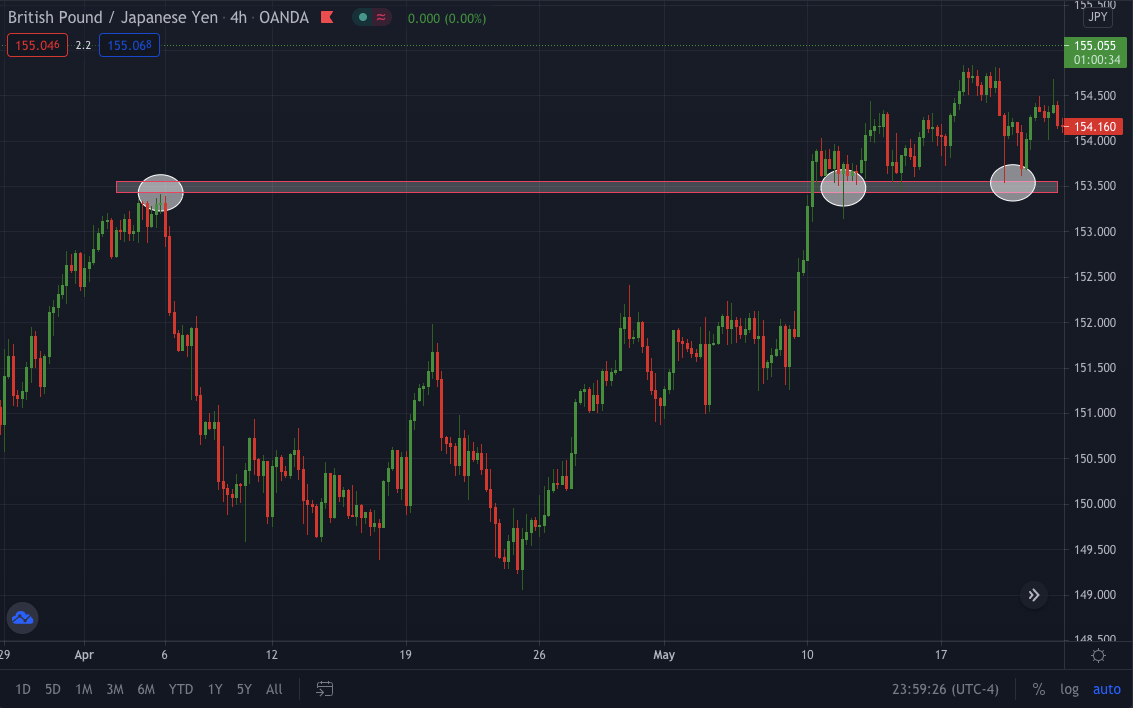
Trading trendline for breakouts and retest
Trading breakouts is a fantastic trade setup that you can play out using trendline. First, you need to draw your S&R followed by a trendline with three candle touches for trading breakouts.
Once you have your tools plotted on the chart, make sure to keep an eye on the last confluence between the trendline and the resistance. Keep checking the price movement and rejection candles with wicks in a lower time frame, say 30M or 15M. Once you see the trendline break, do not directly execute the trade; instead, wait for the retest of the new resistance.
The retest setup will give you low risk and more rewards. The below GBP/JPY 4hr chart shows the perfect scenario of break and retest.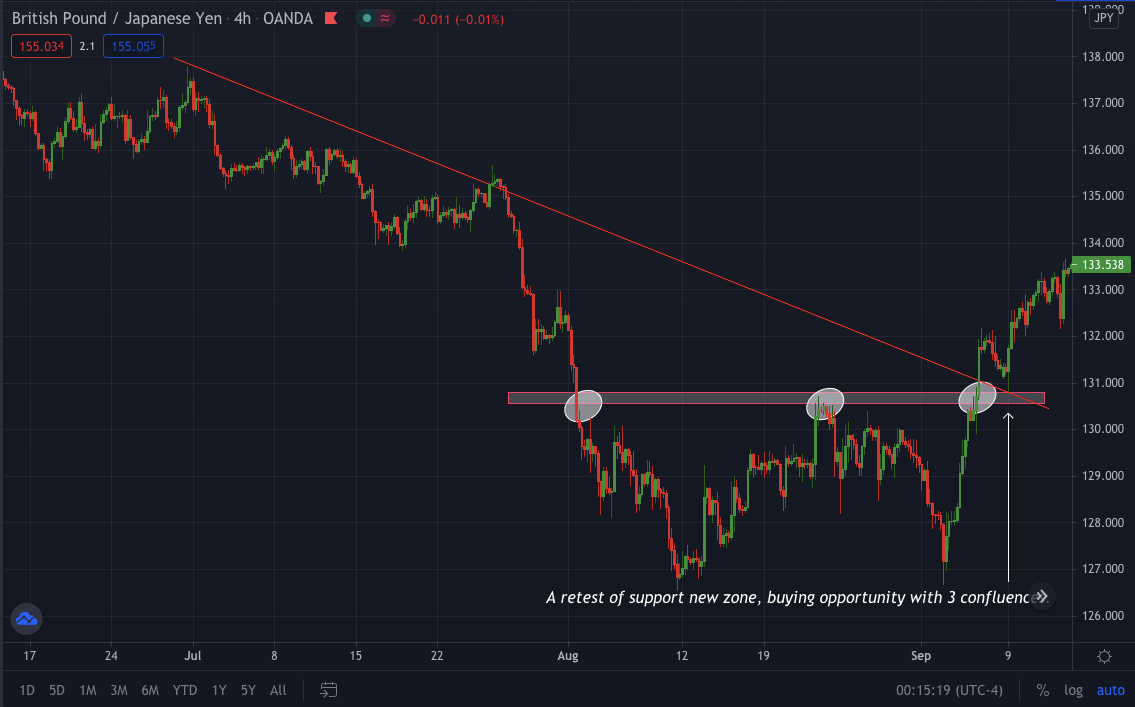
Limitations
Although trading using trendline and channel is considered one of the most straightforward and best strategies, it too has some limitations. Trendline trading does not work too well in a volatile market because the price fluctuates fast you need to keep adjusting the trendline.
Making the perfect line is not always possible as price does not move in an excellent zig-zag manner, and sometimes, logarithmic or arithmetic charts can affect the trendline.
Conclusion
Mastering the technique of trading using these methods will give you that edge you need in succeeding. Support, resistance, trendline, and the channel is the most basic strategy and easy to use the tool. However, as the trendline tells you the overall market trend and the possibility of the following price touch, it is not sure that the price will follow the trendline. Therefore some traders can use naked price action with trendline and channel, while some can use indicators.
Trading any strategy with confluence is supposed to be the most powerful and accurate strategy. You can use price action, support & resistance, and indicator and trade when all the tools tell the same thing for a more precise trade setup.


Comments