
The Ichimoku technical indicator reveals everything about the price trends such as potential reversals, momentum, volatility, direction, support, and resistance. Hence, it is an “Across the board” indicator.
The Ichimoku — is a flexible manual trading indicator that characterizes support and resistance levels, measures momentum, recognizes the trend direction, gives trading signals. Еhe indicator offers more information than a standard candle chart. Although the charts may look messy in the first look, they become progressively recognizable when you figure out every element.
You can interpret them effectively with appropriately characterized trading signals. Initially, the indicator may look complicated at the very first application in the technical charts because the indicator has exaggerated segments. However, if you comprehend the features and the usage, Ichimoku can recognize trends, support, and resistance.
Significance of the Ichimoku indicator
Support and resistance levels play a vital role in trading strategies and analysis. They can disclose when the prices will get up and when they will get down. Thus, only the support and resistance levels can help change the forex patterns or trends.
Traders use multiple tools to identify the support and resistance levels. For example, Ichimoku is a complex indicator that uses several tools to define the S/R groups more precisely. Among Ichimoku tools: Tenkan Sen and Kijun Sen provide short-term and medium-term dynamic support and resistance levels. On the other hand, Chikou Span, the straight line of the price 26 periods back, shows the ultimate confirmation of the trend.
Besides illustrating support and resistance, Ichimoku provides many suggestions. When the Ichimoku Cloud is thicker, it will offer more grounded support/resistance. Mostly, the price will reject the Ichimoku to continue recent trends. Support and resistance are the essential methods for making a trading decision. It means when the support and resistance are strong when the Ichimoku Cloud is comprehensive.
Let’s have a look at a visual representation of the Kumo Cloud support and resistance from the GBP/JPY pair:
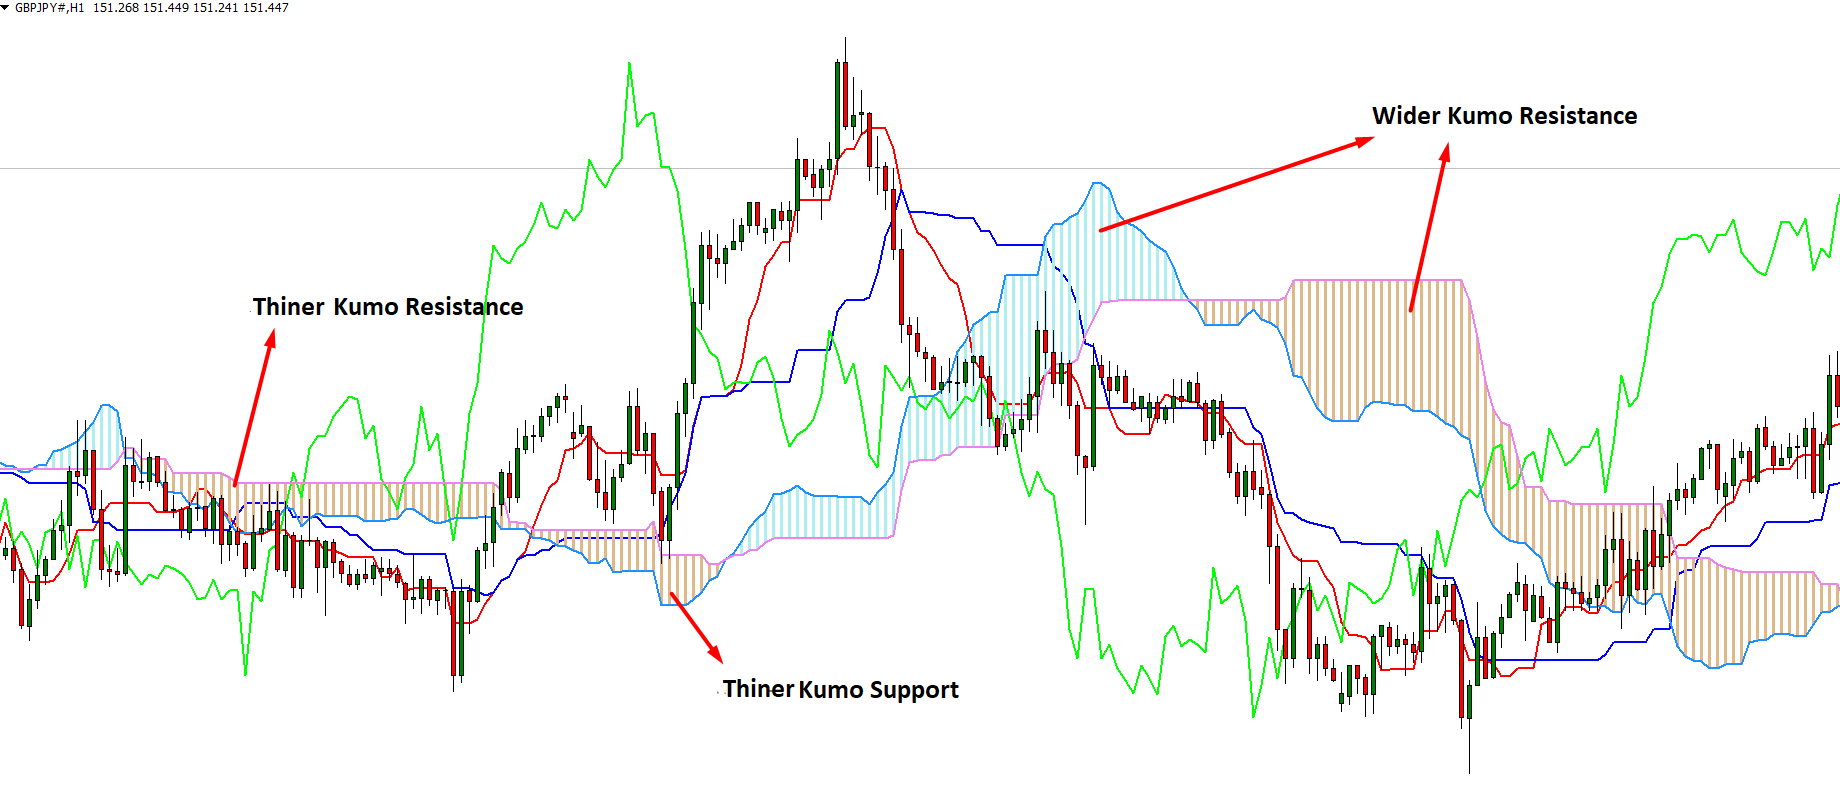
When the price is above the Ichimoku, it is supported, and traders will search for the buying opportunity. On the other hand, if the price underneath the Ichimoku implies, it is beneath resistance, and traders should look for more sell opportunities than buying. The trend is more potent if the price remains more extended underneath or over the cloud; the Ichimoku will provide more support and resistance.
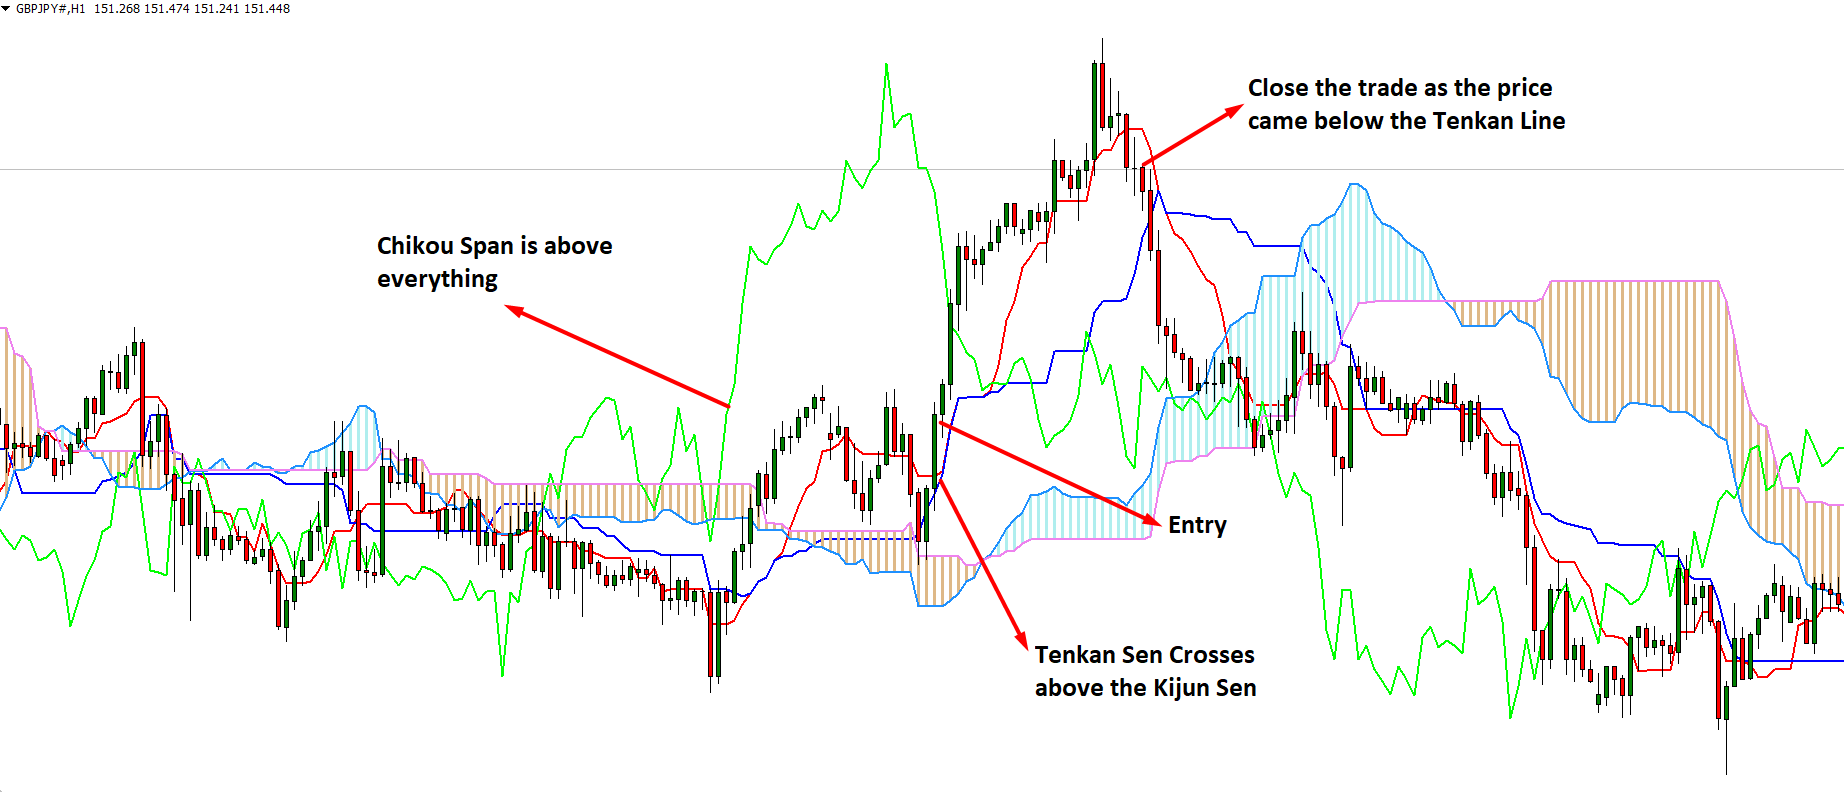
How to take a buy trade?
- The first condition for taking a buy trade is the Chikou Span line above the current market price and any remaining indicator lines.
- The second condition is that the Tenkan line should cross above the Kijun Sen line after confirming the first condition. If supported, wait for the second condition to fill and wait for the price to cross above the Kumo cloud and close the bar above it.
- After confirming the third condition, traders should open three buy positions of similar volumes.
Stop-loss
Set the stop-loss at 50 points from the opening price level for all of the three positions.
Take profits
Set the take profit level at 30 points from the opening price for the first position. Take profit level at the 50 points for the second position and the third position the take profit level set at 100 points.
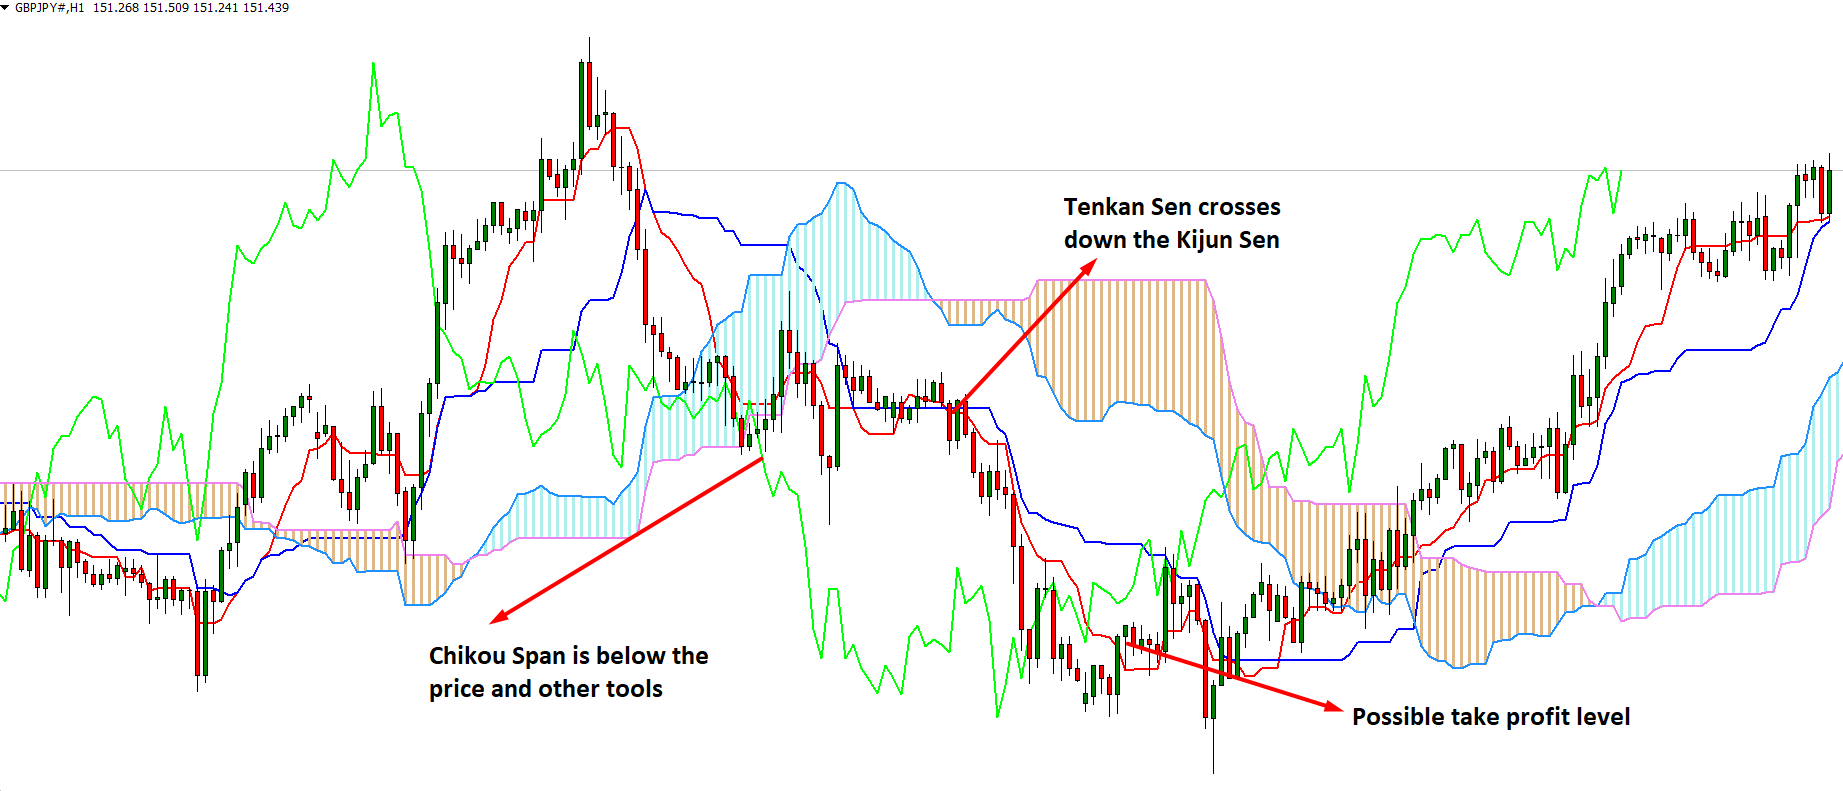
How to take a sell trade?
- The first requirement for taking a sell trade is the Chikou Span line, below the current market price and other indicator lines.
- After confirming the first requirement, the second requirement is to find when the Tenkan line crosses Kijun from upside to downside.
- Later on, we should wait when the price crosses the Kumo cloud and closes the bar beneath it as the third requirement.
- Later on, traders ought to open three buy trades with similar volumes.
Stop-loss
Set the stop-loss at 50 points from the opening price level for all of the three positions.
Take profits
Set the take-profit level at 30 points from the opening price for the first position. Take profit level at the 50 points for the second position, and the third position set take profit level at 100 points.
How to manage trades?
Managing a trade is contingent upon whether you are in the buy trade or the sell trade. If the trader is in the buy trade, then will move stop-loss below any new swing higher low. To move the SL, the price should be above the current stop loss level.
Otherwise, traders may experience an unexpected stop loss hit and run. For example, when the trader is in the buy trade, then he should not move the stop loss immediately. Instead, wait for a minimum of two candles to close before moving the stop loss.
On the other hand, traders will move SL down to the new swing lower high to match the price trend. Make sure to move the stop loss down after every swing low occurs in the price. The price should be lower than the present SL; otherwise, the stop loss might get hit.
Summary
The Ichimoku trading strategy is a sophisticated trading indicator that plots more data than the average technical analysis instrument. As a result, traders can figure out how to assimilate the information initially with a bit of study.
Sooner or later, traders ought to have the option to settle on better trading choices on the price activity. The best spot to rehearse or study is a demo account. In a demo account, traders can learn the techniques and master them without even jeopardizing the real money.


Comments