When it comes to trading in the financial market, the duration of holding the asset matters. For instance, some traders are flexible in holding positions overnight; some may want to exit from trades within the day. Intraday trading is popular among traders who are comfortable with participating in short-term trades.
This article will introduce you to the term ‘intraday trading’. However, intraday trading involves participating in the forex market with various strategies such as scalping, position trading, technical trading, etc. After finishing this article, you will learn what intraday trading is; besides, we describe two strategies with charts.
What is intraday trading?
You can consider ‘intraday trading’ as trade within the day. Day traders often use intraday trading strategies as participating methods to the forex market as these techniques include scalping, technical trading, trend trading, news trading, etc.
Intraday traders use time frames from 1min to hourly charts as they have tendencies to trade during the opening hour of the same day.
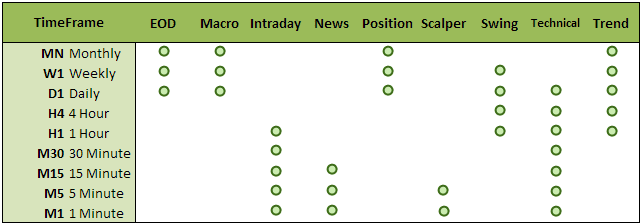
Time frames for different trading methods
Traders manage positions over minutes or hours, seeking entry/exit points by conducting technical and fundamental analyses on shorter time frame charts. Intraday traders always create strategies that involve executing trades during regular trading hours.
Many intraday trading strategies are available to trade different financial assets, such as stocks, ETFs, forex, commodities, securities, etc. Trading with a proper system is essential as it enables consistency in making profits and reduces the number of losing trades.
How to trade with intraday trading strategy
The financial market involves a vast number of transactions every day. So you have to master strategies that support your trading style and return expectations. Complete strategies include trade and money management ideas to reduce risk besides increasing profitability.
Depending on your trading skills, you can apply trading techniques such as momentum, trend, price action, scalping, position trading, etc., for intraday trading. It doesn’t support overnight holding assets, allowing all executing trades to close within current day trading hours.
Many methods, such as reversal trading strategy, gap and go strategy, MA crossover strategy, breakout trading strategy, etc., are popular day trading or intraday trading strategies.
Short-term trading strategy
We use a MA crossover strategy as our short-term intraday trading strategy. We use EMA 9 and EMA 21 crossover for executing trades and exit from orders. For trend confirmation, we use 200 EMA.
When price candles are above the yellow signal line or 200 EMA line, it indicates bullish pressure on the asset price. The yellow line is the last dynamic EMA line after the first two price candles cross above buyers’ domination. Inversely when the price starts to decline, it firstly crosses below the red MA (9 EMA), next below the blue EMA (21 EMA), and lastly below the yellow MA (200 EMA) as full seller domination occurs at the price movement. This trading method works fine in the 15min chart. Check the current trend from upper timeframe charts such as 4hour or daily charts.
Bullish trade setup
When the current trend is bullish at the upper timeframe charts, check the following conditions:
- Price candles are above all three EMA lines.
- The red EMA signal line crosses above the blue EMA signal line.
- Both red and blue signal lines are above the yellow signal line.
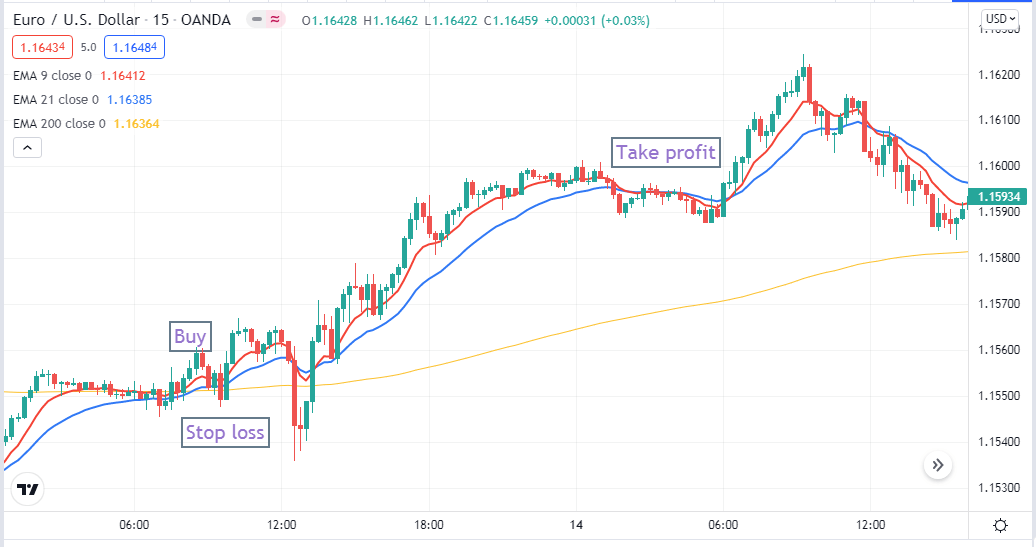
Bullish setup
Entry
Check the conditions above are true, place a buy order after closing the current bullish candle.
Stop loss
Set a stop loss with a buffer of 5-10pips below the recent swing low.
Exit
Exit from the buy order when:
- The red EMA line crosses below the blue EMA line.
- Price comes below the blue EMA line.
Bearish trade setup
When the current trend is bearish at the upper timeframe charts, check the following conditions:
- Price candles are below all three EMA lines.
- The red EMA signal line crosses below the blue EMA signal line.
- Both red and blue signal lines are below the yellow signal line.
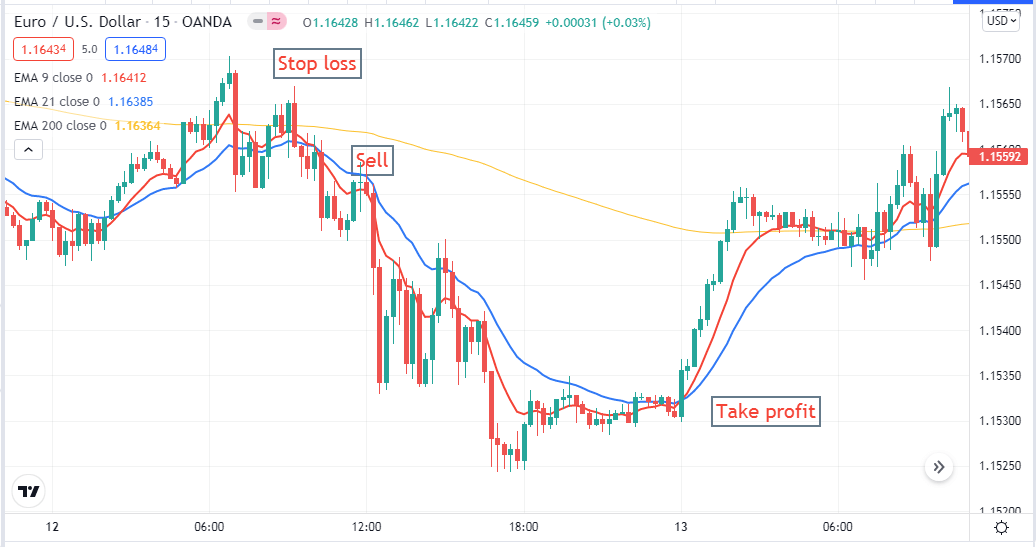
Bearish setup
Entry
Check the conditions above are true, place a sell order after closing the current bearish candle.
Stop loss
Set a stop loss with a buffer of 5-10pips above the recent swing high.
Exit
Exit from the sell order when:
- The red EMA line crosses above the blue EMA line.
- Price comes above the blue EMA line.
Long-term trading strategy
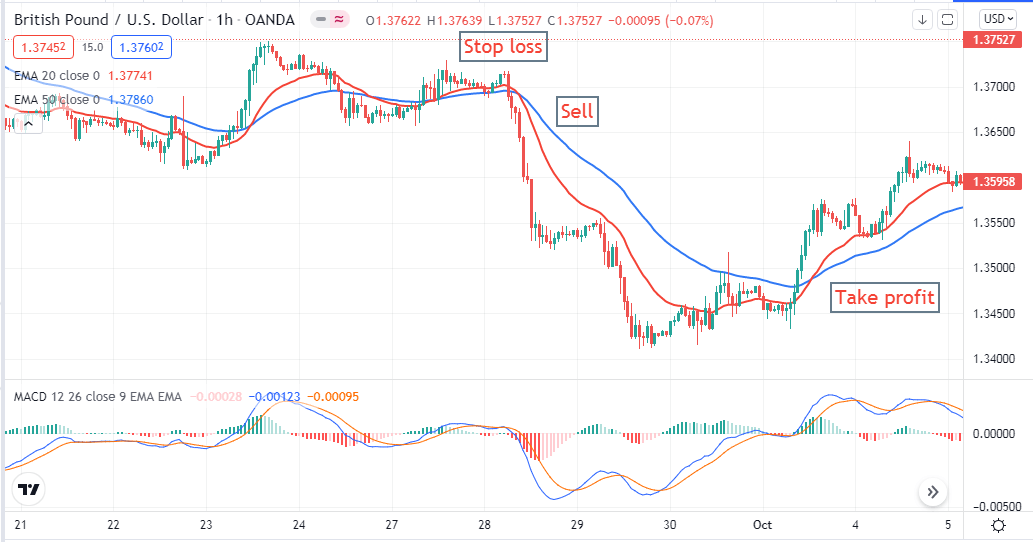
This intraday trading strategy involves EMA crossover beside popular momentum indicator MACD to generate profitable trading ideas. This strategy works fine at the 1hour chart and allows holding assets overnight.
This strategy involves a red EMA (EMA 20) and a blue EMA (EMA 50) dynamic signal lines for generating trade suggestions. The confirmation comes from the MACD indicator window.
Bullish trade setup
Check the following conditions:
- The red EMA line crosses above the blue EMA line.
- Green histogram bars appear above the middle line of the MACD indicator window.
- Both dynamic lines of the MACD indicator window are above the middle line and moving toward the upside.
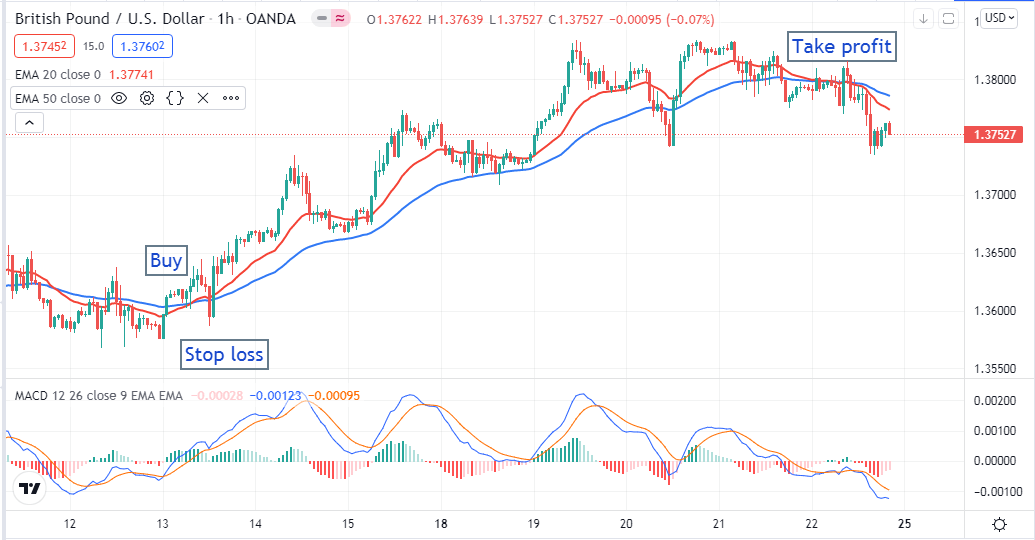
Bullish setup
Entry
When all conditions above are true, place a buy order.
Stop loss
Set at initial stop loss below the recent swing low with a buffer of 10-12pips.
Exit
Close the buy position when:
- The red EMA crosses below the blue EMA line.
- Red histogram bars appear below the middle line of the MACD window.
Bearish trade setup
Check the following conditions:
- The red EMA line crosses below the blue EMA line.
- Red histogram bars appear below the middle line of the MACD indicator window.
- Both dynamic lines of the MACD indicator window are below the middle line and moving toward the downside.
Bearish setup
Entry
When all conditions above are true, place a sell order.
Stop loss
Set at initial stop loss above the recent swing high with a buffer of 10-12pips.
Exit
Close the sell position when
- The red EMA crosses above the blue EMA line.
- Green histogram bars appear above the middle line of the MACD window.
Pros and cons
| Pros | Cons |
| No overnight tension for holding trading positions. | The profit target is low in comparison to the other strategies. |
| You can make frequent trades with an intraday setup. | You have to spend particular time every day monitoring and conducting analysis. |
| You can trade all major currency pairs with sufficient volatility with these trading methods. | Lower time frames involve fake swing highs and lows. |
Final thought
Finally, these trading methods will give you opportunities to make frequent trades and constant profits. We suggest trading carefully with these strategies during major trend-changing fundamental economic events such as interest rate decisions, GDP, employment data, etc. Moreover, check the performance of these trading techniques at demo trading before applying these to actual trading.


Comments