
If you don’t have time to monitor the market frequently, you can follow position trading as it does not require much time to observe the market. Moreover, the financial market has a nature where the higher and lower time frames show the same movement. Therefore, any trading strategy in a lower time frame can be applied to position trading but with some conditions.
You cannot follow a system until you know the core concept of trading. In position trading, there are some rules that you need to make sure of in your strategy. If you follow the guidelines in the below section, you might become a pro in position trading.
What is the position trading
When we talk about position trading, we mention the macro level of the market. Position trading is a process to buy or sell a currency pair from a specific zone or level and hold it to get the result. You might have to wait days and months to find your trades as profitable. Sometimes, position trading requires multiple trades in an anti-martingale system, while you might have to carry losses in your trading account.
Don’t get panicked!
Position trading is just like what an investor does. For example, if you find that the Covid-19 pandemic has changed business, people are now focusing on technology more than before. Therefore, any investment in tech sectors would be an excellent opportunity for the next few years.
If you have bought some stock in Apple or Microsoft, you have a higher chance of gaining. By doing so, you have become an investor as well as a position trader.
How does position trading work?
In FX trading, most retail traders participate in the market through a broker. They buy and sell a currency pair, and the broker transfers the order to a liquidity provider. You do not own the currency, but you became a part of the contract. You are not getting any ownership of assets in position trading, but price fluctuation is the only way to earn money. The price movement in higher time frames is similar to lower time frames, where bullish and bearish swings are common in the chart.
Therefore, if you buy a currency pair from a specific position, you can earn higher profits as the trade came from a significant position, not from a random place. Moreover, in position trading, the main focus is on what big investors are doing. Banks and prominent financial institutes spend millions of dollars in market analysis where their main focus point is higher time frames. Therefore, any breakout and retest in higher time frames are more potential than intraday trading.
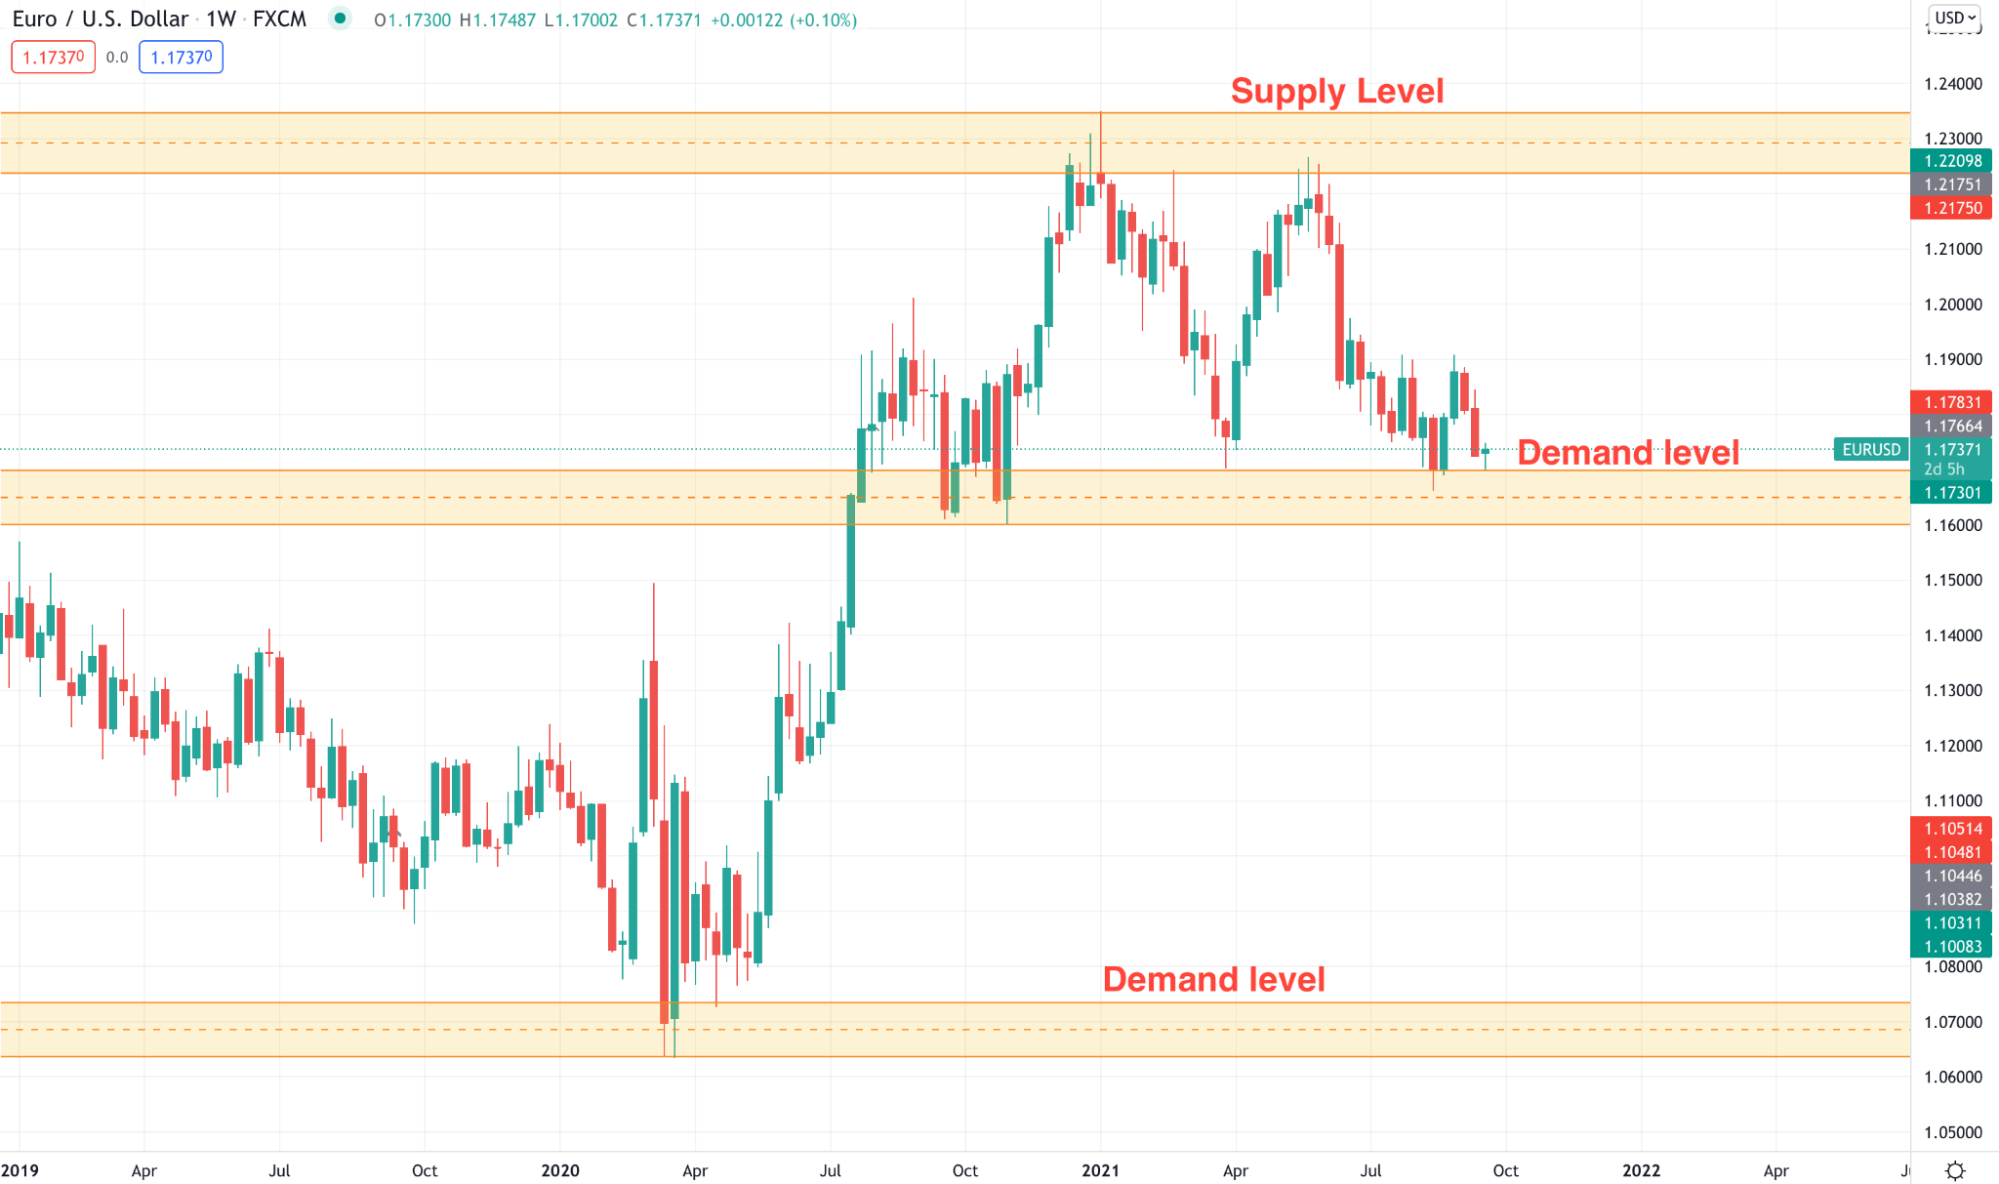
EUR/USD weekly chart
The above image shows the weekly chart of EUR/USD where the supply and demand zones are marked. You can see how the price reacts on that supply and demand zone, which is often rare in the hourly chart.
However, you don’t have to identify these levels to be successful from position trading, but you need to focus on what we are going to discuss below.
Step 1. Identify market climate
The market climate means the overall structure of the market. You don’t have to be a finance graduate or economist to identify the market climate, but you need to learn how to read the price.
The chart in the financial market is like a book where a trader must read it from left to right and anticipate the future movement. In that case, the primary requirement is to identify the market trend. A trend comes after a range, and the range comes after a trend. If you cannot read the current status of the trend, you will struggle to predict the price movement.
Step 2. Try breakout trading
In higher time frames, market makers build orders in the range market, and once their orders are filled, the price starts moving. Once they move after breaking above any significant level, it usually provides hundreds to thousands of pips.
Therefore, finding a breakout would be an excellent option for position trading. However, you need to follow some rules while trading breakout.
Let’s see it here:
- Higher time frames breakout provides more accurate results.
- The speed of breakout is essential. A breakout with a strong candle has a higher success rate.
- After the breakout, the price should hold the momentum. Otherwise, a fakeout may happen.
- Fakeout or breakout both provide a good trading opportunity.
Let’s see an example of a breakout from the price chart.
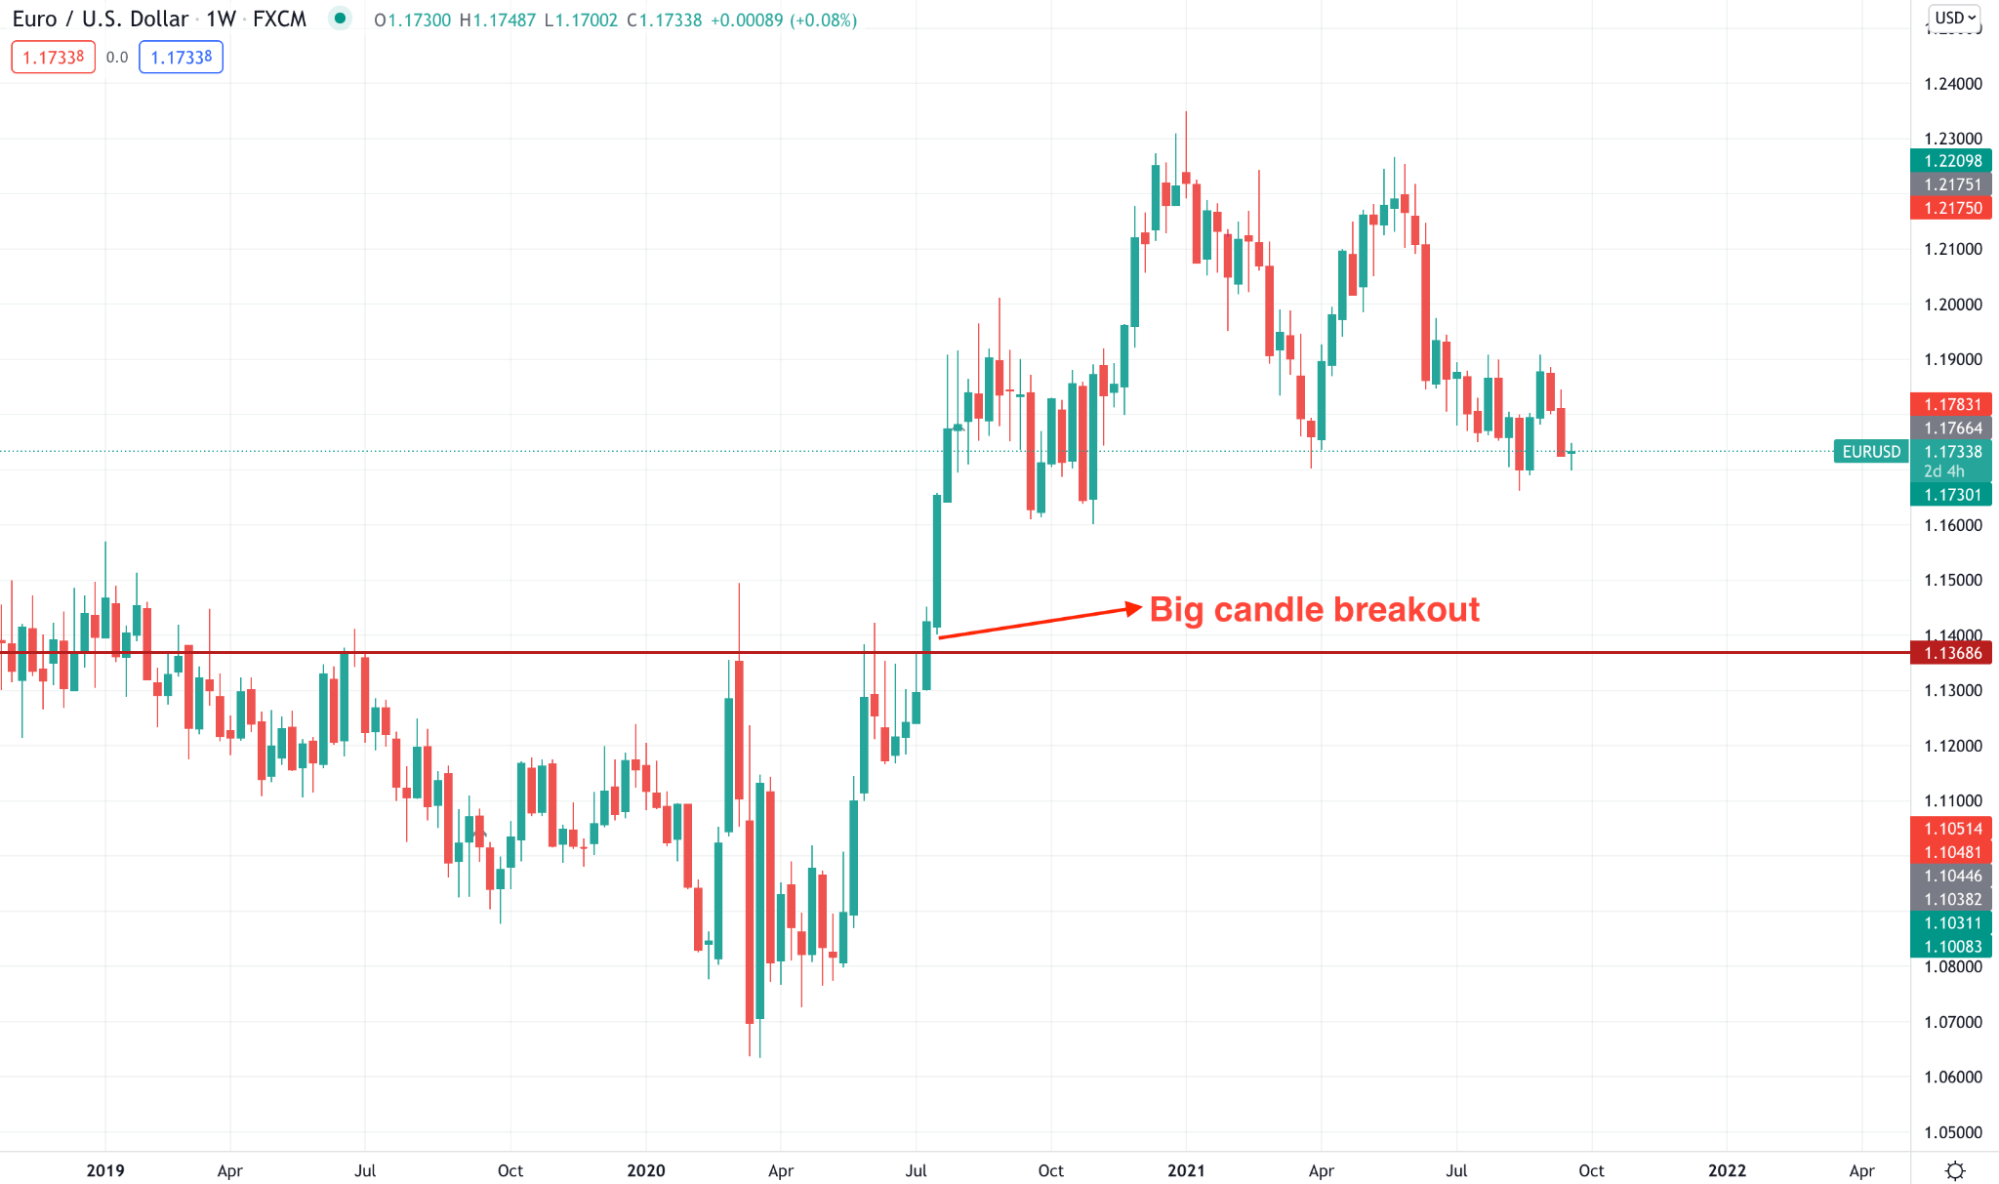
EUR/USD weekly chart
The above image shows a strong breakout where the price moved up above the resistance and closed with a bullish candle. As a result, the price moved higher immediately without any retest.
Step 3. Move forward with your trades
The HODLing approach is the primary requirement in position trading. In the higher time frame trading, you need to open the trade to hold it long. Sometimes, you may have to wait months and years to see the price in a comfortable area. Therefore, open the trade as soon as the formation appears and never open it based on running candles.
Step 4. Use a 50-day moving average
In position trading, it is essential to understand where the average traders are heading. Using a 50 moving average in the daily chart will provide the average price for the last 50 trading days. The weekly chart will show the market sentiment of a year.
If the price is above the 50 days MA, focus on buy trades only. Moreover, closely monitor when the price approaches these levels where any breakout or bounceback may happen. Let’s see how the breakout and reversal happen from the 50-day moving average.
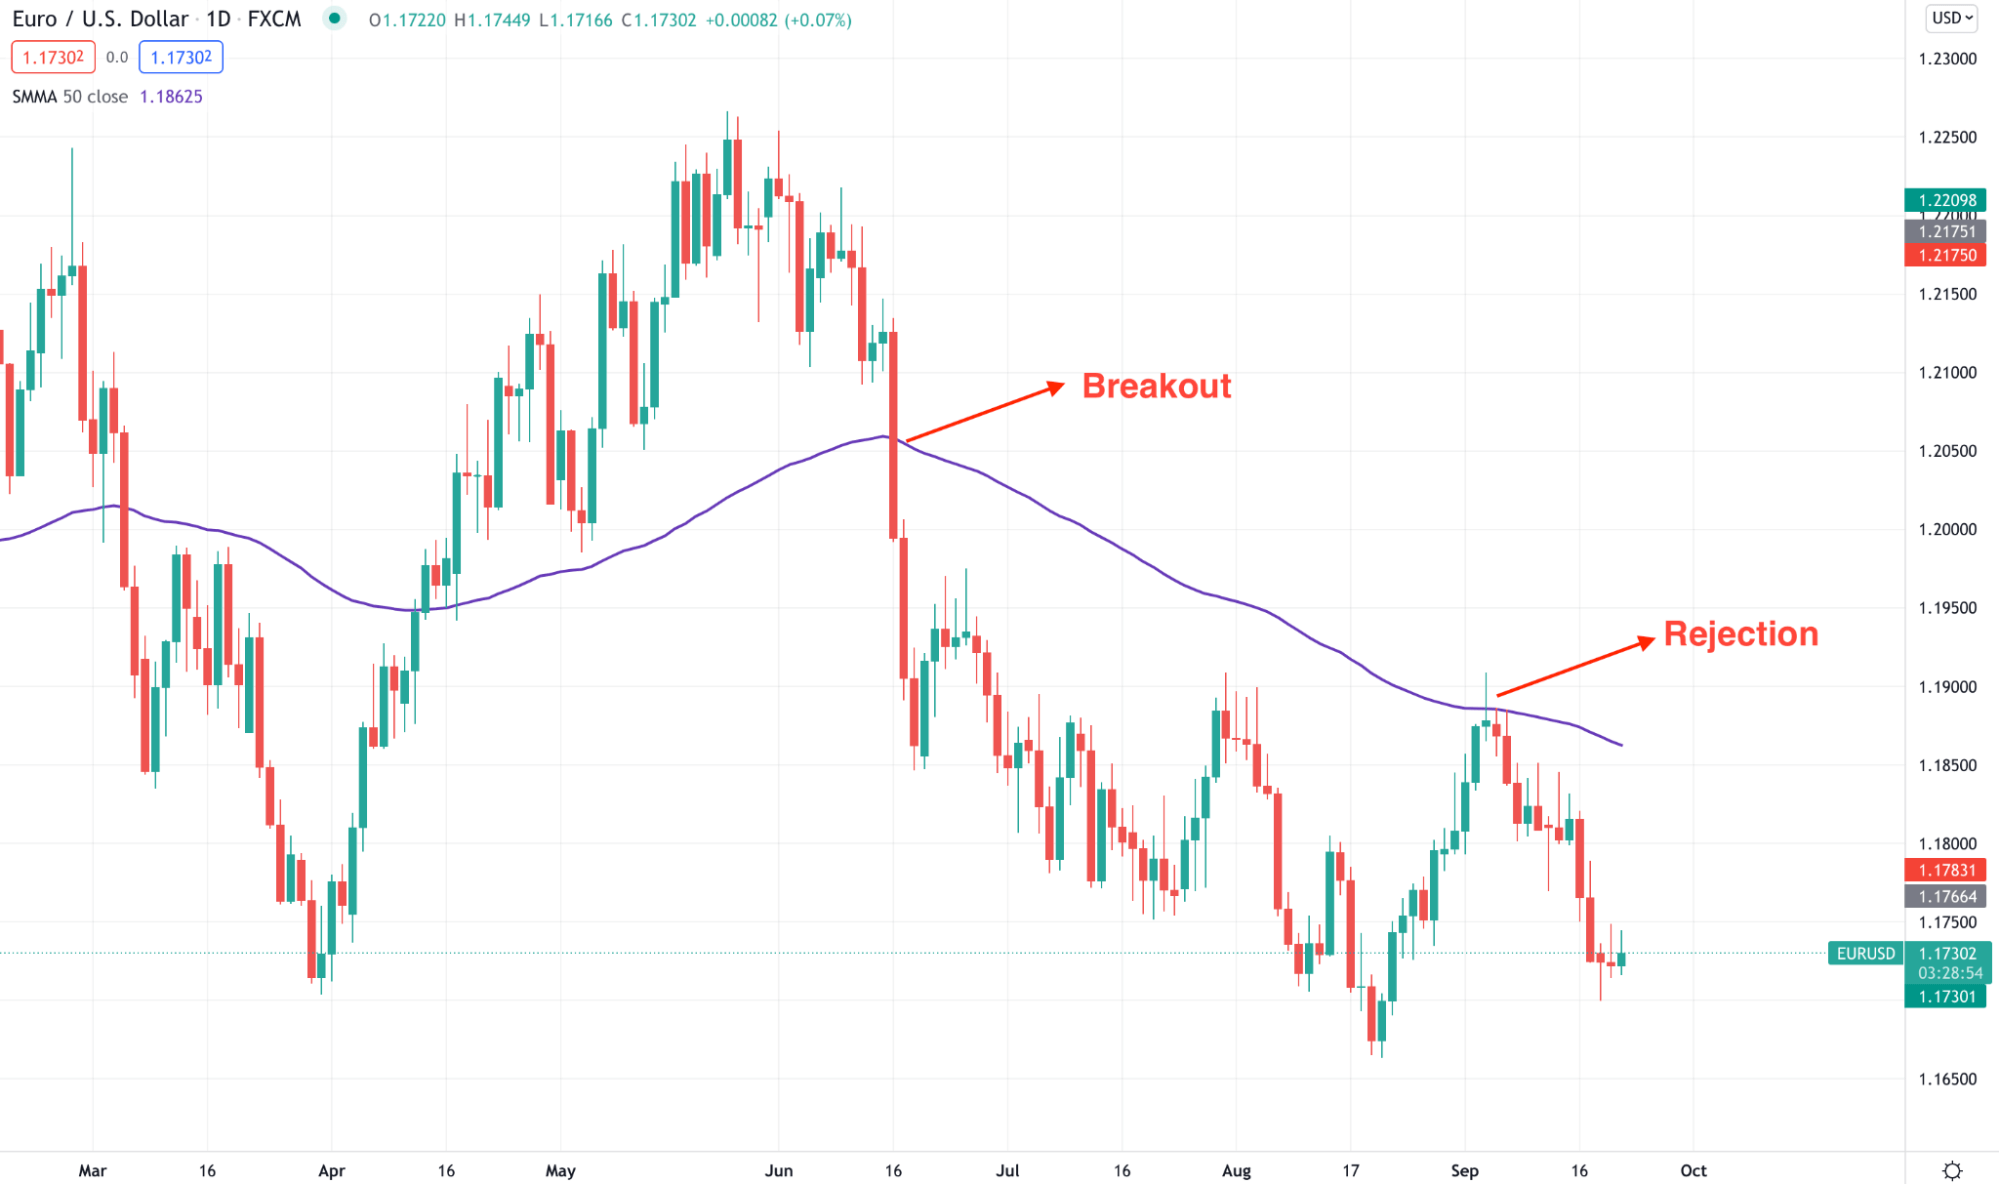
EUR/USD daily chart
Step 5. Use support and resistance levels
Support and resistance show the history traders’ emotions. If buyers become weaker and sellers reject them from a resistance level, the price will likely do the same when it reaches that level again.
A similar concept is applicable on the support level, where a rebound or breakout provides a good trading opportunity. Let’s see an example of the support and resistance from the AUD/USD chart.
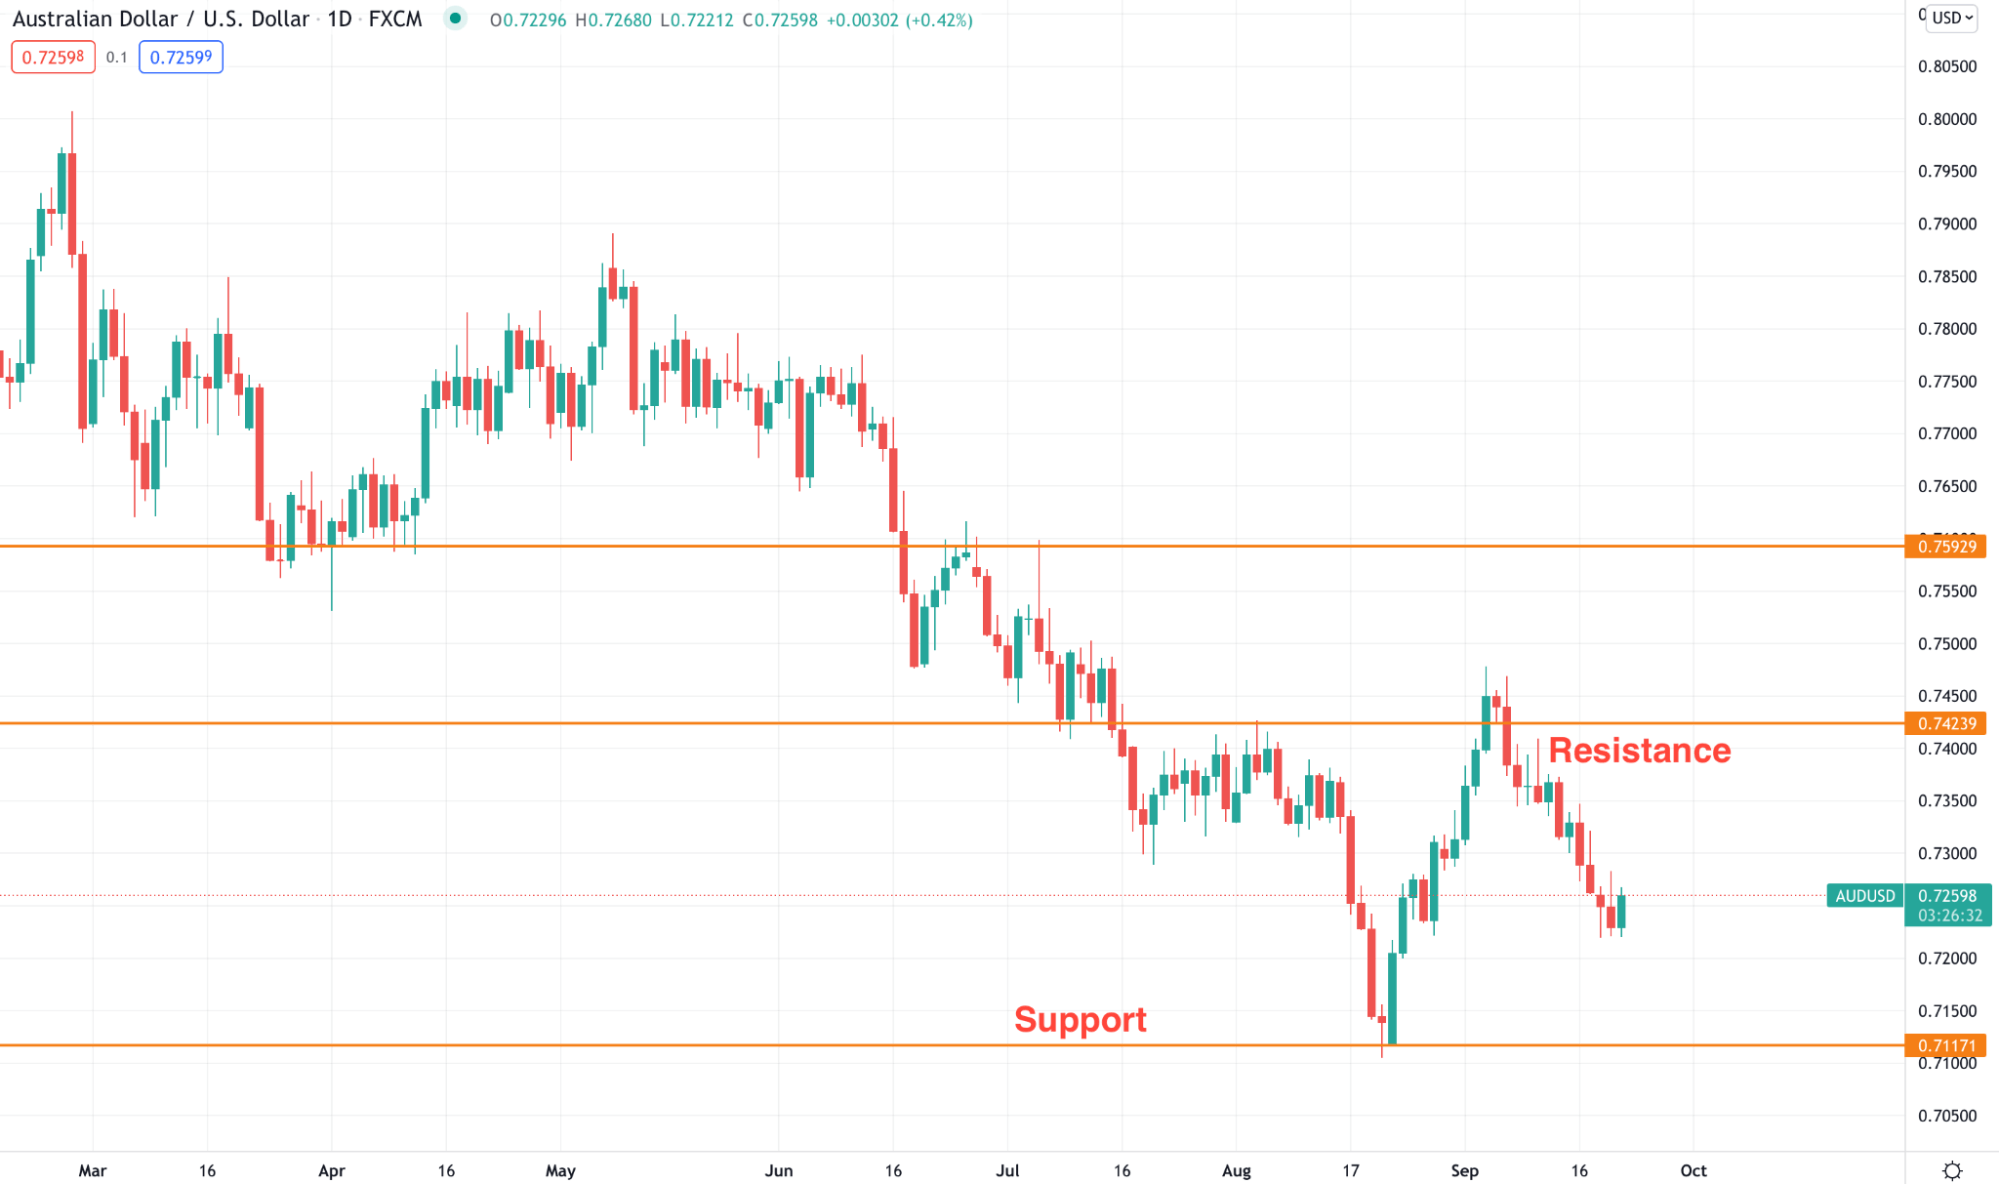
AUD/USD daily chart
Final thoughts
In position trading, the significant risk relies on trade management. You can earn higher returns from a single trade, but you have to take a more considerable risk. However, the ultimate success in position trading is to find a suitable zone and open the trade once the price reaches that zone.


Comments