Pattern trading is widespread in the financial market, where the flag pattern shows a story about how bulls and bears prepare for the next move. Price action traders usually find this pattern as effective for making breakout trades.
Once the price moves from the flag pattern, it usually shows an impulsive pressure. Therefore, following a flag pattern with price action tools would be a potent weapon on your forex journey.
Finding a proper plan is required for flag pattern trading. You cannot open a trade just by watching a pattern in the chart. The pattern is just a symbol of investors’ sentiment. Let’s look at the details of flag pattern trading in both short and long-term market behavior.
What is a forex flag pattern strategy?
The flag pattern is a random set of candlesticks that has no value in trading until you understand its meaning. Nevertheless, it is a basic way to consider a correction in a trend.
Can you guess what we expect the price to do after a correction? Right, it continues the current trend.
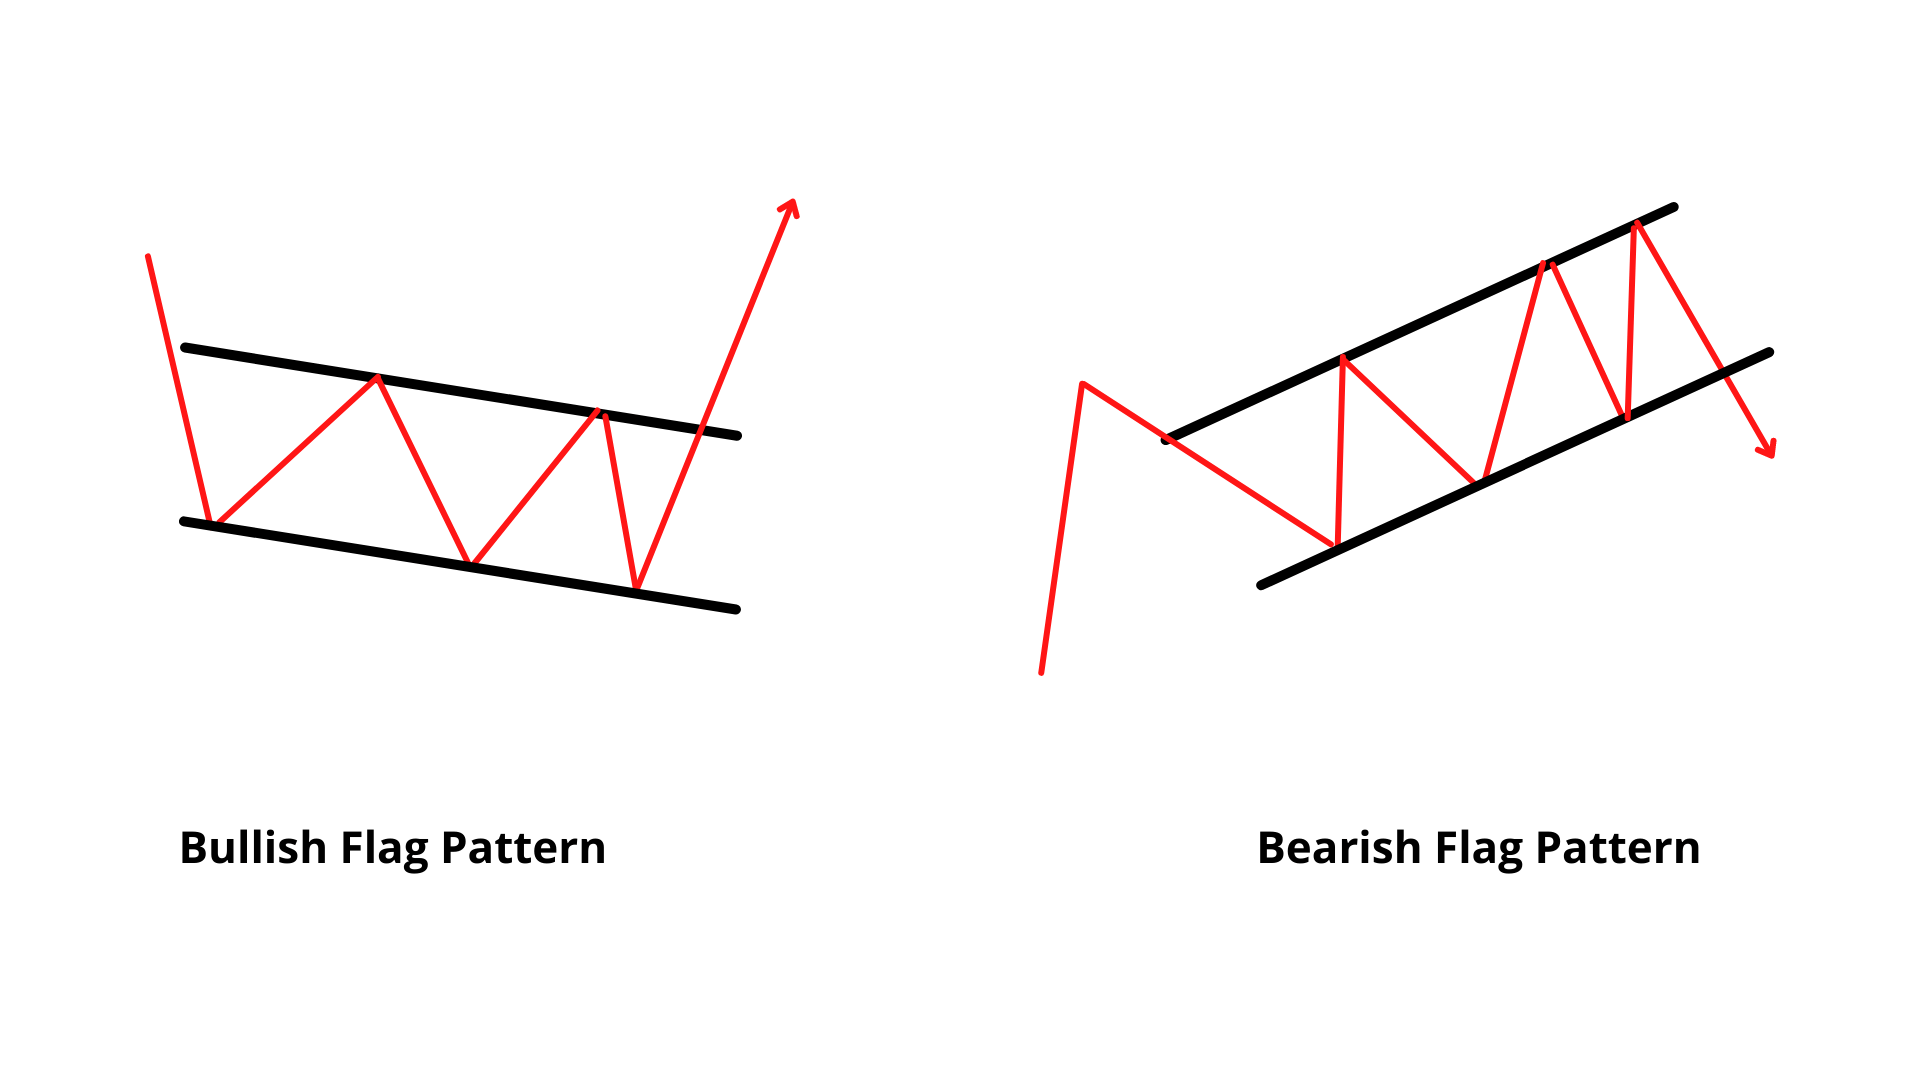
So the ultimate approach of the flag pattern is to find this structure within a trend and open a continuation trade once the pattern breaks out. Moreover, the correction represents profit taking by investors where they close some of their position and keep the rest for further gain. Therefore, the flag pattern is found in bullish and bearish markets, as shown in the image below.
- Trend and trendlines
- Candlestick analysis
- Support-resistance
- Market context
Any trading opportunity with a flag pattern should come towards the trend. Moreover, you should implement candlesticks to confirm the breakout and entry. Finally, the support and resistance levels will tell you about the ceiling of the movement where the market context will expose the probability of a trade. Once all conditions are together, you are ready to name it as a flag pattern strategy.
Let’s have a look at an example of the perfect plag pattern system.

Flag pattern trading
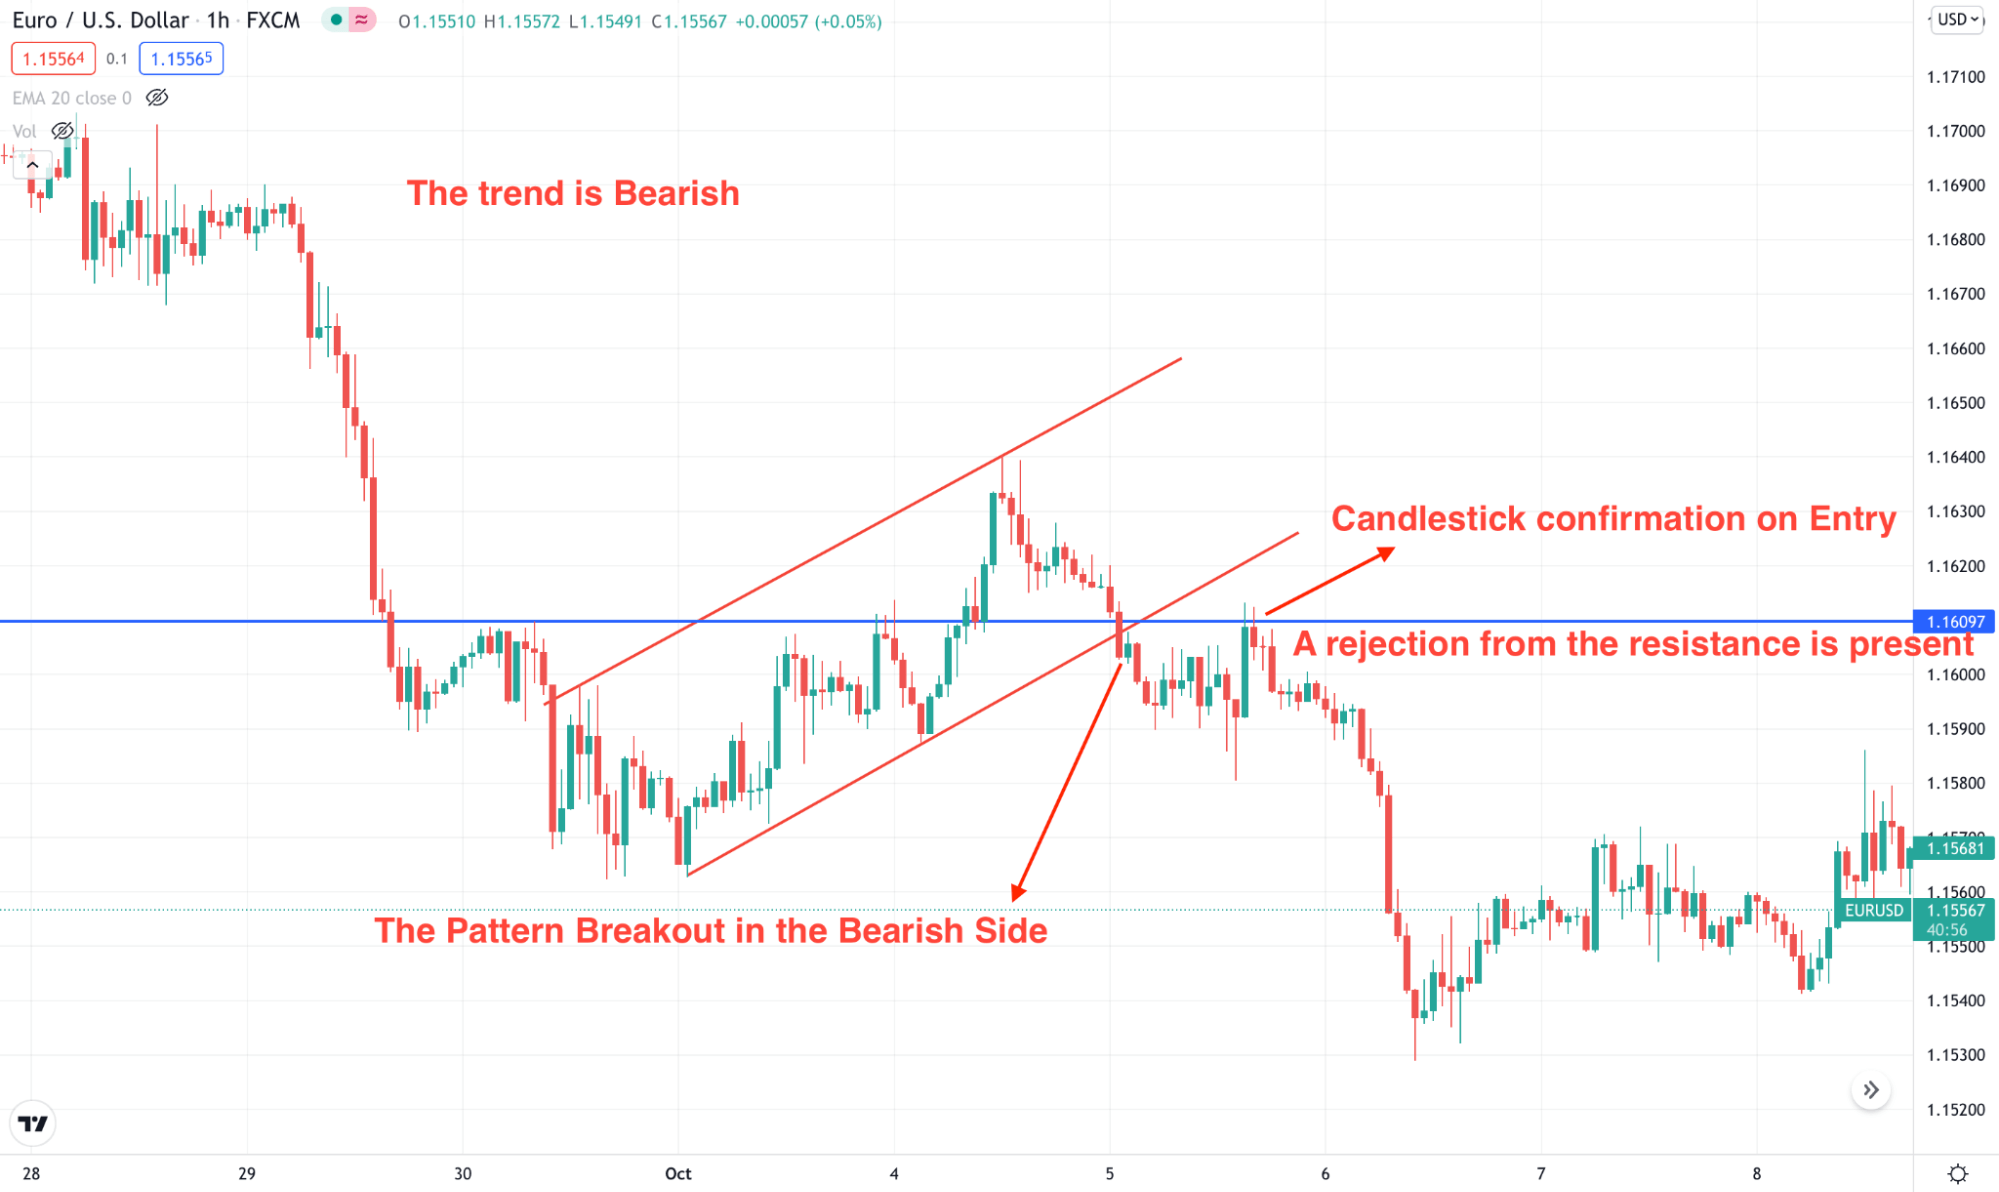
The above image represents the hourly chart of EUR/USD, where the price faced a bearish breakout from a flag pattern where the overall market trend was bearish. Moreover, the trading entry becomes valid once the price corrected higher after the breakout and shows rejections from the resistance.
Why is the forex flag pattern strategy worth using?
The flag pattern is a random set of candlesticks that has no value in trading until you understand its meaning. Nevertheless, it is a basic way to consider a correction in a trend.
Can you guess what we expect the price to do after a correction? Right, it continues the current trend.
So the ultimate approach of the flag pattern is to find this structure within a trend and open a continuation trade once the pattern breaks out. Moreover, the correction represents profit taking by investors where they close some of their position and keep the rest for further gain. Therefore, the flag pattern is found in both bullish and bearish markets, as shown in the image below.

Bullish and bearish flag pattern
So the flag pattern is an effective trend continuation tool that allows price action traders to catch the complete juice from an impulse. Moreover, this element works well in both higher and lower timeframes.
A short-term strategy
In this method, we will find the market direction from the 15M time frame as it is best for catching the market movement from a single trading session. Besides the flag pattern, we will use SMA 50 for getting the overall market direction. Moreover, the basic knowledge of price action and candlesticks are also crucial for this strategy.
Best time frames to use
As it is an intraday trade, we will stick to the 15 minutes time frame.
Entry
The trading entry is valid when:
- The trend is confirmed.
- A flag pattern was found, and a breakout happened towards the trend.
- A small correction and a rejection from the near-term level are found.
Stop loss
The ideal stop loss is above or below the rejection candle. In that case, traders should use some gap from the candlestick.
Take profit
You can close the 50% position after getting a 1:1 risk vs. reward ratio. However, you can hold the trade long if the market pressure allows.
A long-term strategy
The long-term flag pattern method is a swing trading idea applicable to higher time frames where traders don’t have to bother about the volatility of intraday. In this trading, the main challenge is to find the long-term market trend.
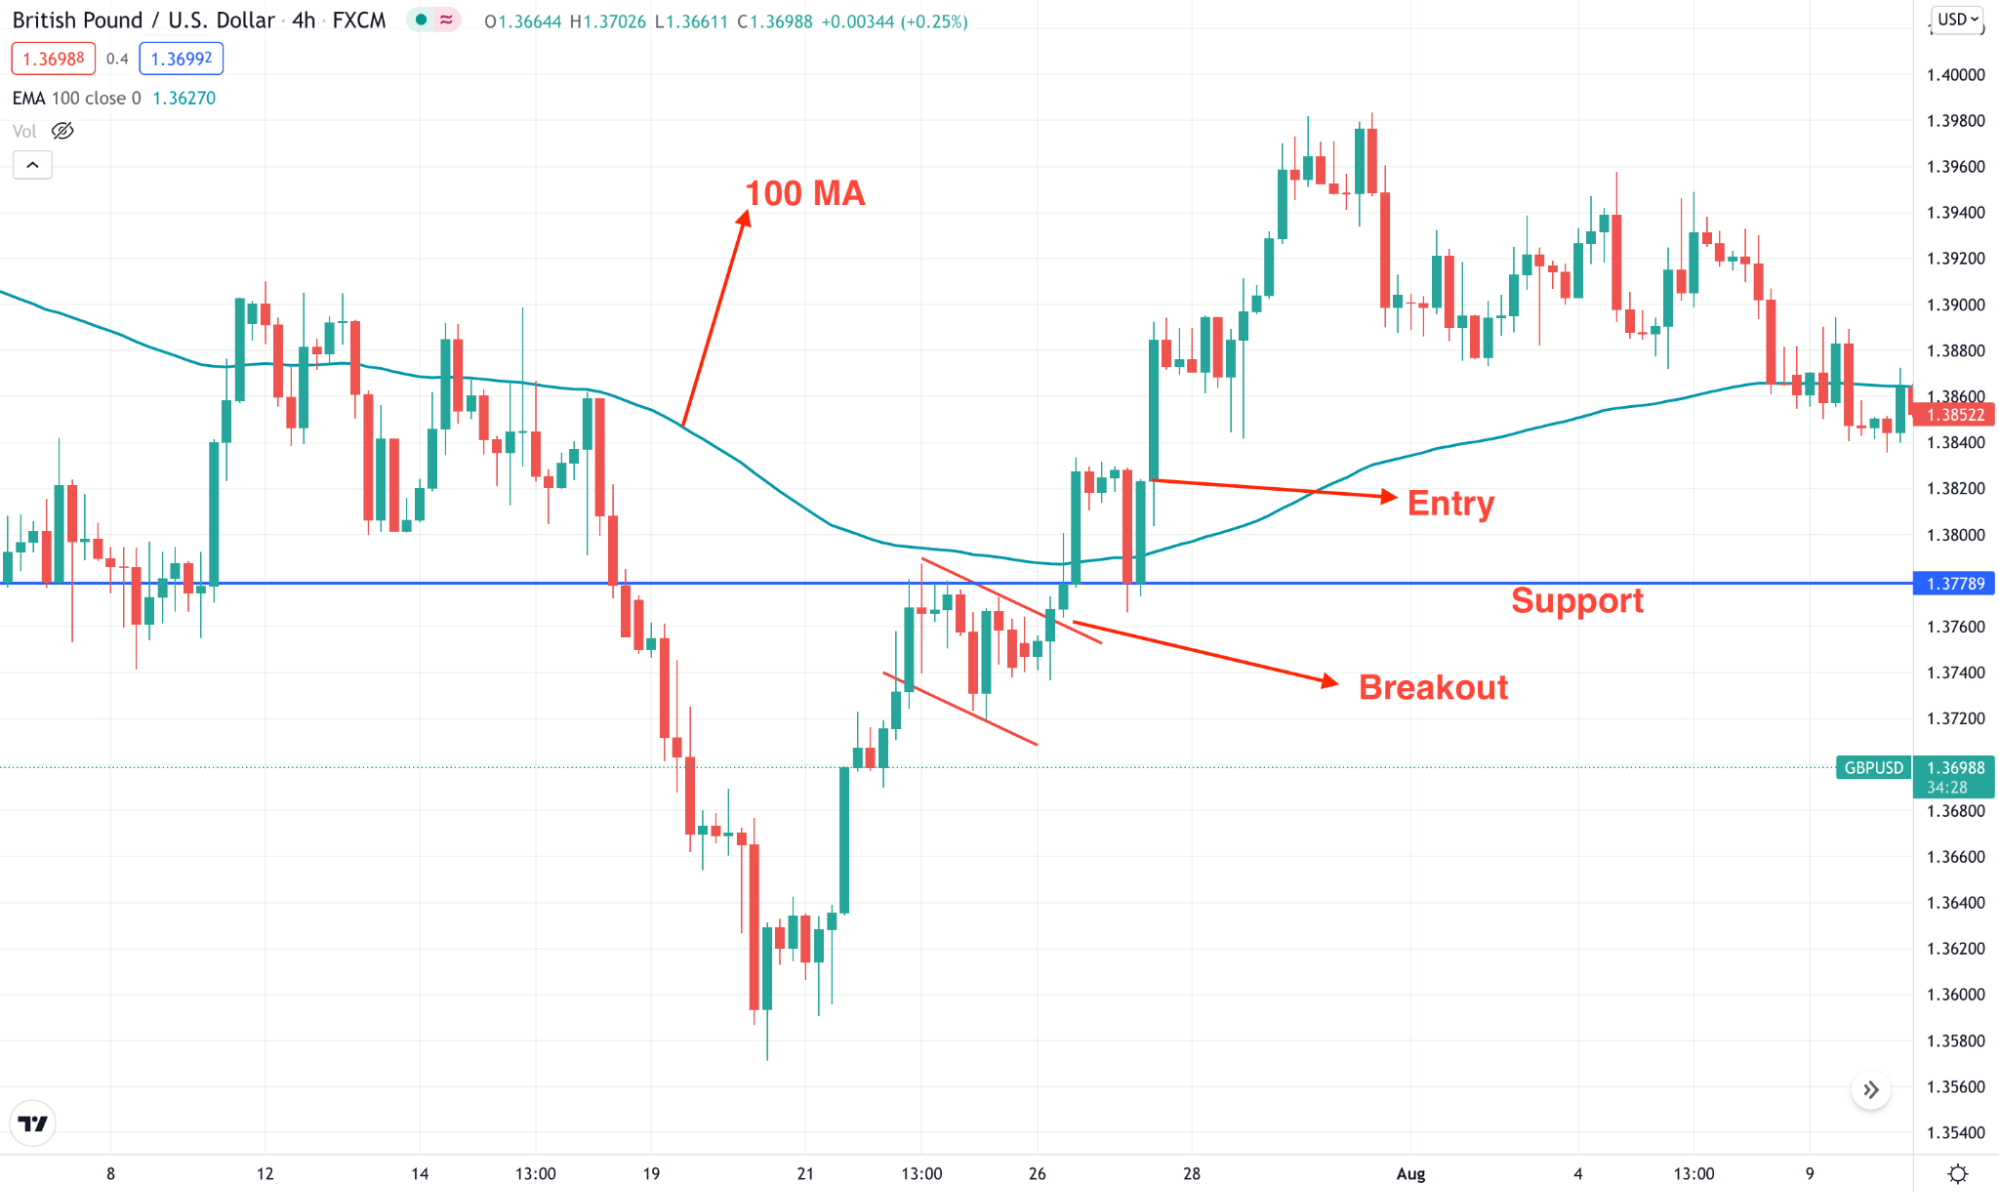
Therefore, we will use vital support resistance levels with 100 MAs to remain within the current trend. Besides, you can use oscillators like MACD or RSI to increase the trading accuracy.
Best time frames to use
As it is long-term trading, you can pick any time frame from four hours to daily.
Entry
- For a buy trade, the price should be above the 100 SMA and for a sell trade, it should remain below the 100 SMA.
- The price is above any important support level for buy and below the resistance level for a sell.
- A proper flag pattern appeared, and the price broke out towards the market trend.
- After the breakout, a correction and retest of the near-term level confirms the entry.

Long-term strategy
Stop loss
You should set the stop loss based on the near-term swing level. However, you can set the SL at the rejection candle if you agree on an aggressive approach.
Take profit
You can close the 50% position after getting a 1:1 risk vs. reward ratio. However, you can hold the trade long if the market pressure allows.
Pros and cons of the forex flag pattern strategy
Let’s see the pros and cons of the flag pattern trading system.
Pros |
Cons |
|
|
|
|
|
|
Final thoughts
The flag pattern is a popular trade method that works well in any financial market, and traders can easily combine this tool with other price action materials. However, although this method is highly profitable, a vital precaution is required for every trade.
Therefore, trading primarily with a robust money management system is the primary requirement for this method. Moreover, investors should closely monitor how economic news is released while trading short-term trades.


Comments