
Every trader depends on one or the other strategy to win the market, and they are always keen to figure out ways to improve their technique. Whether you are a scalper, day trader, swing trader, or positional trader, you will always need a backtested strategy.
If you use indicators to trade and not price action, you probably might not be aware of the break and retest strategy. But you are probably reading this article because you might have used many indicators, EA, robots, and it did not go well; or you want to make your strategy more solid and accurate.
Let’s learn the break and retest strategy. It is one of the most powerful that works almost all the time, which will make you a better trader in all the terms, namely technical analysis, risk management, and discipline.
What are break and retest?
An asset’s price can move in one direction for an extended period, but this one-sided movement has to end, and a new trend has to start sometime. A break is referred to a condition when the price has been supported by support, resistance, trendline, or a channel for the time being, and finally was able to pass through that zone.
The break can be of two types:
-
Breakdown
When the support is holding the price, and the price breaks it by downwards movement from down moving up.
-
Breakout
When the resistance is holding the price, and the price breaks it by upward movement from up moving down.
The retest is when the price comes back and re-examine or respect that particular broken support, resistance or trendline. It is the same for both the breakdown and breakout.
How to trade break and retest?
Use a top-down approach to trade this strategy.
- First, you will draw your support, resistance, and trendlines on a 4hr time frame (TF).
- Then you will be moving to 1hr TF to look for the rejection and 15 min or 30 min TF for taking the trade.
Below are the examples that you can follow if you see similar setups on your chart.
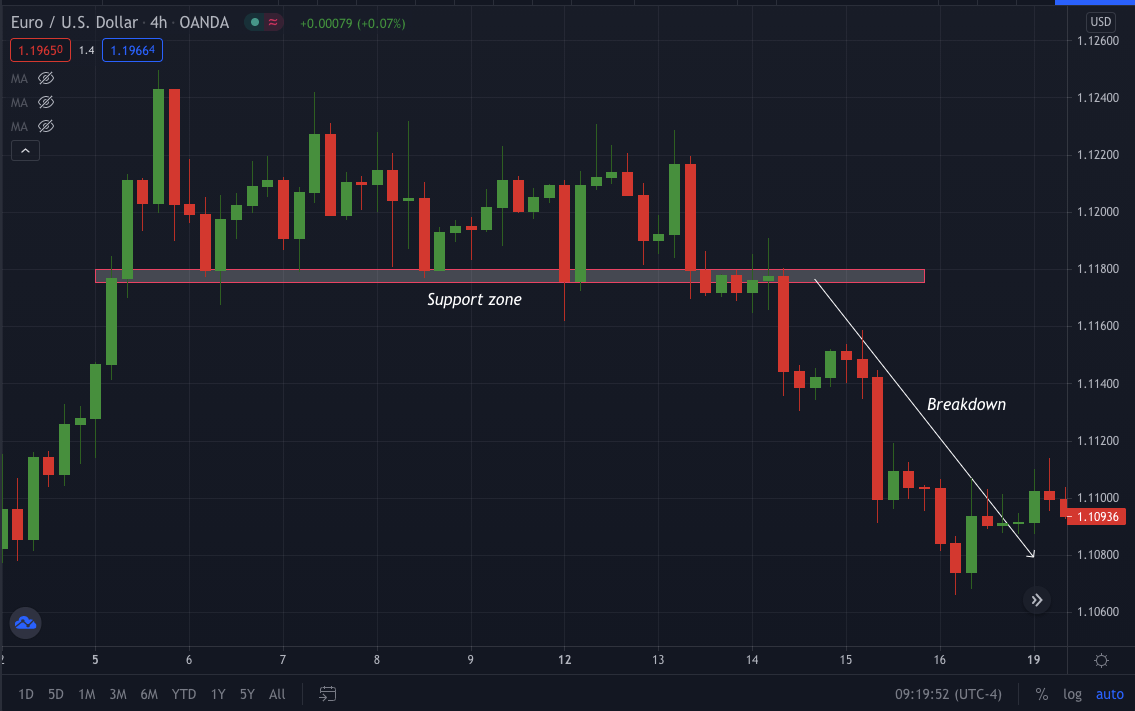
The below EUR/USD chart shows the price respecting the support zone. Moving forward, you can see a long bearish candle formation violating the support and price moving down.
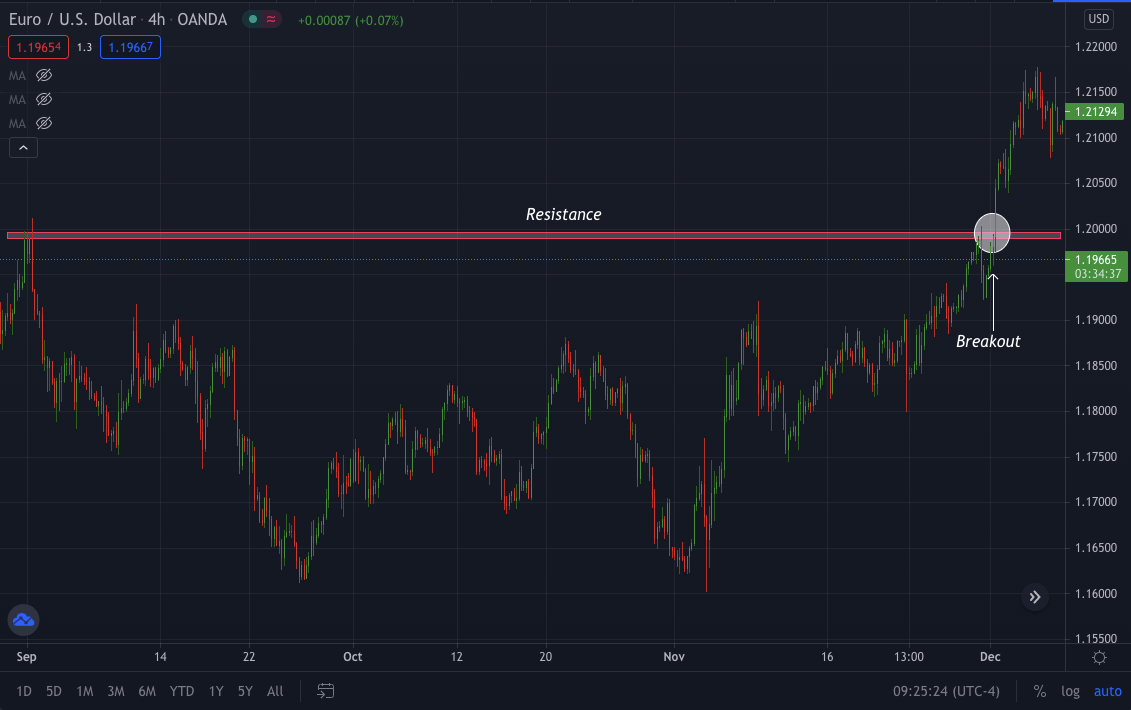
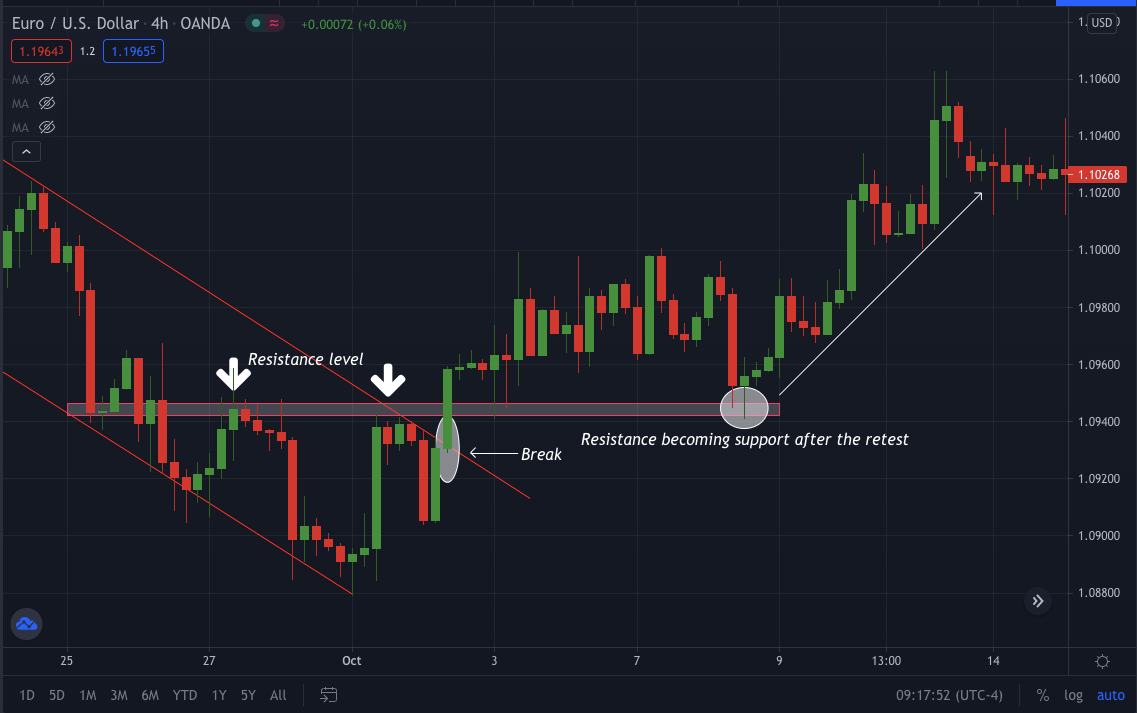
The below EUR/USD chart shows the price respecting resistance zone. Moving forward, you can see a long bullish candle formation violating the resistance and price moving up.
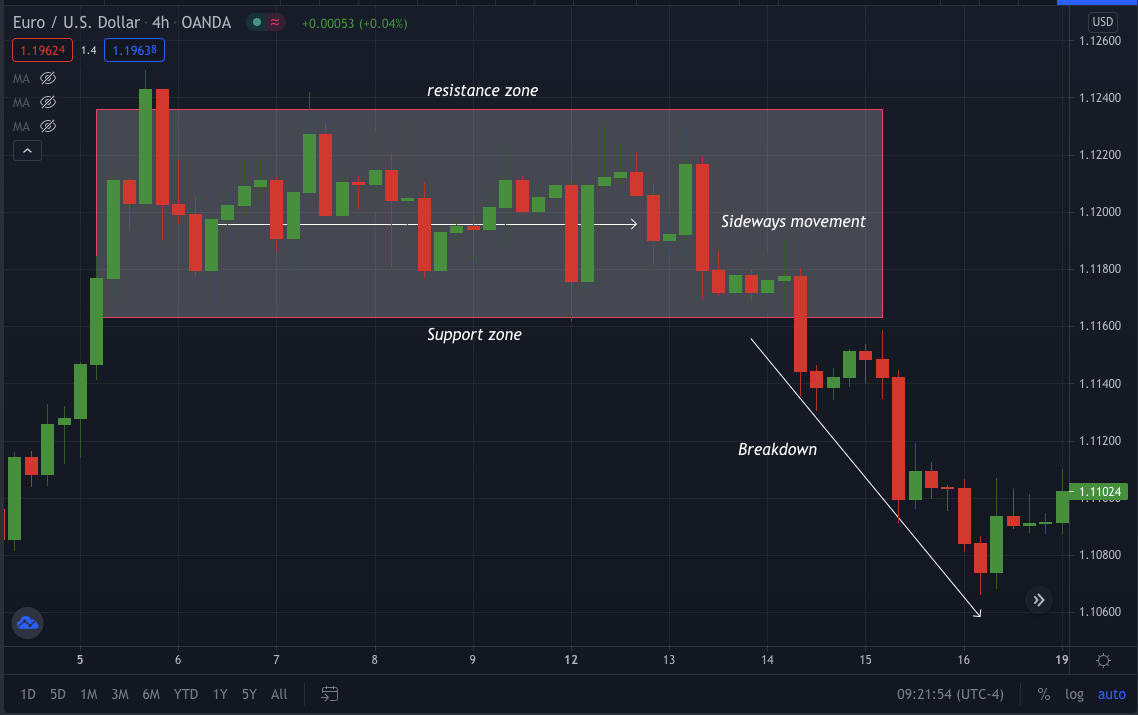
While trading in a choppy/sideways market, you need to be extra conscious as the price can continue in the direction or may reverse. Here, first, you will use 4hr TF and look if the price is moving sideways; that is, the price is constantly moving between support & resistance.
If you see any asset with a similar setup, you will wait for the price to either breakout moving up or breakdown moving down.
Retest
Retesting is simple to understand; once you see an asset’s price breaking any zone, you may choose to wait for the retest of that particular break zone. You will highly increase your risk by rewarding and getting accurate signals for buying or selling.
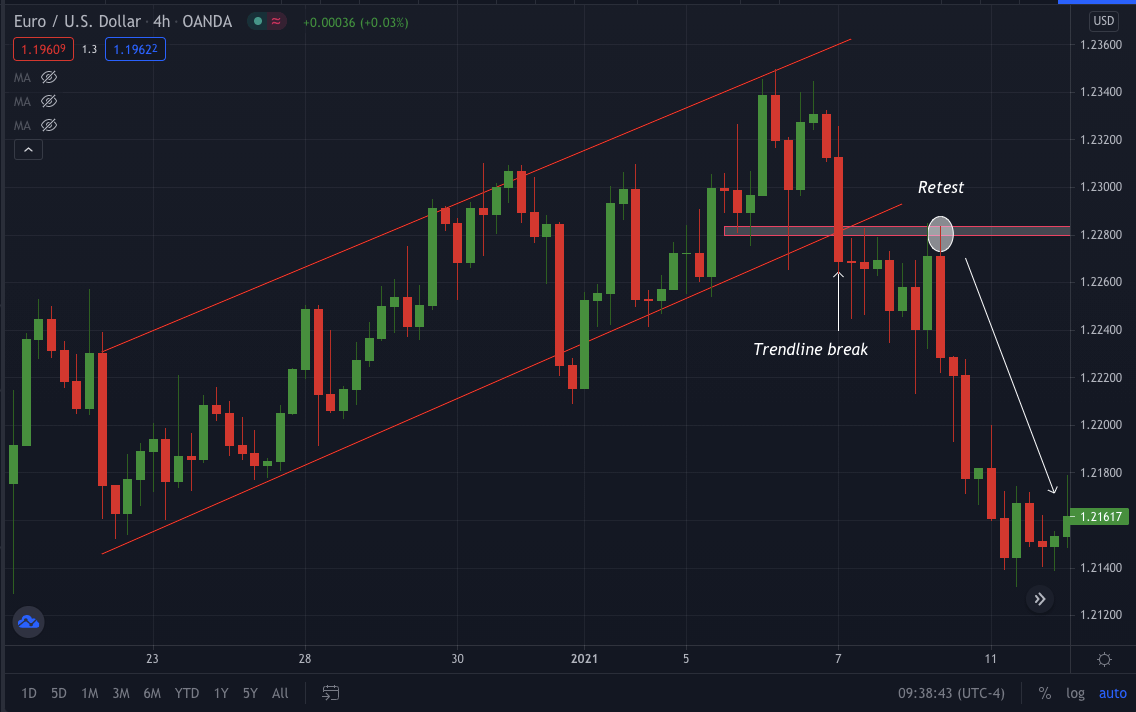
Below EUR/USD shows a trendline breakdown and then retest.
If you choose to trade break and retest setup using an indicator, you can do that, but it won’t be too effective and require basic price action information.
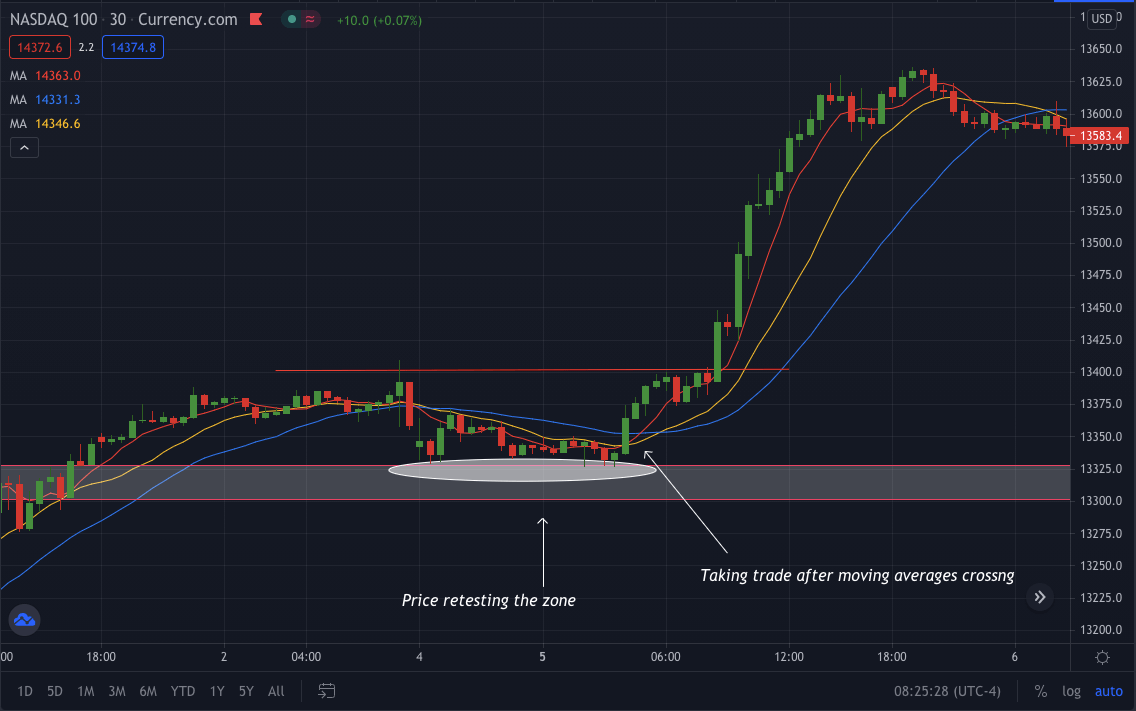
The below Nas100 chart shows three moving averages crossover. You will be using simple moving averages of periods 14, 6, and 26.
- You will be taking trades when 6 SMA will cross 14 SMA.
- If the 6 SMA crosses the 14 SMA moving from bottom to up, that signifies a buying signal.
- If the 6 SMA crosses the 14 SMA moving down from up, it indicates a selling signal.
Also, you have to make sure the 26 moving average moves in the same direction as the crossover.
Below EUR/USD shows a trendline breakout and then retest.
 Limitations
While trading this strategy, you need to wait for an extended period for the price to reach specific support, resistance, or trendline zone and then break followed by a retest of the particular broken zone. However, the wait will be the most challenging part because it’s easy for traders to master the strategy but hard to be patient.
Many traders choose to trade the break and not wait for the retest; that approach also has pros and cons.
Let’s say you took the trade as soon as you saw the price-breaking support, resistance, or trendline and saw the price never came for the retest. Here if you had waited for the trades, you would have missed the trade. But if the price would have retested the zone after the break, you missed a reasonable risk: reward ratio.
Final thoughts
Any trader can use the break and retest strategy with price action alone or by using indicators. Trading any market when it has volume is probably the best time to trade.
Price action has some disadvantages in that it won’t determine the volume in the market. Too little volume is not a good time to trade, while too much volume is risky. However, combining both price action and indicator will give a more accurate trading setup.


Comments