There is no alternative to considering simplicity in the FX trading strategy. However, if you use too many indicators and make the chart messy, you will not get the maximum benefit. Moreover, using too many conditions may confuse you, and you will not get sufficient trades.
On the other hand, a simple trading strategy with market context can give you what you need to see in your trading history. The following section is for you if you like to have a higher amount of taking profits and a lower amount of stop losses in your trading portfolio.
Let’s discuss a simple forex strategy that works every day. It is backed by strong logic and a previous record of providing profitable trades.
Price action signals & horizontal levels
Now we will see the power of simplicity in forex trading. You will not be confused by too many candlestick names and indicators. Rather, we will use a simple pattern with market context to define what is happening in the broader market.
At first, we need to identify the trading direction by looking at the higher time frame. Mark important horizontal areas from where a significant market reversal happened.
For example, you can move to the weekly chart of EUR/USD and mark tops and bottoms as shown in the image below.
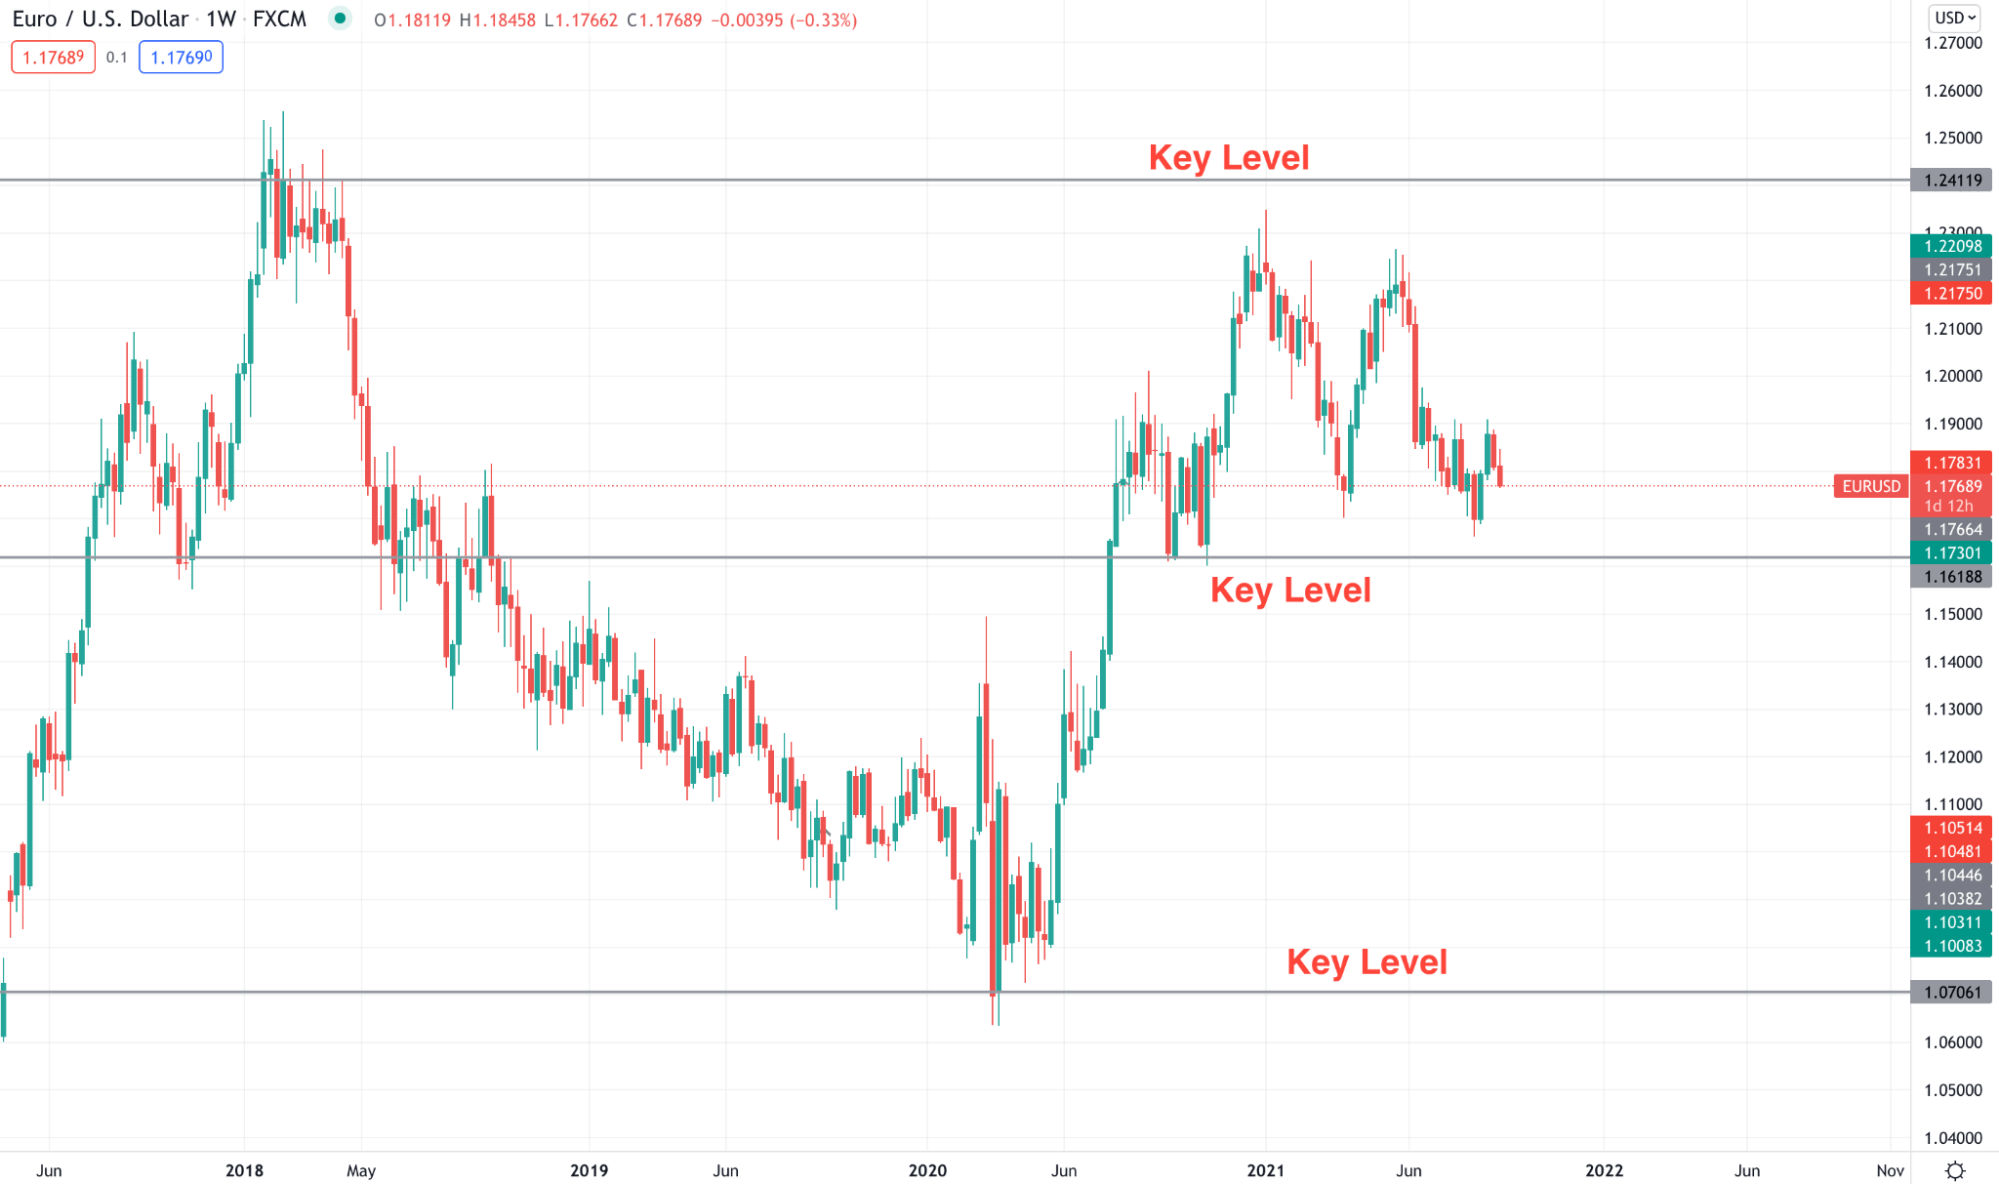
EUR/USD weekly chart
In the above image, we can see three important levels. Currently, the price is trading above the 1.1730 level, so that we will focus on buy trades only.
After finding the market direction, we will move to the daily time frame and mark important horizontal levels around the current market price. After that, we will use the dynamic 20 EMA to identify the most recent price pressure.
This strategy is very simple as we have to wait for the price to reject any near-term resistance or support zone with an appropriate candlestick formation. Of course, there is no requirement of any specific candlestick formation, but it should be bearish for a sell trade and bullish for a buy trade.
Let’s see an example of how the buy and sell happen from the S/R level.
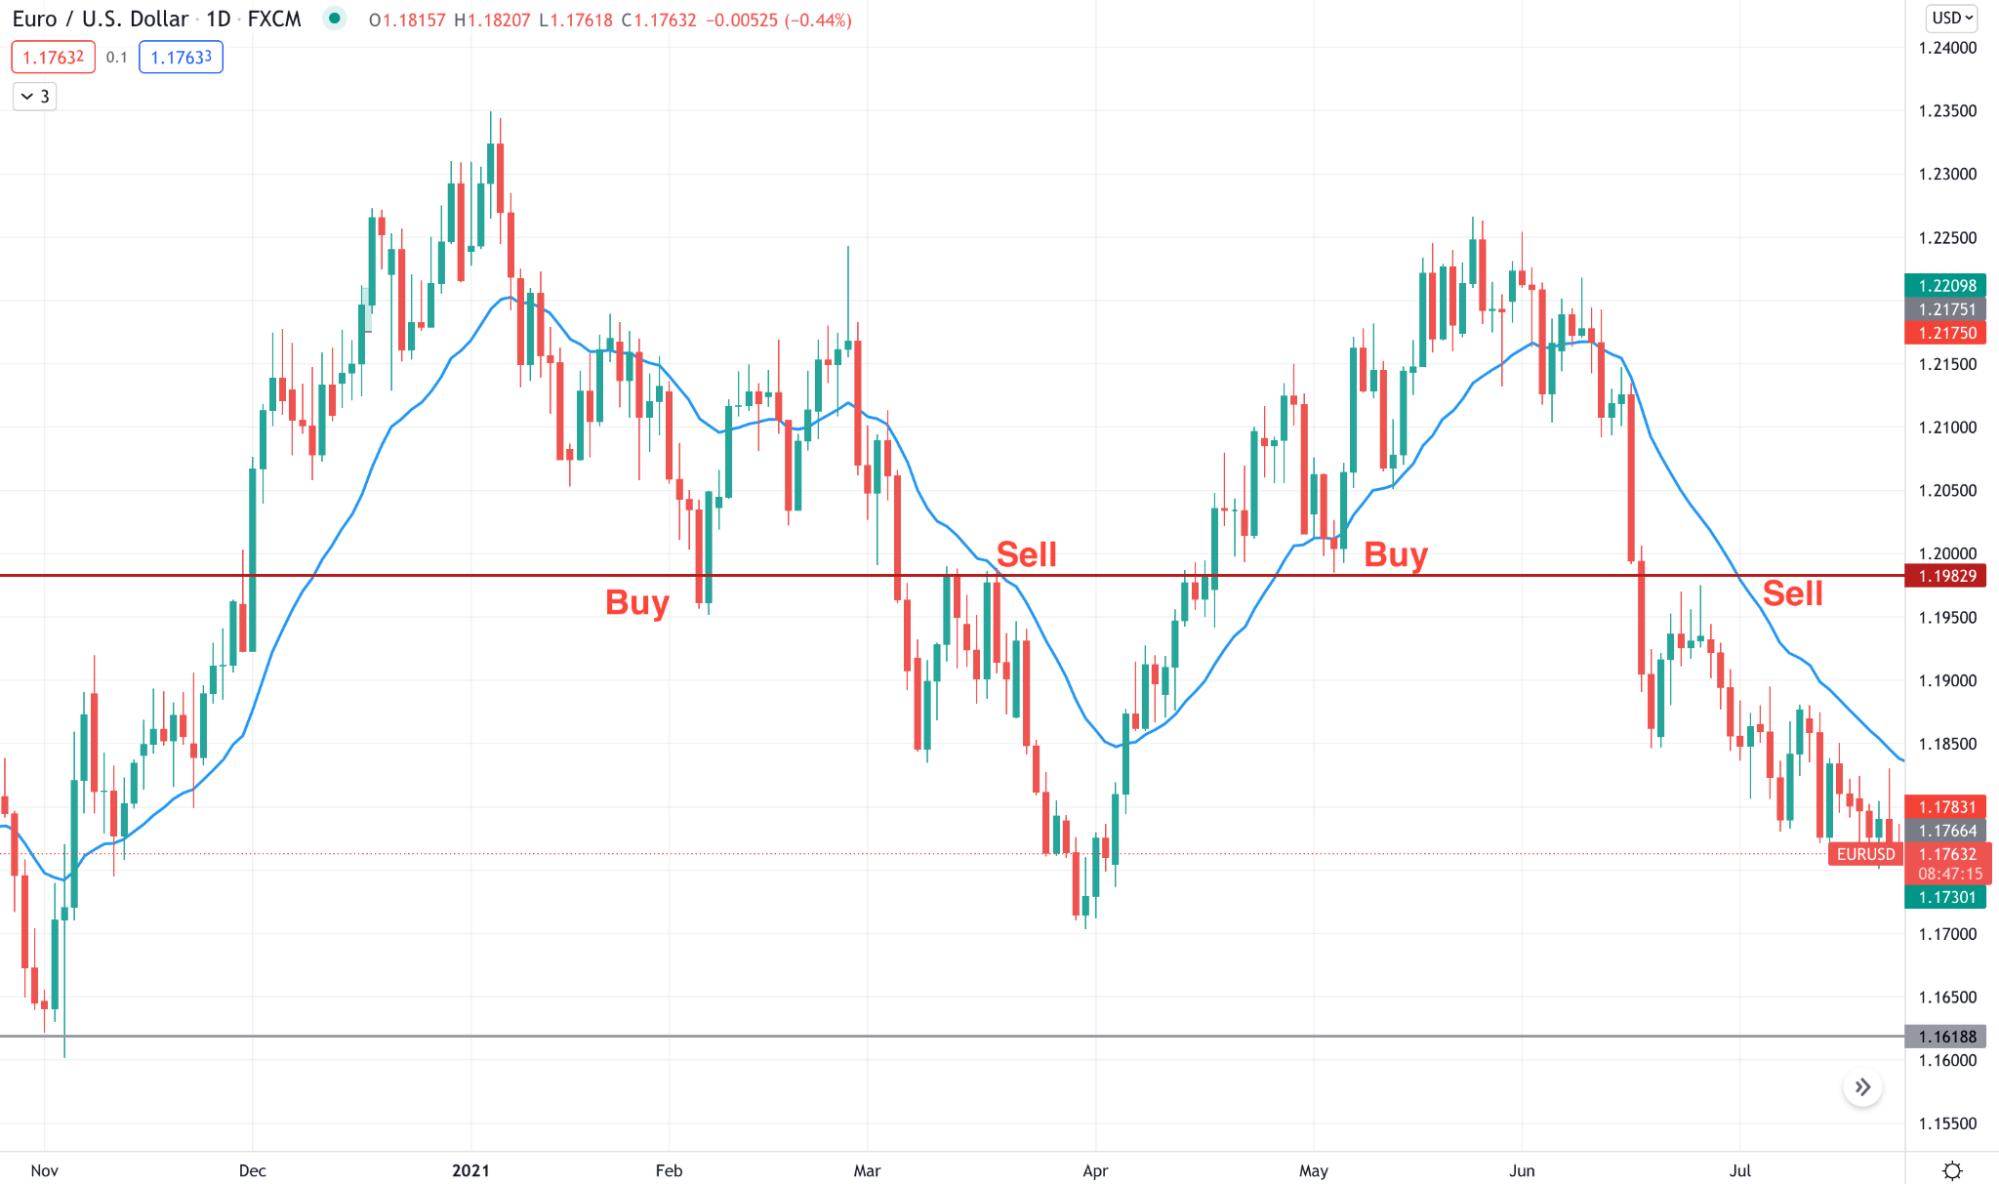
EUR/USD daily chart
The above image shows a daily chart of EUR/USD where the price considered the 1.1982 level as an important horizontal level. Both buyers and sellers are interested in this area, pushing the price up to and down on different dates.
A short-term strategy
In this section, we will see a short-term trading strategy using price action and S/R levels. We will use the multi-time frame concept by observing the market context in a higher time frame and entering the trade on the lower time frame.
Best time frames to use
As it is a short-term strategy, we will wait for an active trading session in London and New York, where most of the liquidity remains. We will find the market directly from the H1 time frame and open trade in 15min.
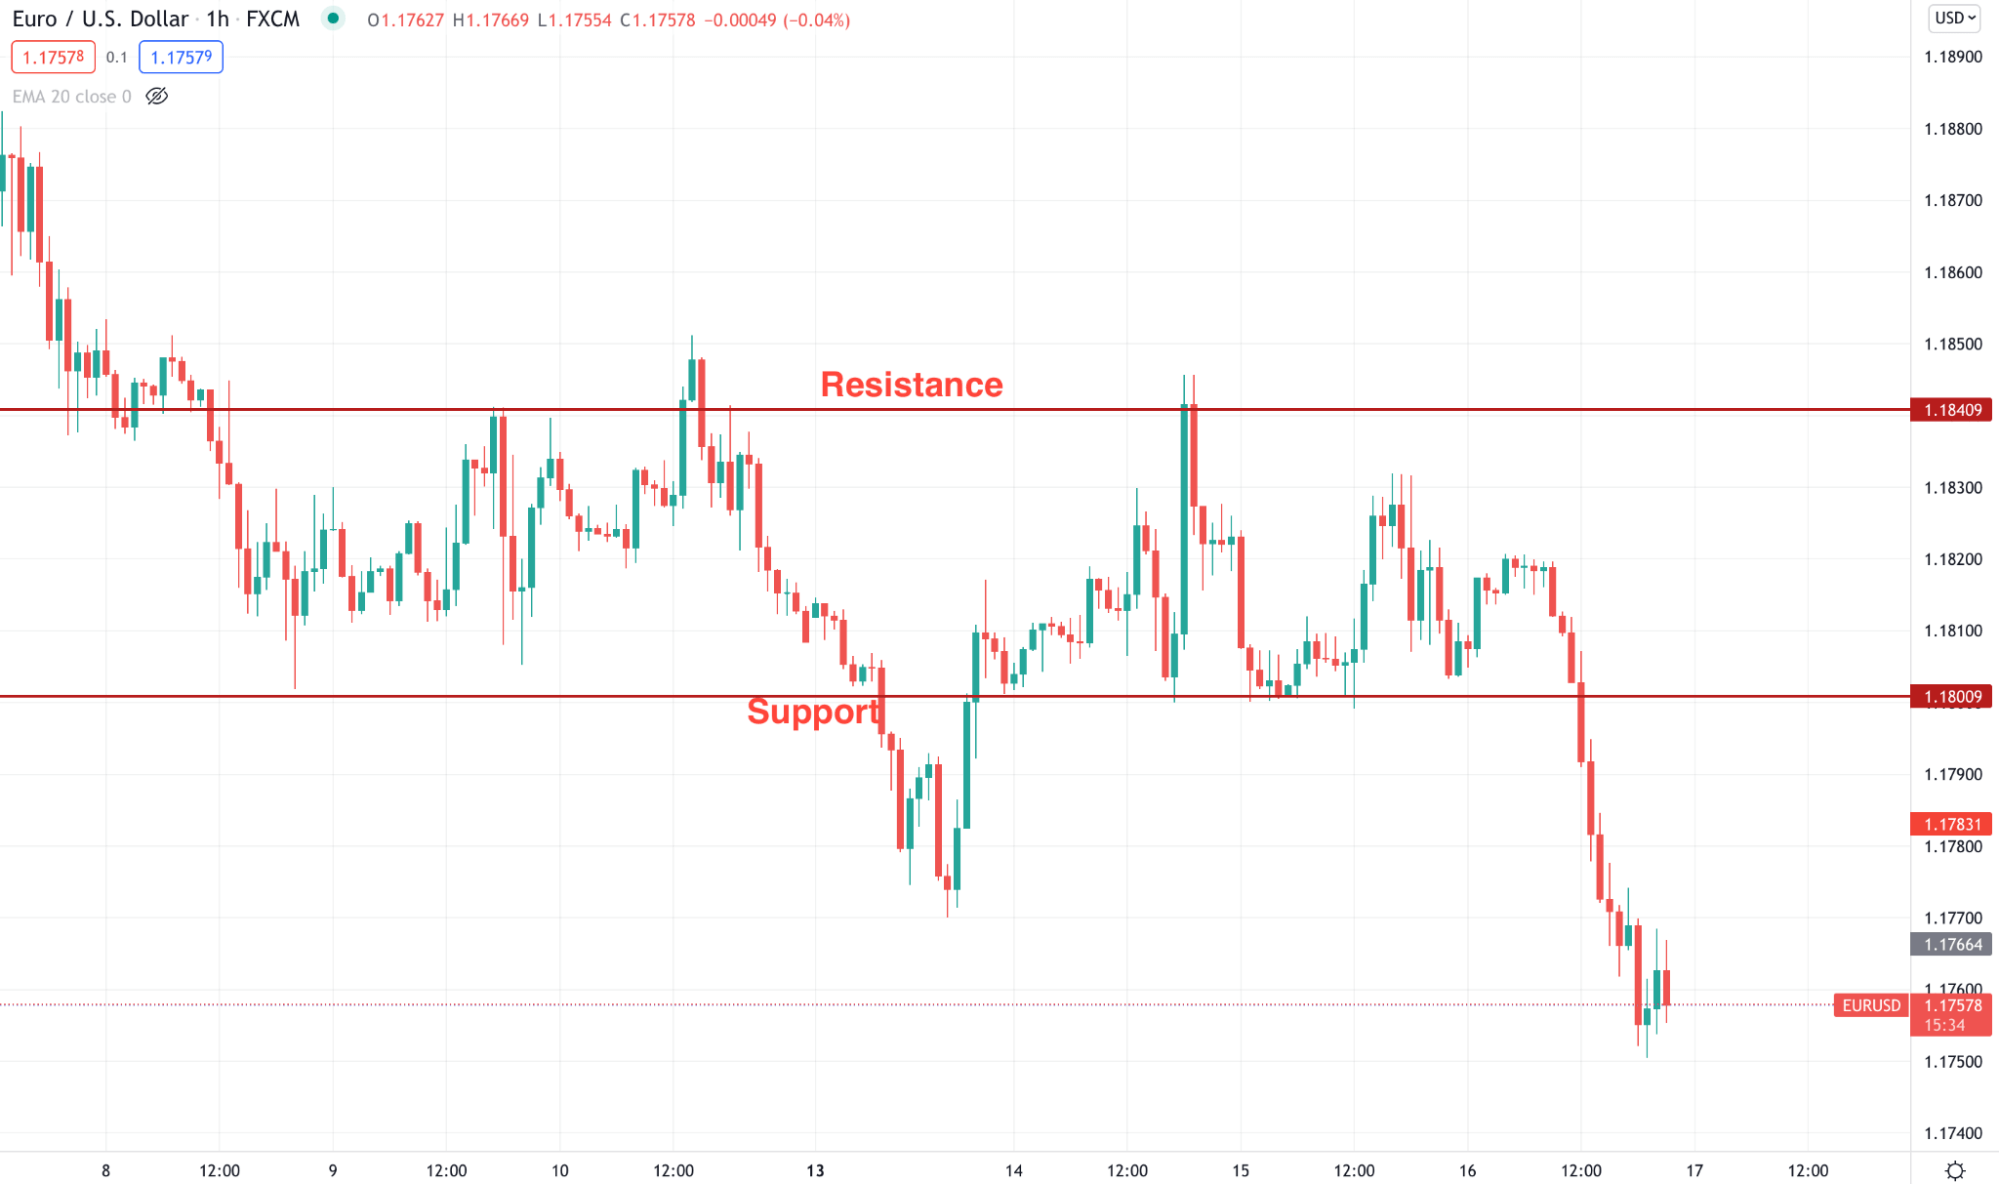
H1 price levels
Entry
Find the price above any important support level for buy or below resistance level for sell. Move to a lower time frame and find an appropriate candlestick pattern to appear. Open the trade as soon as the candle closes.
Stop loss
For sell entry, the stop loss should be above the most recent high with some buffer. Moreover, you can use the most recent candle’s high or low to stop loss, but you need to ensure favorable market pressure.
Take profit
The primary take profit is based on risk and reward. You can have partial closing after getting a predetermined take profit level like 1:2 or 1:3. After that, make the trade risk-free by moving the stop loss at entry price and wait for an appropriate horizontal level to appear and close the trade.
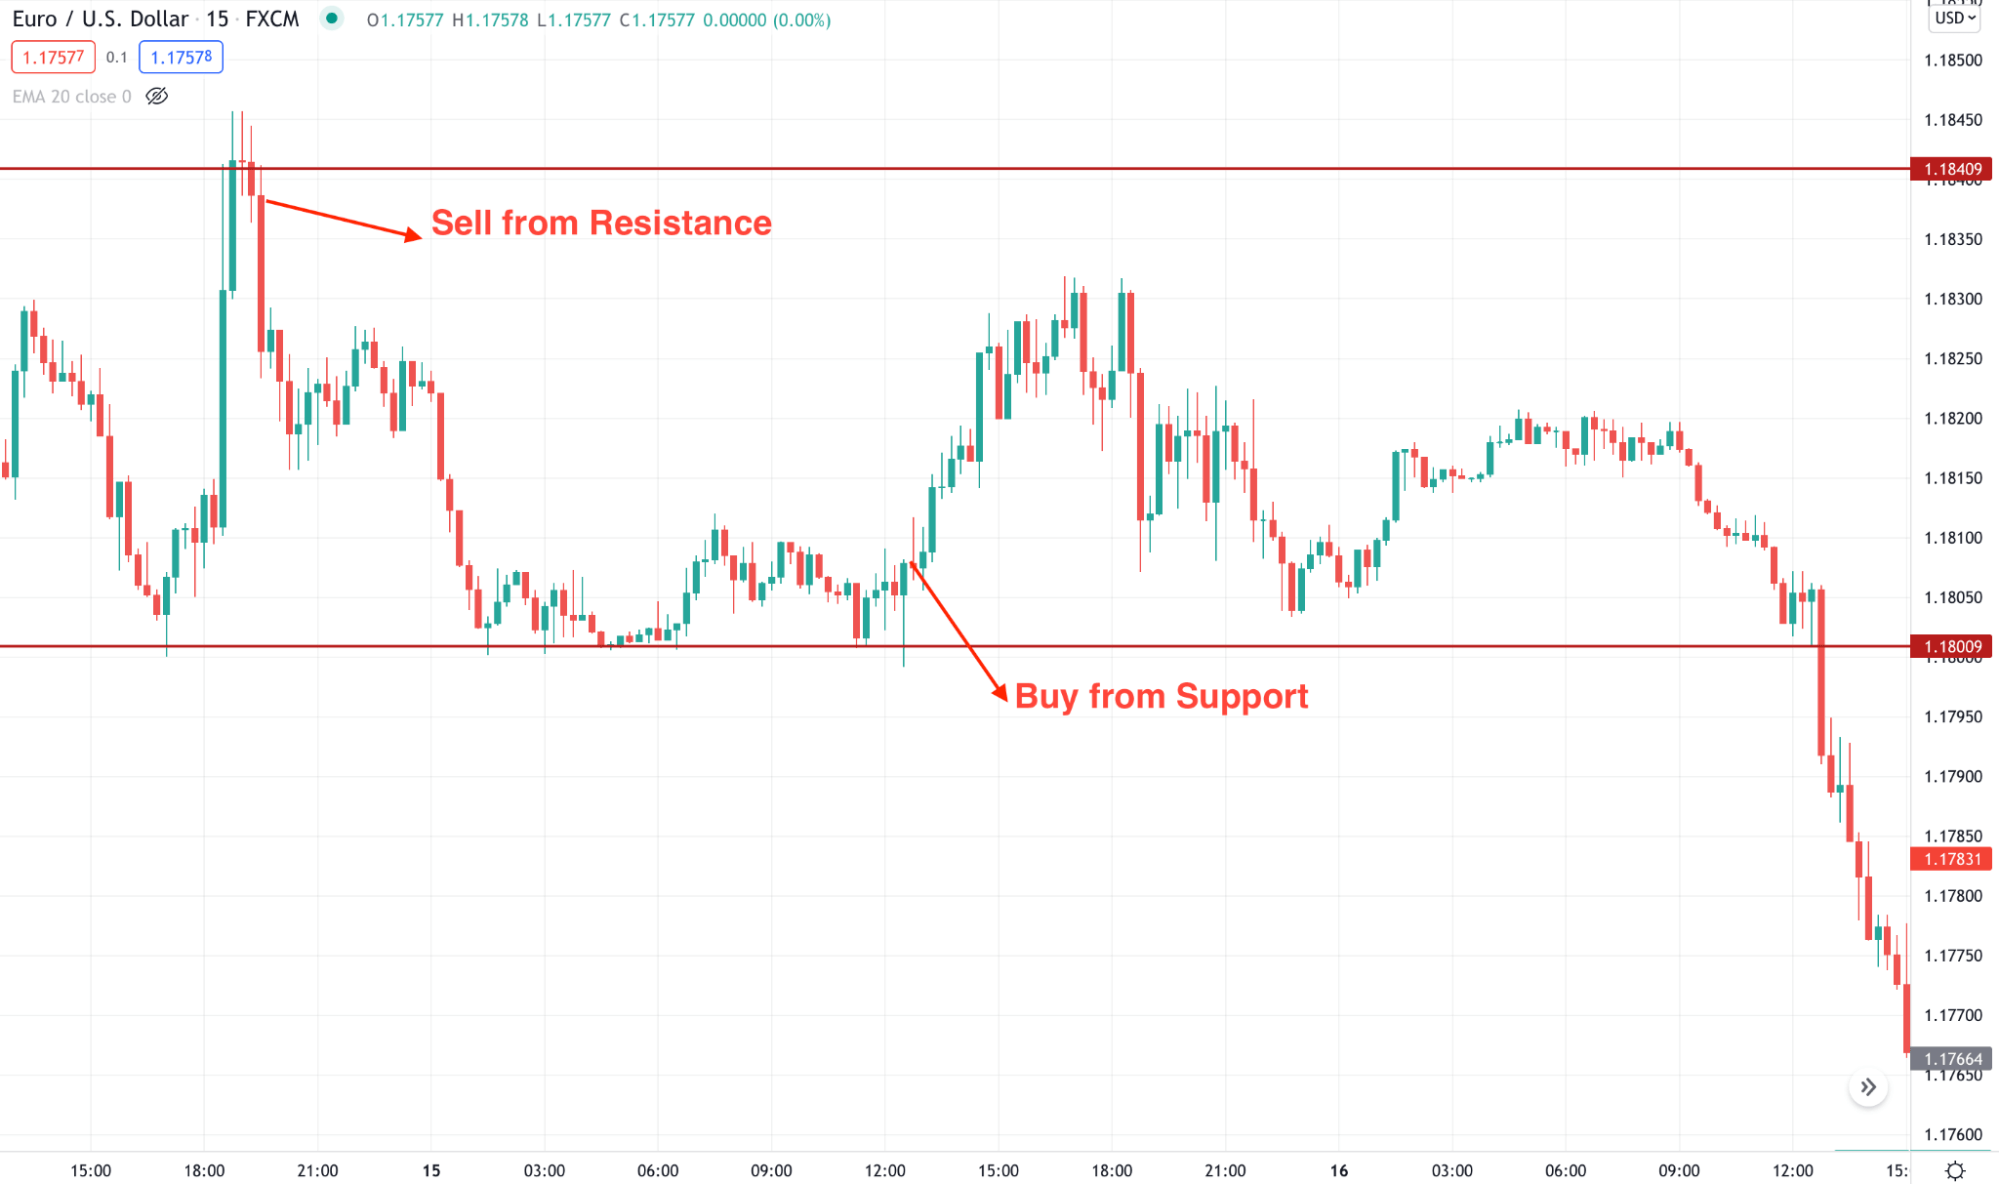
M15 entry
A long-term strategy
When the price forms an essential support or resistance level, it creates a barrier to buyers and sellers. However, long-term levels are more prominent, and they provide more accurate trades. Therefore, it is subject to a vital price direction for short-term and long-term traders once these areas are broken.
Best time frames to use
This strategy will use a daily or weekly time frame to identify the market direction and H4 to open trades.
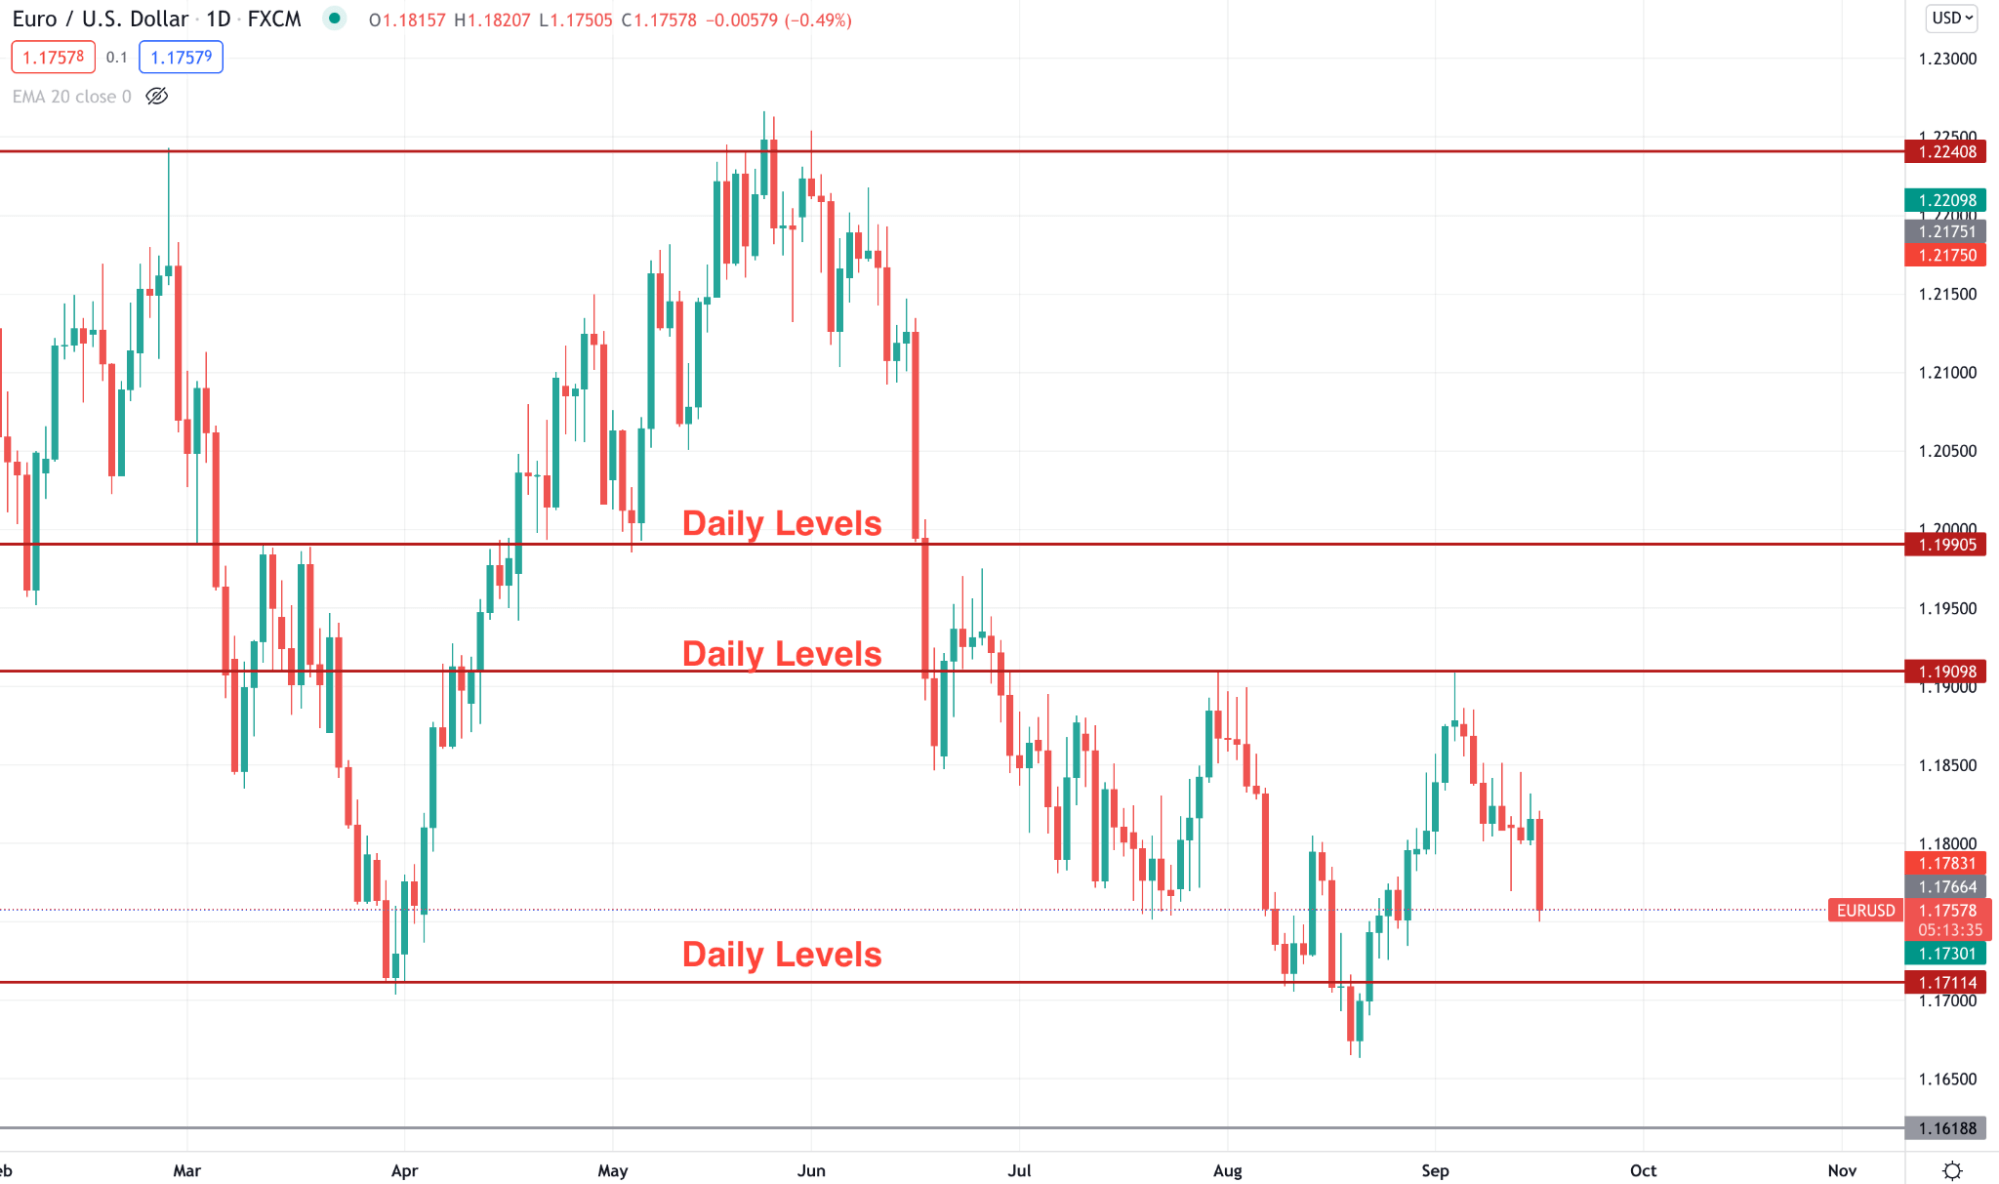
Daily levels
Entry
Find a rejection from horizontal areas and open the trade as soon as the reversal candlestick closes. Any strong long wicked candle may provide highly accurate trades.
Stop loss
The ideal stop loss will be based on the reversal candlestick. Make sure to use some buffer of 10 pips or 15 pips while setting the stop loss.
Take profit
Like the short-term system, close partial trade as soon as a fixed profit is achieved. Later on, you can close the trade manually if the price reaches near any important levels.
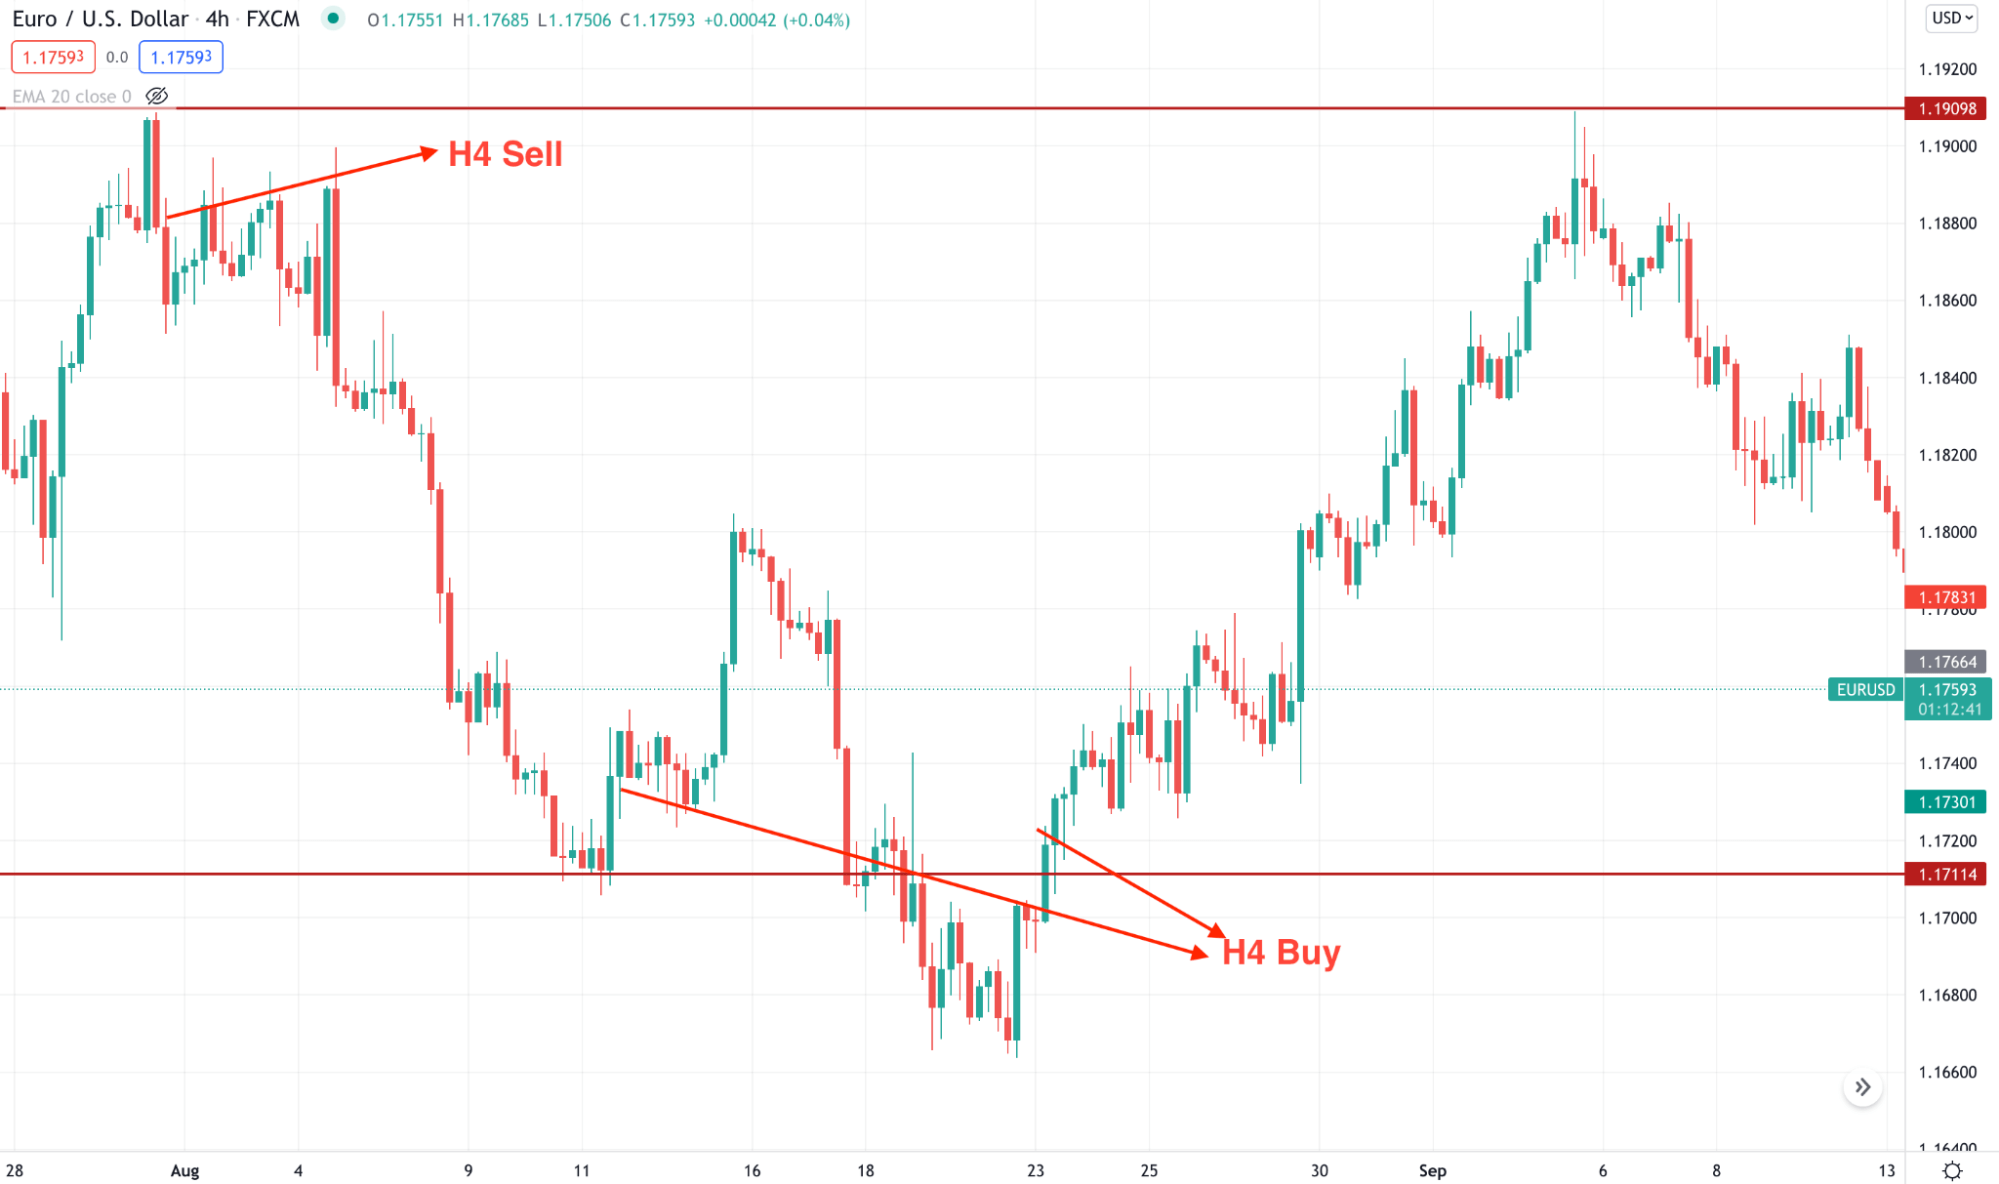
H4 entry
Pros and cons of the simple forex strategy that works every day
Finding the strength and weaknesses of a trading system is mandatory. If you don’t know when to use your system and when to sit back, you may make wrong decisions.
Pros |
Cons |
|
|
|
|
|
|
Final thought
We have seen simple and effective ways to make money from FX trading. You don’t need to master every aspect of the market to earn money from here. Instead, if you follow a simple system and know when to trade and when not to trade, you can be a millionaire by trading.
The simple strategy that we have seen in the above section requires close attention to the price with solid money management. Remember that no system can guarantee you profit. The best result comes from practicing and learning.


Comments