
Every candle carries market information in the forex market. Candlestick patterns allow traders to make consistently profitable positions in the financial market. The pin bar pattern is one of the most popular among market participants in executing trades.
This pin bar pattern gives both reversal and continuation signals. But you have to understand clear concepts about pin bar candles before starting to trade.
This article contains all the valuable information that you need to know about pin bars. Moreover, we describe short-term and long-term trading strategies.
What is a pin bar?
This Japanese candlestick formation was an invention of the seventeenth century. A Japanese rice trader Munehisa Homma is the founder of this concept. A pin bar is a Japanese candlestick that has long wicks and a small body. Candles are simply graphical representations of participant’s psychology that drive the asset price. The pin bar is no different; it also carries a powerful semblance into market psychology.
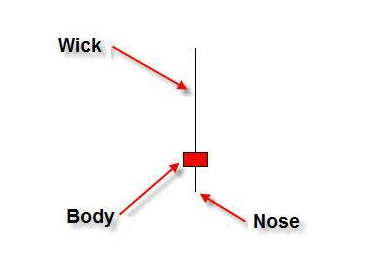
For a better understanding, look at the figure above. At the opening of this candle, buyers took immediate control over the price movement that drives the asset price higher. Then sellers come to the market, and with increasing supply, the demand decreases that causes a fall in the asset price.
Structure of pin bar
The pin bar pattern usually shows the price rejection. Pin bar candles have little body and wick at any side at least twice of that body. It allows wicks at both sides of the candle body. There may be a small wick at the opposite of a long wick. Long wicks also appear at the hammer candlesticks above or below but not at both sides of the body.
Pinbar structure
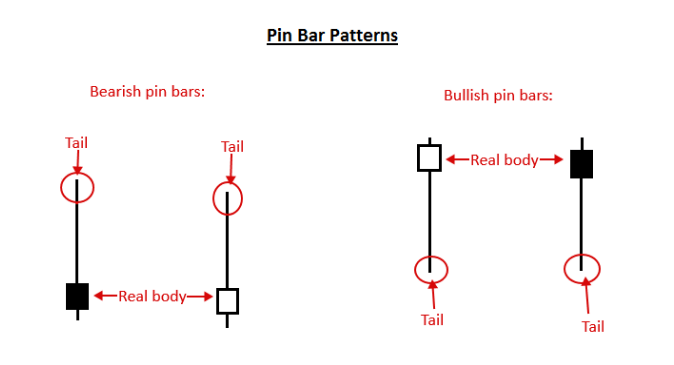
The figure above shows the basic structure of the pin bar candle. They show acceptable results on support & resistance levels (S&R). The formation of wicks is a symbol of price rejection. Price may reach any level for the supply-demand factor but could not hold the position continuously. Then the opposite force comes up and pushes the price back, making a pin bar candle during that specific period. There are two types of pin bar candles: bullish pin bar and bearish pin bar.
However, pin bar candles do not always work as reversal patterns. You can also find them as continuation patterns.
How to use the pin bar in our trading?
We are following two rules for using pin bar patterns in trading.
- Firstly, identify support resistance levels to verify the validness of the pin bar candlestick.
- Secondly, wait until the pin bar candle. We use S&R levels for confirmation and more accuracy to trading with pin bars.
On the other hand, taking entry in the middle of a candle formation is not wise. You don’t know what type of candle it will be at the end of the period, so waiting until the candle’s formation will help you get more accurate profitable trading positions.
One day trading strategy based on the pin bar
You can use a pin bar for the daily trading method. You need to identify the S&R levels of the daily chart.
When we want to use pin bar candles for daily trading, we emphasize some daily chart levels, such as S&R, daily highs and lows, and opening and closing of daily candles. Once you identify them, check out the hourly chart to seek entry positions.
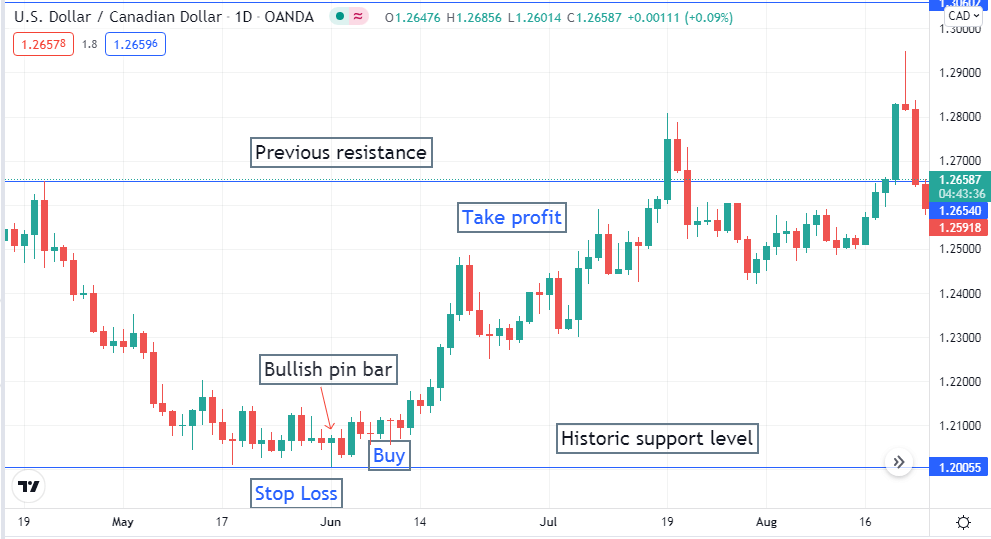
Bullish trade setup
Find the pin bar candle near the support level, which is a confirmation of price rejection. Then wait until the closing of the pin bar candle. Then place a buy order at the opening of the next candle. Put an initial stop loss below the recent swing low and support level with a buffer of 10-15pips.
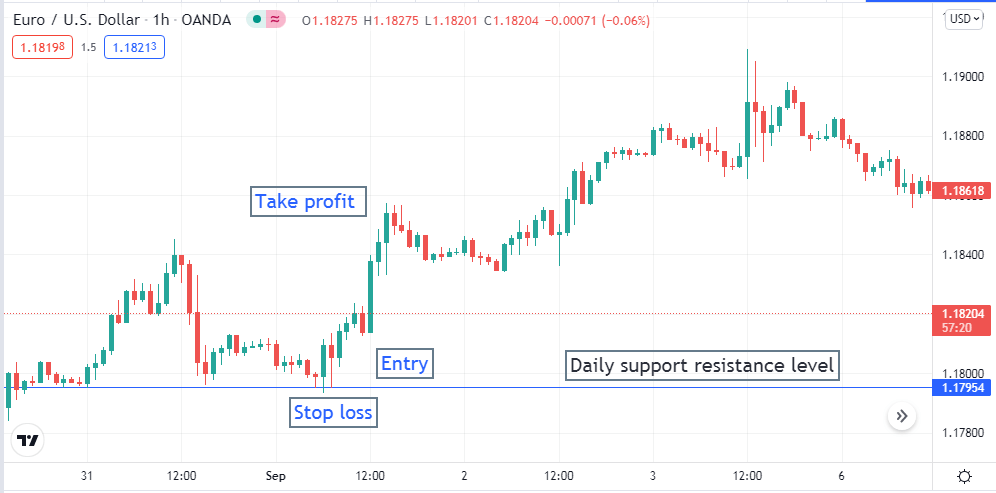
Short term bullish setup
Continue your buy order till the New York session ends. Close your order when volatility decreases or prices start to fall back. You can shift your stop loss at the breakeven point or above it to reduce risk and as a part of trade management.
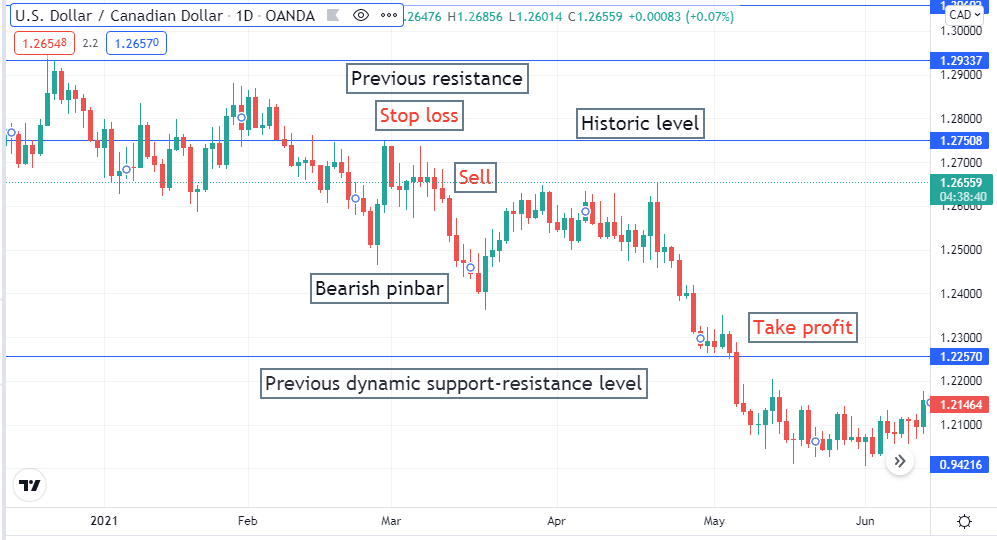
Bearish trade setup
Identify adequate levels on the daily chart. Seek valid bearish pin bars near resistance levels. Wait till the bearish pin bar candle closes. Place sell orders at the opening of the next candle. Initial stop loss will be above the recent swing high or resistance level with a buffer of 10-15pips.
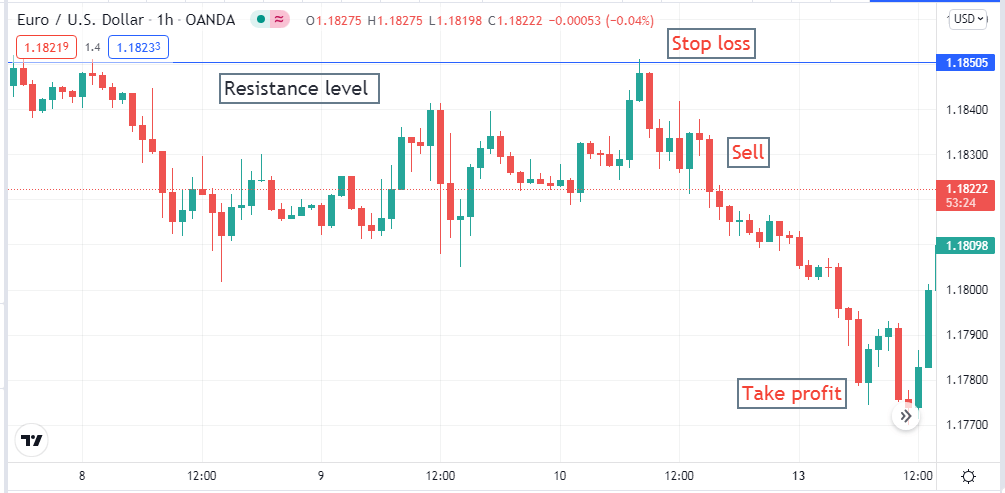
Short term bearish setup
Close the sell order at the ending of the New York session when volatility reduces in the asset price. As a part of trade management, you can shift your stop loss at the breakeven point or below it when the price makes a new lower low.
Long-term trading strategy using pin bar
We use three different time frame charts: monthly, weekly, and daily to analyze and sort long-term trading positions using pin bar candles. Essential levels are swing highs and lows, opening and closing prices of the monthly and weekly charts. Note the recent opening, closing, highs, and lows of recent and current weeks and months. Seek your entry positions on the daily chart.
Bullish trade setup
Seek pin bars near or above static support or dynamic S&R levels. Wait till the bullish pin bar candle closes. It is a confirmation of price rejection, and an upward force is coming. Place a buy order near the opening of the next candle.
Long term bullish setup
Take profit or exit position for the buy order when the price reaches the next S&R level, or a pullback comes. The initial stop loss will be below the current lower low or support level with a buffer of 30-50pips. We suggest placing the stop loss at or above break even when the price creates a new higher high.
Bearish trade setup
Seek pin bar near or below static resistance or dynamic S&R levels. Wait until the pin bar candle closes.
Long term bearish setup
Put a sell order near the opening of the next candle. Initial stop loss will be above the recent swing high or resistance level with a buffer of 30-50pips. Take profit levels will be above or at the following S&R levels. You can move your stop loss at or below the breakeven point as a part of trade management when the price makes a new swing low.
Final thoughts
Trading using candlestick patterns is quite common among traders, but do not forget that indicators, not candlestick patterns, cannot yet give a 100% entry point. It all depends on the conditions and the current trading situation. This strategy has been used in the market for a long time and has found its followers and opponents.
We can say that this trading strategy, with the right approach, works not only in the classic version on extensive time frames H4, D1, and higher. But also on small M5, M15. The differences will only be in the amount of potential profit and the time of the open position. When trading on D1, an open position can exist for several months.
Remember, these candlesticks give the best signals at the S&R levels and breakout levels. You can ignore the body color and check the wicks to identify pin bar candlesticks.


Comments