
The financial market leaves footprints through many candlestick patterns. It is a prevalent practice among financial traders to seek trading opportunities through various candlestick patterns. Many patterns are so effective that they generate the same signal in particular phases of the price movements. The Pennant pattern is among the most effective chart patterns that technical traders rely on while making trade decisions.
However, the Pennant signals different directions of the price movement by appearing in different phases. This article will introduce you to the Pennant pattern besides explaining successful trading methods using this pattern shape.
What is the Pennant-shaped pattern?
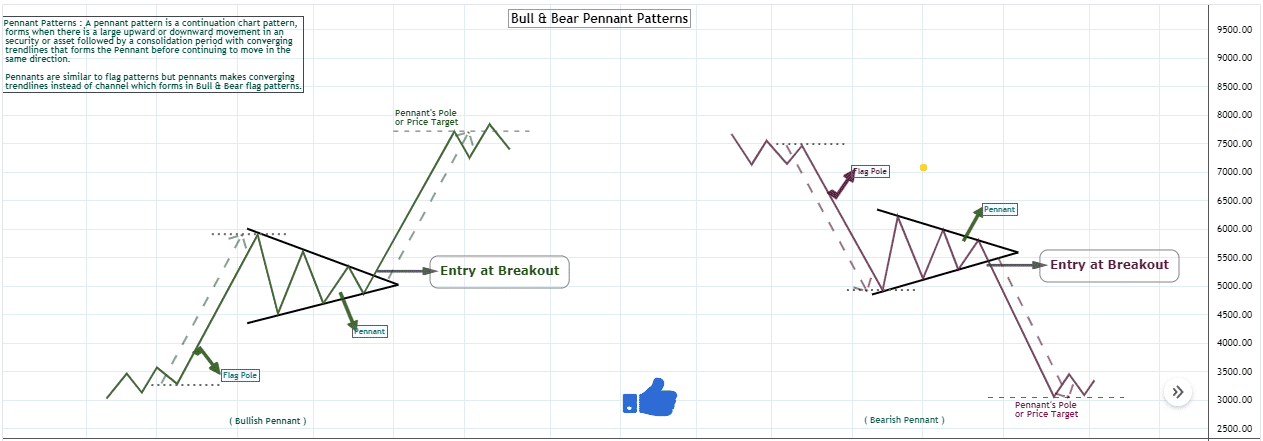
It is a multi-candle pattern that signals a continuation of the current trend by appearing in trendy price movements. It has a similar appearance and signaling price direction as the symmetrical triangle pattern. Although both share similarities, there are two primary differences between these two patterns.
The first is in the initiation phase, in which the Pennant-shaped usually has a vertical flagpole, whereas it is not mandatory for symmetrical triangle patterns. Moreover, the conical bodies between these two patterns have a bit of a difference. This part is essential as creating a vertical flagpole requires an intense rallying or declining pressure on the asset price.
Another significant difference is in the duration of these pattern formations. The symmetrical triangle pattern can take a long time, maybe several months, to complete the entire shape. Whereas the Pennant pattern usually takes time between 1-4 weeks. If any Pennant pattern takes more than three months, it can make a symmetrical triangle pattern.
Different Pennant-shaped patterns
When this pattern takes place after a significant bullish price movement, it is a bullish Pennant pattern. Conversely, a Pennant-shaped pattern after a declining flagpole is a bearish Pennant-shaped pattern.
How to use the Pennant-shaped pattern in trading strategy?
When you learn to spot the formation, it becomes easier to open a trading position by observing other factors of the market context. A bullish Pennant pattern signals a continuation of the bullish trend, and a bearish Pennant-shaped pattern signals a bearish trend continuation.
For example, it is a common understanding that the Pennant-shaped pattern takes place after a trendy momentum, and a breakout occurs above or below to continue the actual trend. In that case, a difference in volume occurs as, during the pattern formation, it is a consolidating phase where the volume decreases.
Meanwhile, there will be an increasing volume when the breakout takes place. So you can use a volume indicator or other momentum indicators to confirm the breakout and open trades according to the market context.
A short-term trading strategy
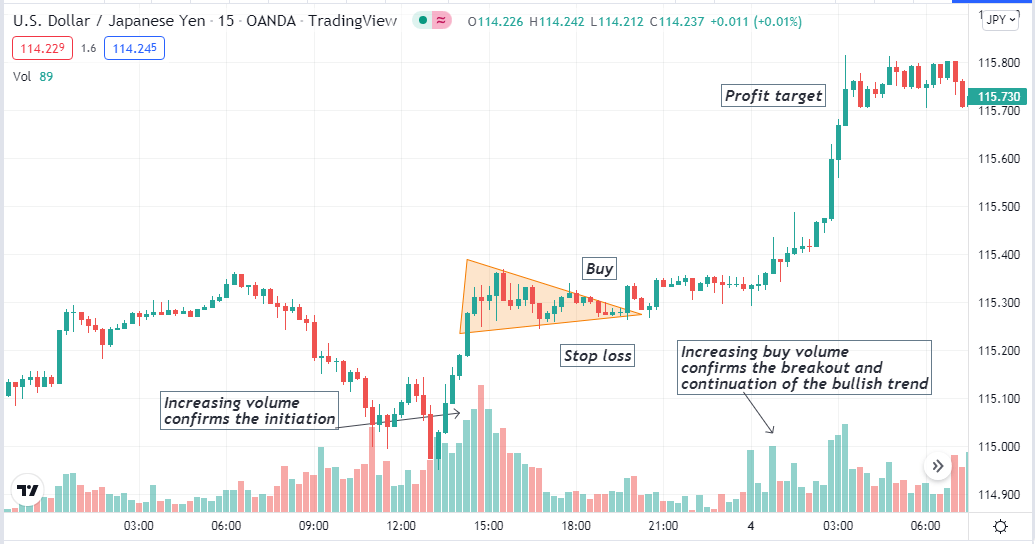
Here we use the volume indicator to confirm the pattern initiation and breakouts before placing any order. We use a multi-time frame analysis in this trading technique. We determine the current trend from the upper time frame (H4 or daily) chart and open positions in the lower (15-min or hourly) charts by spotting the pattern formation and breakout.
Bullish trade scenario
Confirm the current trend is bullish from upper time frame charts and seek trading positions at lower time frame charts when:
- Confirm initiation of the bullish Pennant-shaped pattern and wait till the whole pattern completes formation.
- Confirm the breakout above the pattern.
- Observe buy pressure on the asset price at the volume indicator reading.
Bullish setup
Entry
Place a buy order after the closing of the breakout bullish candle.
Stop loss
Place an initial stop loss below the bullish Pennant-shaped pattern.
Take profit
The initial profit target will be above the Pennant pattern at the same distance as the flagpole.
Bearish trade scenario
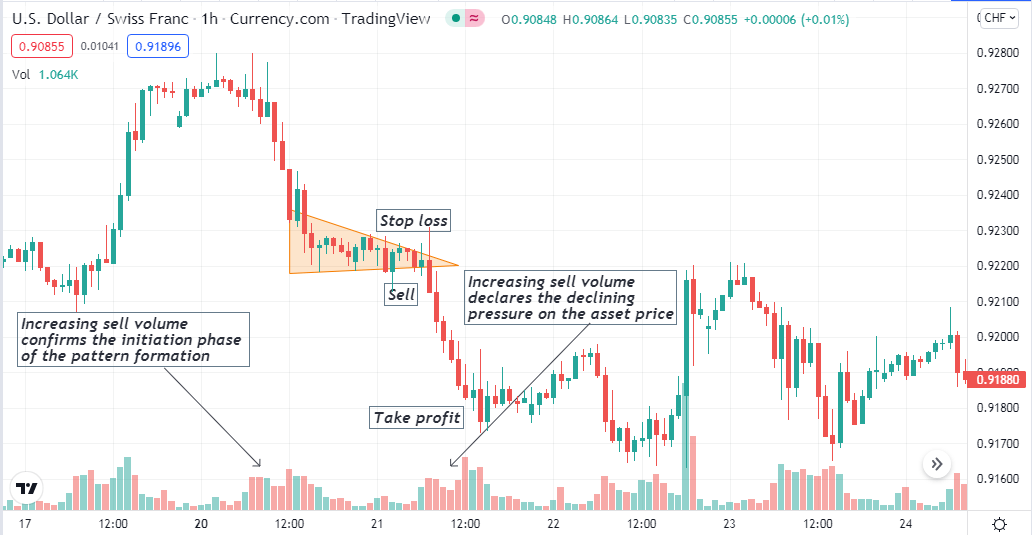
Confirm the current trend is bearish from upper timeframe charts and seek trading positions at lower time frame charts when:
- Confirm the bearish Pennant-shaped pattern initiation and wait till the whole pattern completes formation.
- Confirm the breakout below the pattern.
- Observe sell pressure on the asset price at the volume indicator reading.
Bearish setup
Entry
Place a sell order after the closing of the breakout bearish candle.
Stop loss
Place an initial stop loss above the bearish Pennant-shaped pattern.
Take profit
The initial profit target will be below the Pennant pattern at the same distance as the flagpole.
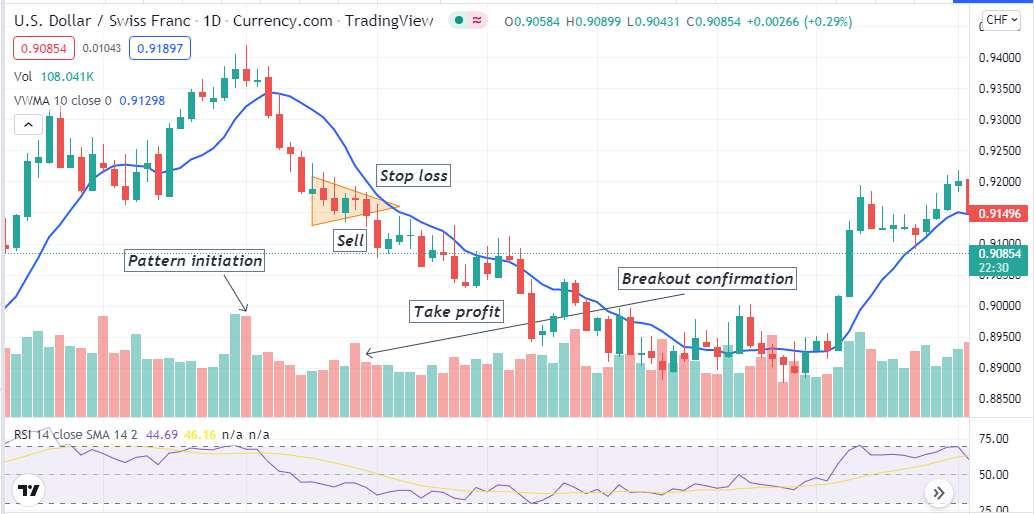
A long-term trading strategy
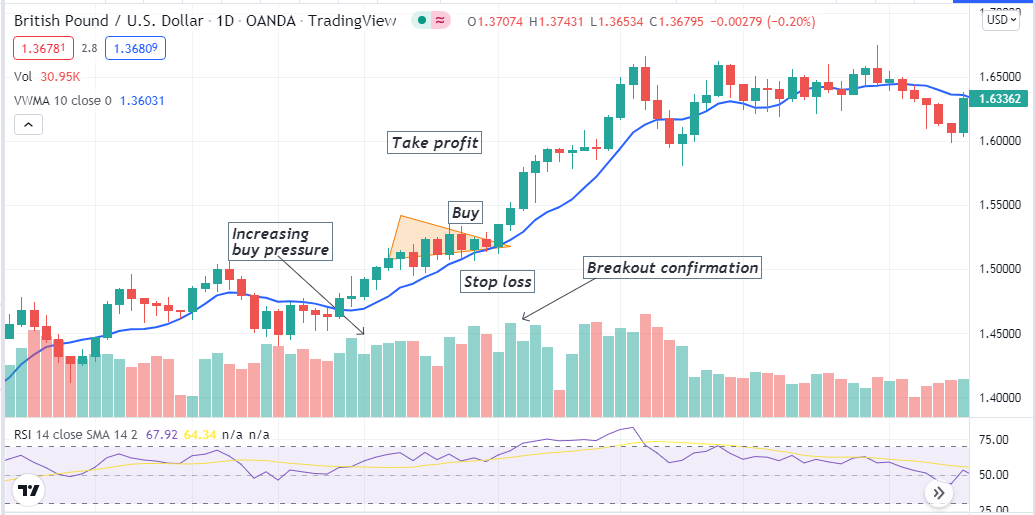
We use three different technical indicators alongside the Pennant-shaped pattern for more accuracy. It contains the volume indicator, a volume-weighted moving average of 10 periods, and the RSI indicator, which suits an H4 or above chart. If you use the weekly chart, don’t consider it a Pennant-shaped pattern if it takes more than a month to complete formation.
Bullish trade scenario
Follow the guideline below:
- Spot a bullish Pennant-shaped pattern.
- The pattern takes place above the VWMA line.
- The RSI reading is above the central (50) line and heading upside.
- Confirm increasing buy volume at the breakout level.
Bullish setup
Entry
After the breakout at the above side, open a buy position.
Stop loss
Put a reasonable stop loss below the pattern shape or the consolidation phase.
Take profit
The primary profit target above the breakout distance is the same as the flagpole. You can continue the buy order if the price keeps rallying. Close the buy order when:
- The RSI reading reaches the overbought level.
- The volume indicator declares an increasing sell volume.
Bearish trade scenario
Follow the guideline below:
- Spot a bearish Pennant-shaped pattern.
- The pattern takes place below the VWMA line.
- The RSI reading is below the central (50) line and heading downside.
- Confirm increasing sell volume at the breakout level.
Bearish setup
Entry
After the breakout at the downside, open a sell position.
Stop loss
Put a reasonable stop loss above the pattern shape or the consolidation phase.
Take profit
The primary profit target below the breakout distance is the same as the flagpole. You can continue the sell order if the price keeps declining. Close the sell order when:
- The RSI reading reaches the oversold level.
- The volume indicator declares an increasing buy volume.
Pros and cons
| 👍 Pros | 👎 Cons |
|
|
|
|
|
|
Final thought
We brief all primary info about the Pennant-shaped pattern in this short passage. You can use other technical indicators and tools such as support resistance, the ADX indicator, MA crossover, Parabolic SAR, etc., to create sustainable trading methods combined with this pattern.


Comments