
It is a common practice among financial traders to rely on many technical indicators while making trade decisions. Trading indicators enable obtaining the market context depending on various info price candles. The OBV or on-balance volume indicator is an effective trading indicator for financial traders.
However, every trading indicator is unique as it uses different formulas and works with various market data. So it requires learning the components and calculation procedures to obtain the best results through any trading indicator. The following section will discuss the OBV indicator and describe adoptable trading strategies using this indicator.
What is the on-balance volume?
It is a unique technical indicator that calculates the price movement’s positive and negative volume flow. The OBV usually tracks the rising or declining volume to project future asset price movements. The developer of this unique momentum indicator is Joseph Granville.
He first wrote “Granville’s New Key to Stock Market Profits” about this indicator in 1960. This indicator considers a high volume when the recent closing price is higher than the previous closing price. Inversely, this indicator considers a down volume when the current closing price is lower than the last closing.
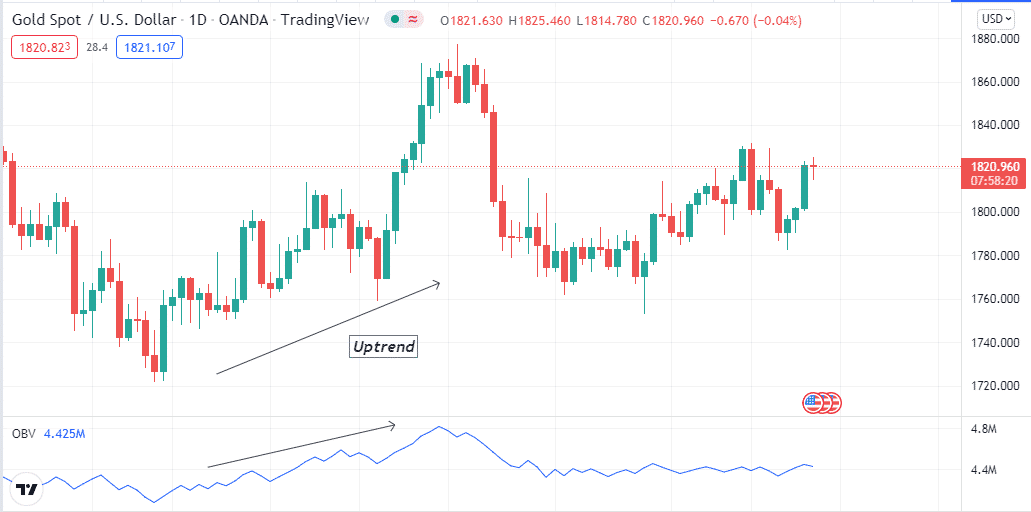
The OBV indicator on a daily chart of XAU/USD
This indicator use formula:
If the closing price is above the prior close price, then:
Current OBV = Previous OBV + Current Volume
If the closing price is below the prior close price, then:
Current OBV = Previous OBV – Current Volume
If the closing prices equals the prior close price, then:
Current OBV = Previous OBV (no change)
How to use OBV in trading strategy?
The indicator shows the volume data through a single dynamic line on an independent window. Technical traders usually use the divergence of that dynamic line to determine the trend and predict the future direction. The uptrend will likely continue when the OBV line and price candles create higher peaks.
On the other hand, a series of lower peaks declares that the declining pressure is likely to continue on the asset price. It is not wise to use OBV as a standalone indicator to create a complete trading method. Because this indicator doesn’t suggest any entry/exit position for trading.
A short-term trading strategy
We use the support & resistance concept in this trading method besides the OBV indicator. First, draw all-important levels from upper time frame charts, such as support resistance levels, historic levels, monthly-weekly open/high/low/close, etc.
Then seek to open positions at lower time frame charts. So you will draw the basic levels using H4 or above charts. It is a short-term trading method, so we recommend using a 15-min chart to get the best results.
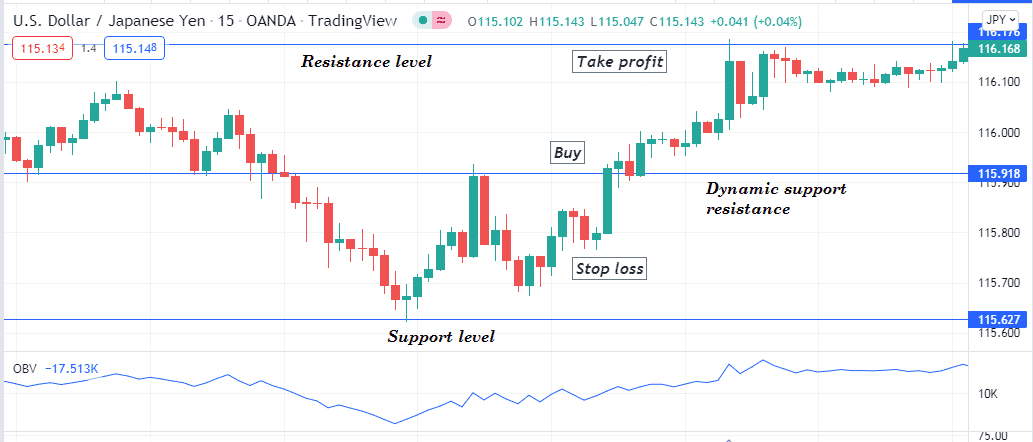
Bullish trade scenario
Seek to open buy positions when:
- The price reaches a support level and starts to bounce on the upside.
- A breakout occurs, and the price breaks above any level you draw.
- The OBV indicator rises on the upside by making a series of higher peaks.
Bullish setup
Entry
Check these conditions above and place a buy trade after matching all of them.
Stop loss
Place an initial stop loss below the breakout level or the support level with a buffer of 5-10 pips.
Take profit
The primary profit target will be below the next resistance level, and you can continue the buy order if the price breaks above the next resistance level. In that case, shift your stop loss above or at the breakeven point as a part of risk/trade management.
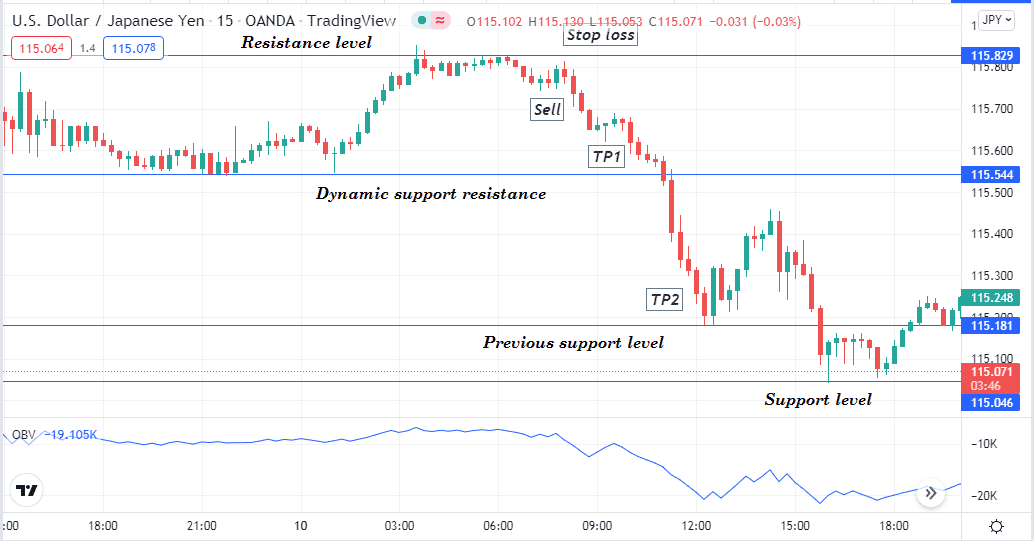
Bearish trade scenario
Seek to open sell positions when:
- The price reaches a resistance level and starts to decline.
- A breakout occurs, and the price breaks below any level you draw.
- The OBV indicator slops on the downside by making a series of lower peaks.
Bearish setup
Entry
Check these conditions above and place a sell trade after matching all of them.
Stop loss
Place an initial stop loss above the breakout level or the resistance level with a buffer of 5-10 pips.
Take profit
The primary profit target will be above the next support level, and you can continue the sell order if the price breaks below the next support level. In that case, shift your stop loss below or at the breakeven point as a part of risk/trade management.
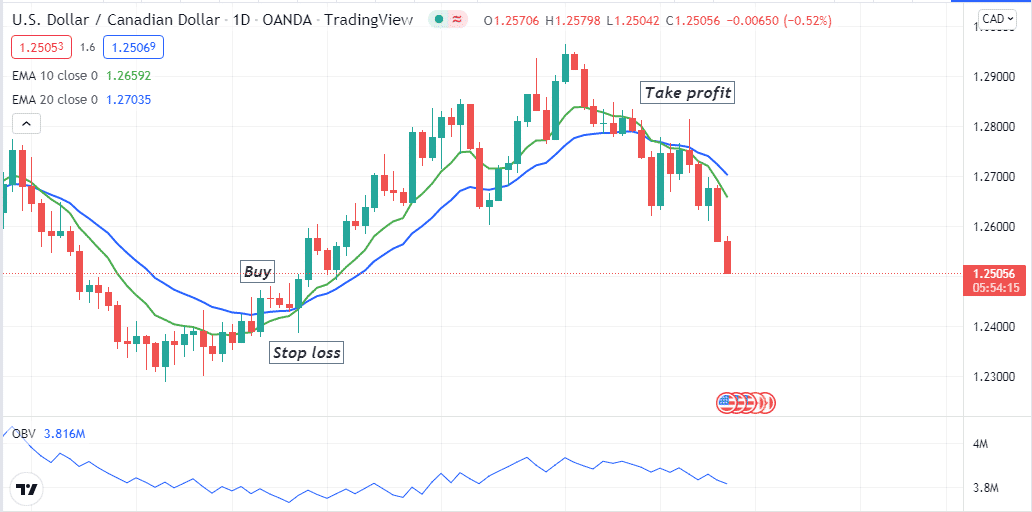
A long-term trading strategy
We rely on the MA crossover concept in our long-term trading method to determine entry/exit positions and use the OBV indicator for confirmation. We use EMA 10 (green) and EMA 20 (blue) lines. When the green EMA reaches above the blue EMA line, it declares initiation of bullish momentum.
Conversely, when the exact opposite crossover occurs, it indicates bearish momentum and suggests an opening sell position. Match the OBV reading, checking that EMA lines before entering any trade. It is a suitable trading method for any time frame; use an H4 or above chart to catch the most potent long-term trades through this method.
Bullish trade scenario
When seeking to open a buy position check:
- The green EMA crosses the blue EMA line on the upside.
- The OBV line makes higher peaks and slopes on the upside.
Bullish setup
Entry
Match these conditions above and open a buy position.
Stop loss
Place a reasonable stop loss below the bullish momentum.
Take profit
You can continue the buy trade till the price continues to move upward. Close the buy position when the green EMA reaches below the blue EMA line.
Bearish trade scenario
When seeking to open a sell position check:
- The green EMA crosses the blue EMA line on the downside.
- The OBV line makes lower peaks and slopes on the downside.
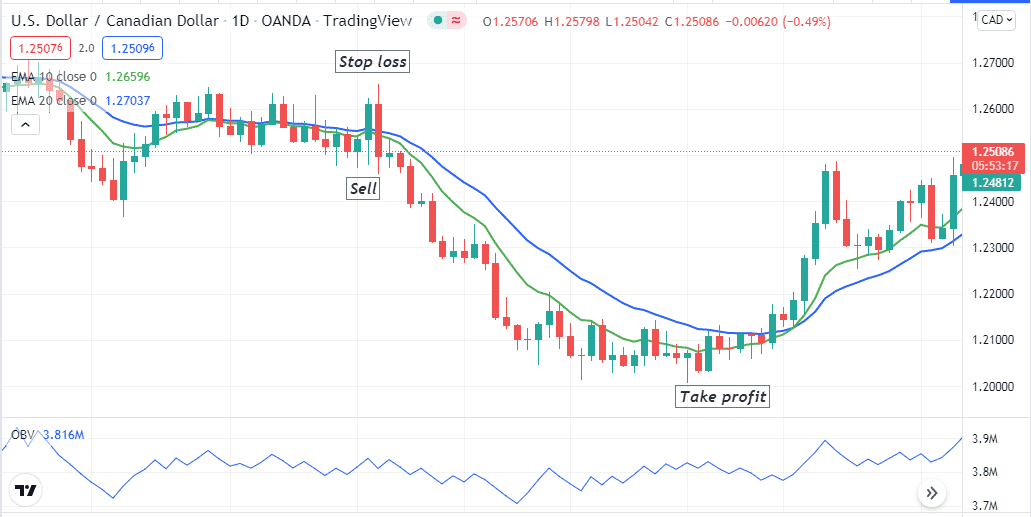
Bearish setup
Entry
Match these conditions above and open a sell position.
Stop loss
Place a reasonable stop loss above the bearish momentum.
Take profit
You can continue the sell trade till the price continues to move downward. Close the sell position when the green EMA crosses above the blue EMA line.
Pros and cons
| 👍 Pros | 👎 Cons |
|
|
|
|
|
|
Final thought
According to a survey, market participants who use volume info for trading execute approx. 77% successful trades. Combining other indicators will increase profitability. We suggest being aware of the blips due to many fundamental reasons. So checking on the economic calendar before making trade decisions will reduce risks.


Comments