Trading indicators are an unavoidable part of the financial market. The Volume-Weighted Moving Average or VWMA is a popular technical indicator to market participants. It enables traders to obtain the market context from several angles by using different calculations.
However, learning the functionalities and professional ways to use any technical indicator is mandatory when you decide to use any indicator to execute successful trades. In this following section, we will reveal the VWMA indicator. It contains a complete guideline to trade using this indicator and chart explanations for better understanding.
What is the VWMA indicator?
It is a moving average that uses different market data than trading MA. This indicator prioritizes volume info by weighing prices depending on participants’ activities in a specific period. You can customize an offset, the length, and the source while implementing this indicator on any trading instrument.
The price with massive trading activity gets more weight than the price with light trading activities. When the market volume is low, the VWMA and the SMA values are closer. You can use it to determine the price movement’s trend or even trend shifting phases. Combining this indicator reading with other technical tools may help you sort out your trades/ most accurate entry/exit positions.
How does the VWMA indicator work?
Using this indicator, learning the working procedure and use will enable opportunities to create invincible trading strategies. Follow the following steps to understand the working process of the VWMA indicator.
Step 1. Identify the market context
First, learn to identify the market context using the VWMA indicator. The functionality of the indicator is like other MA indicators, where the prioritizing factor is different. Check the image below to understand the concept.
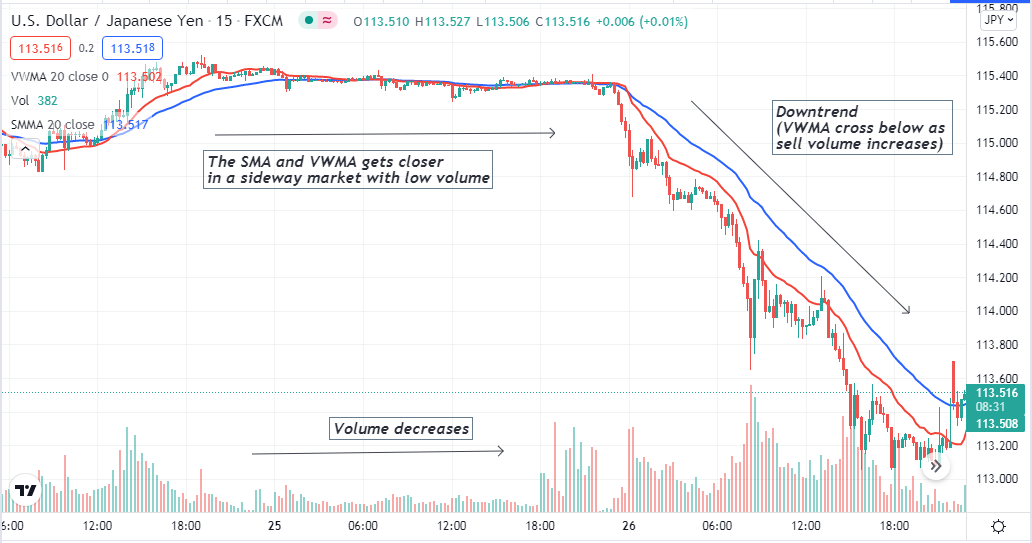
Market context by VWMA, SMA, and the volume indicator
In this USD/JPY chart, we apply VWMA (red) and SMA (blue) of the same periods besides the volume indicator. Now look carefully, the price finishes an uptrend and remains on the sideways for a certain period, and the volume is low as traders’ activity fades.
Meanwhile, both VWMA and SMA lines get closer to each other. Then the sell volume increases. The VWMA line crosses below the SMA line, declaring a downtrend and sufficient sell volume.
Step 2. Try to determine the trend shifting points
In the next step, try to determine the current trend besides trend shifting points to dort out trading positions. The primary reason for using indicators is to catch the best trades, which involves buying at lows and selling the trading instrument when the price reaches high.
So it is essential to determine the trend direction and switching points to execute trades and hold the position when it arrives at extreme ends. You can use the VWMA indicator for doing both by simply utilizing the crossover concept, which is popular with financial traders who frequently use any MA indicator.
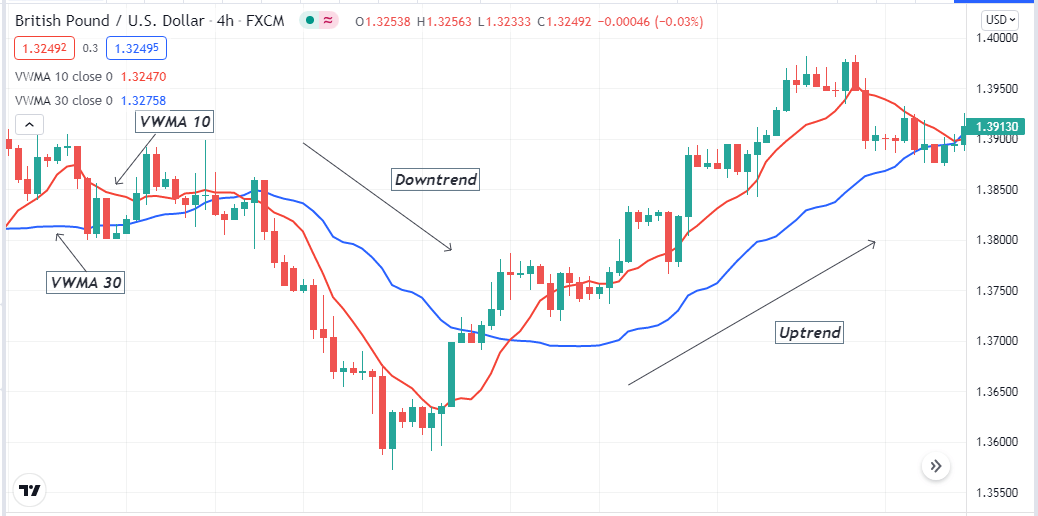
VWMA 10 and VWMA 30 crossover
In this way, you use two VWMA that have different periods.
- For example, you may use VWMA 10 and VWMA 30. When the VWMA 10 crosses the VWMA 30 on the upside, it declares a sufficient bullish pressure on the asset price.
- Meanwhile, the exact opposite crossover between those VWMA lines indicates a declining force on the asset price.
- The VWMA 10 remains above the VWMA 30 line till the uptrend is intact, and the exact opposite scenario occurs in a downtrend.
Step 3. Move to the higher time frames to execute efficient trades
The time frame is an essential factor to financial traders and investors. The observation is different for traders who follow different methods.
- For example, a day trader may look into 1min-hourly charts to seek entry/exit positions as he is involved in trade durations not more than a day and now allow overnight holding.
- Meanwhile, a position trader will seek entry/exit positions at daily or weekly charts as he may want to hold any asset for weeks or even months.
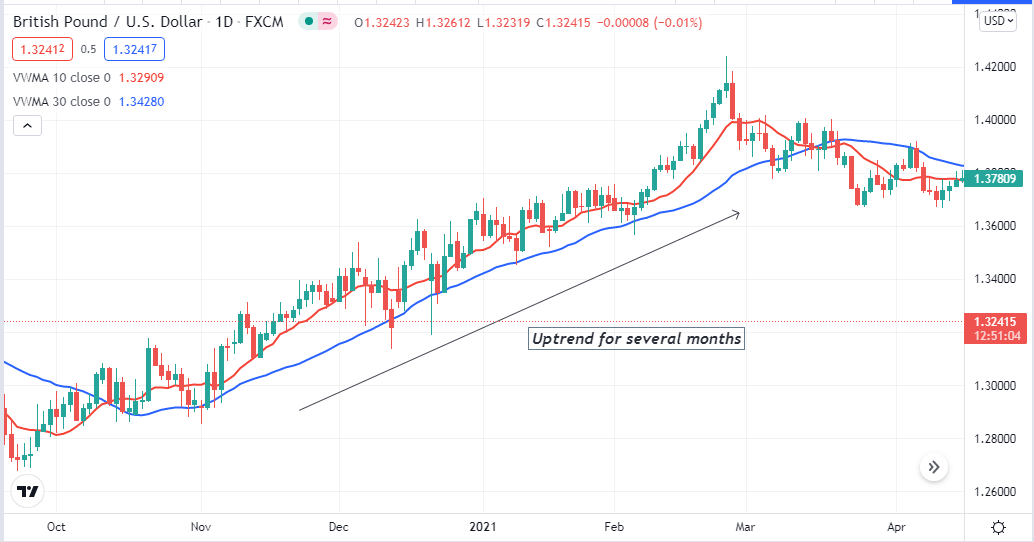
VWMA crossover in the daily chart of GBP/USD
Additionally, analyzing longer time frame charts allow traders to avoid fake swing highs and lows of smaller time frame charts. The chart above shows how to make thousands of pips with a simple crossover concept. Another most popular way is to conduct analysis using multi-time frame charts that enable a birds-eye view of the asset price.
Step 4. Use other indicators for more efficiency
The trading indicators use several calculations and show the market context depending on many factors. You can use the VWMA indicator to combine the reading with other trend or momentum indicators to generate precious trade ideas. For example, you may use the RSi indicator beside the VWMA crossover. Then you can make more accurate trading positions that are more potent.
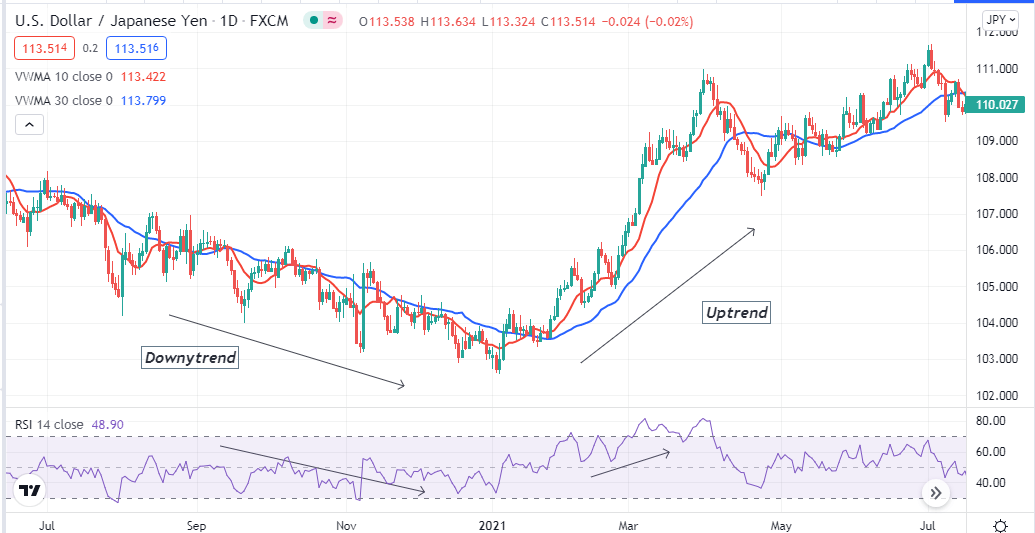
Combining VDMA crossover and RSI indicator
A bullish crossover occurs between those VWMA lines, and the RSI dynamic line may cross above the central (50) line and head more upside signals an upcoming bullish price movement. So you may open a buy position in that place. The exact opposite readings from those indicators suggest opening a sell position. You can use many other indicators to make invincible trading strategies, such as parabolic SAR, MACD, ADX, etc.
Step 5. Use proper trade and money management
Successful traders have essential characteristics, such as approaching the market with discipline. This section includes trade and money management concepts. Successful traders always follow an acceptable trade and money management due to performing trades with a good risk ratio. Most professional traders open positions that involve a risk between 2-5% of their trading capital.
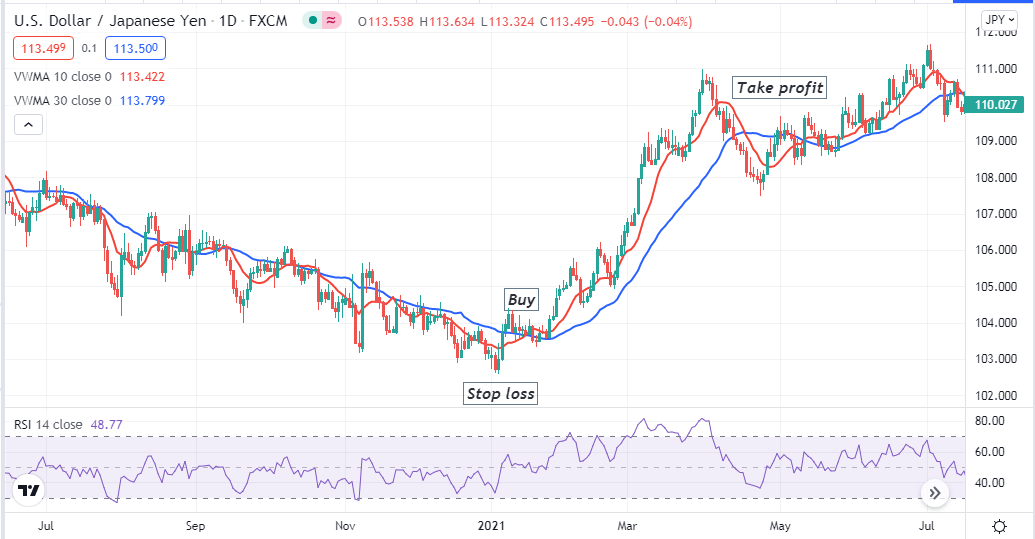
A complete buy trade setup
On the other hand, most novice trades lose capital for ignoring these facts. Use tight stop loss for your executing trades. Trade management depends on your trading techniques and market context.
Final thought
These are the procedures to obtain the best results using the VWMA indicator. We hope you get this article helpful and sufficient education to execute profitable trading positions. Spend time analyzing all target trading instruments besides keeping updated about fundamental events to avoid risk and increase profitability.


Comments