
The financial market involves forming many candlestick patterns during price movements. Some patterns are so unique and repeatedly generate the same trading signals. So no wonder that financial investors rely on those candlestick formations while making trade decisions. The horn tops and bottoms are two remarkable candlestick formations popular among forex traders.
However, learning the formation besides functionality is mandatory to execute successful trades when you trade using any pattern. This article will introduce you to the horn tops and bottom patterns, and it includes explaining complete trading methods using these pattern types.
What are horn top and horn bottom patterns?
The horn top pattern, a candlestick formation, is typical on any trading instrument chart containing three price candles. The first and the third candle body is comparatively larger than the middle one among those three candles. This pattern looks similar to the English letter “H.” This pattern generates the most potent reversal signal by taking place near the finish line of an uptrend.
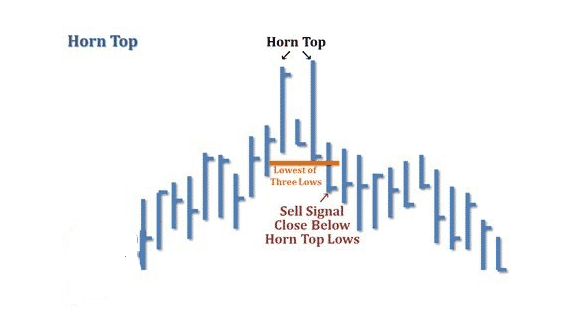
Horn top
On the other hand, the horn bottom functionalities are the exact opposite of the horn top pattern. This pattern occurs at the finish line of a downtrend and signals an upcoming bullish pressure on the asset price. This pattern looks similar to an upside-down cow horn.
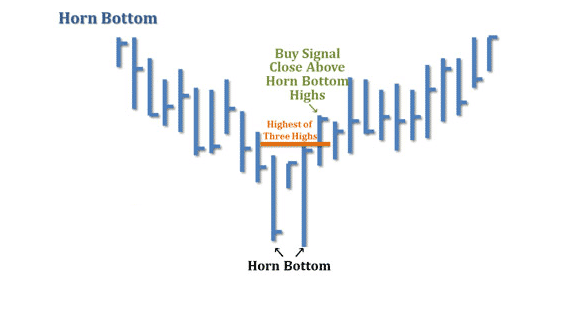
Horn bottom
How to trade using the horn top and bottom pattern
The initial part is to spot patterns in the appropriate places. The horn top is potent at a relative resistance level or near the ending of an uptrend. Meanwhile, the horn bottom generates a buy-trade idea when it takes place near any support level. When the price crosses above the range of the horn top, it usually declares that an uptrend is near.
On the other hand, the price reaching below the three candles range of the horn top signals an upcoming declining pressure. You can use these simple concepts to execute trades or use other technical tools and indicators alongside these patterns to generate trade ideas. For example, checking on volume data can help catch trades more accurately when these patterns occur.
A short-term trading strategy
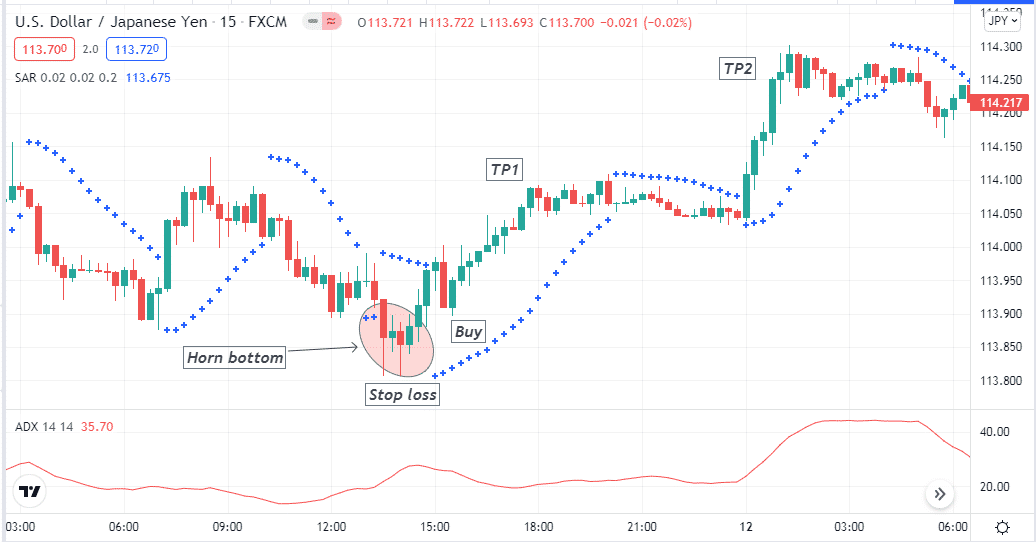
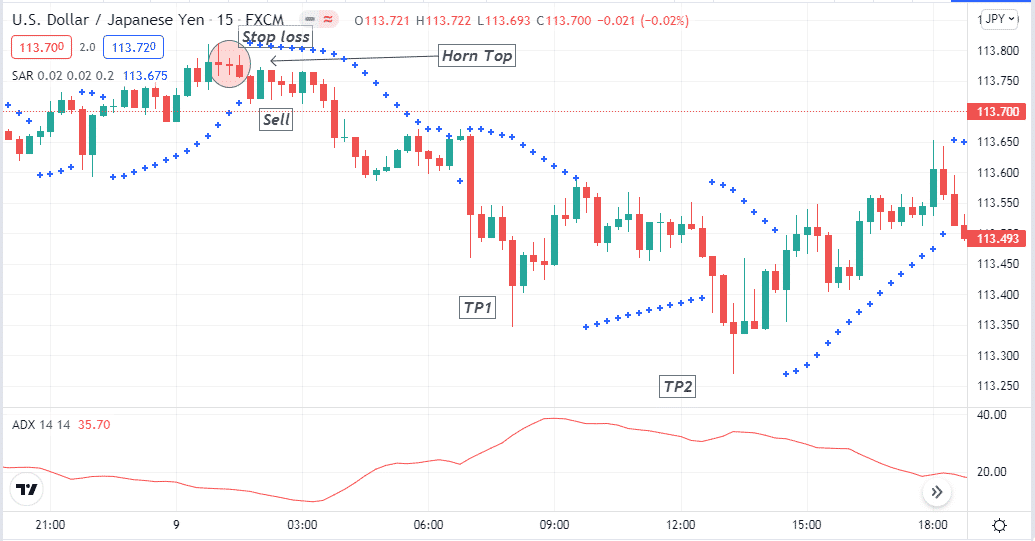
We use two technical indicators besides horn tops and bottom pattern formations. We use the Parabolic SAR and ADX indicator to determine short-term trading positions.
When the pattern takes place, the confirmation comes from those indicators. This trading method suits any trading asset, the preferable trading instruments with sufficient volatility. Meanwhile, use 15-min charts for potent short-term trading positions and try executing trades at London or US sessions as trading assets remain most volatile during these sessions.
Bullish trade scenario
First, apply all those indicators to your target asset chart. Spot a horn bottom pattern near the ending of a downtrend and start bouncing upside, seek to open buy positions when:
- Parabolic dot takes place below the pattern confirming valid swing lows.
- The ADX value is above 20 and heading more upside.
Bullish setup
Entry
These conditions above indicate sufficient bullish pressure on the asset price. Place buy order.
Stop loss
The initial stop loss level will be below the pattern formation with a buffer of 5-10pips.
Take profit
This trading method usually generates trade ideas with a 1:2 risk-reward ratio or above. Continue the buy order according to the market context, exit it when:
- The parabolic dots switch on the upside of price candles.
- The ADX value drops.
Bearish trade scenario
First, apply all those indicators to your target asset chart. Spot a horn top pattern near the ending of an uptrend and start declining, seek to open sell positions when:
- Parabolic dot takes place above the pattern confirming valid swing highs.
- The ADX value is above 20 and heading more upside.
Bearish setup
Entry
These conditions above indicate sufficient bearish pressure on the asset price. Place sell order.
Stop loss
The initial stop loss level will be above the pattern formation with a buffer of 5-10pips.
Take profit
This trading method usually generates trade ideas with a 1:2 risk-reward ratio or above. Continue the sell order according to the market context, exit it when:
- The parabolic dots switch on the downside of price candles.
- The ADX value drops.
A long-term trading strategy
This long-term trading method uses two technical indicators alongside the horn top and bottom patterns. We use a Hull moving average of ten periods and the MACD indicator. You can apply this method to aunty trading instruments, and the preferable time frame is a daily chart. These horn tops and bottoms generate the best trading signals at upper timeframe charts.
Bullish trade scenario
First, apply those indicators and seek to open buy positions when:
- A horn bottom pattern occurs near the end of any downtrend price movement.
- The HMA line starts sloping on the upside.
- The dynamic blue line crosses the dynamic red line on the upside at the MACD window.
- MACD green histogram bars take place above the central line.
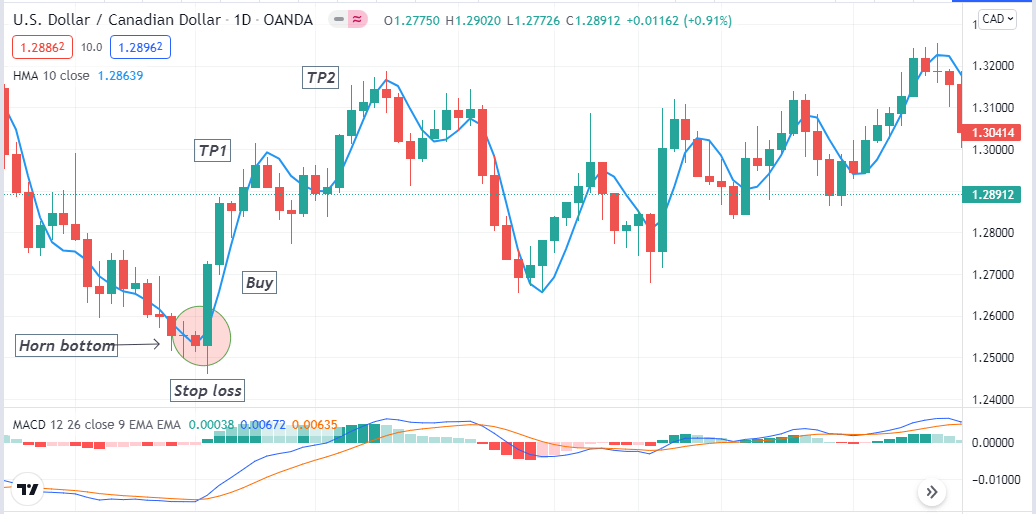
Bullish setup
Entry
Match these conditions above and place a buy order.
Stop loss
The reasonable stop loss level is below the bullish momentum.
Take profit
Continue the buy order till the market context remains in your favor. Close the buy order when:
- The HMA line starts sloping on the downside.
- MACD red histogram bars take place below the central line.
Bearish trade scenario
First, apply those indicators and seek to open sell positions when:
- A Horn top pattern occurs near the end of an uptrend price movement.
- The HMA line starts sloping on the downside.
- The dynamic blue line crosses the dynamic red line on the downside at the MACD window.
- MACD red histogram bars take place below the central line.
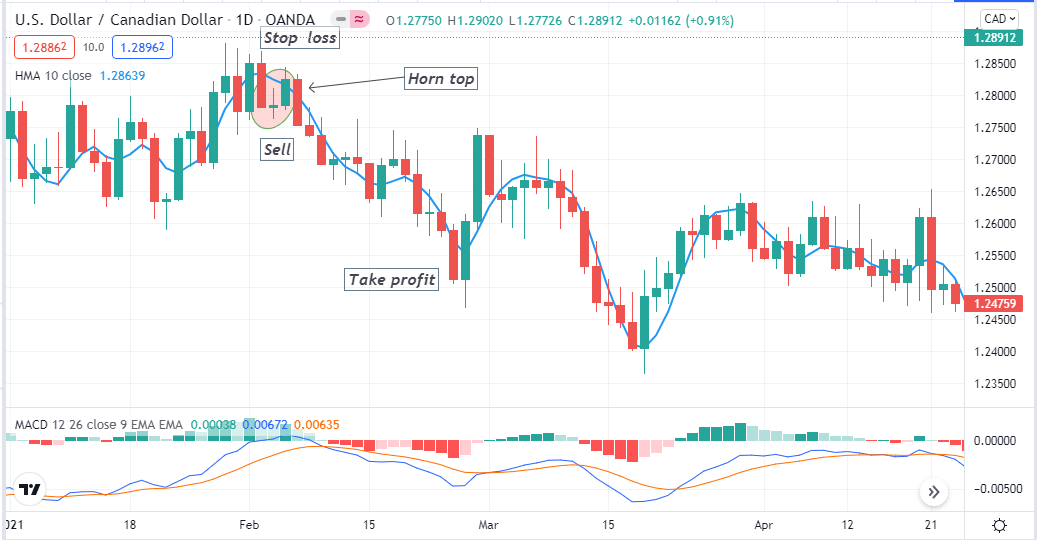
Bearish setup
Entry
Match these conditions above and place a sell order.
Stop loss
The reasonable stop loss level is above the bearish momentum.
Take profit
Continue the sell order till the market context remains in your favor. Close the sell order when:
- The HMA line starts sloping on the upside.
- MACD green histogram bars take place below the central line.
Pros and cons
| 👍 Pros | 👎 Cons |
|
|
|
|
|
|
Final thought
It is a common practice among financial traders to consider candlestick formations while making trade decisions. The horn tops and bottoms are typical formations on any trading instrument chart. We recommend using higher time frame charts and carefully observing the supportive indicator readings while executing trades.


Comments