
Moving average (MA) is probably the most commonly used technical indicator. Most trading platforms include this indicator in the package, so you can quickly put one on your chart. Also, this simple tool is excellent at showing the trend on any symbol and time frame. Quite possibly, you have one or two MA’s superimposed on your chart right now.
The simplest type of moving average is a simple moving average (SMA). However, it is also the type that lags the most. To tackle this lag, technicians introduced:
- Weighted moving average (WMA)
- Exponential moving average (EMA)
While SMA gives equal weight to all elements in the data series, EMA and WMA provide more emphasis on recent data.
The introduction of the hull moving average (HMA) in 2005 by Alan Hull attempted to reduce the lag even further. Compared to EMA and SMA, HMA is much closer to price and appears smoother. You will learn more about the difference between HMA, EMA, and SMA in a later section.
What is the hull moving average?
Simply put, HMA is a trend indicator like many other moving averages do. HMA differs from other types of moving averages due to its method of calculation. It looks at a specific number of bars on the chart and compares recent data with historical data to identify the market condition.
As you can see later, the difference between HMA and two different moving averages SMA and EMA is quite significant in terms of the smoothness of the curve and response to price change.
This characteristic of HMA is worth noting here. If you have experience trading with moving averages, you must have understood that smoothness and quick reaction do not always go together.
So the trader is left in a difficult situation to decide whether to use a shorter or longer period. This translates to getting too many poor signals or too few good calls. HMA addresses this issue to some degree, and the trader might not feel compelled to use multiple moving averages.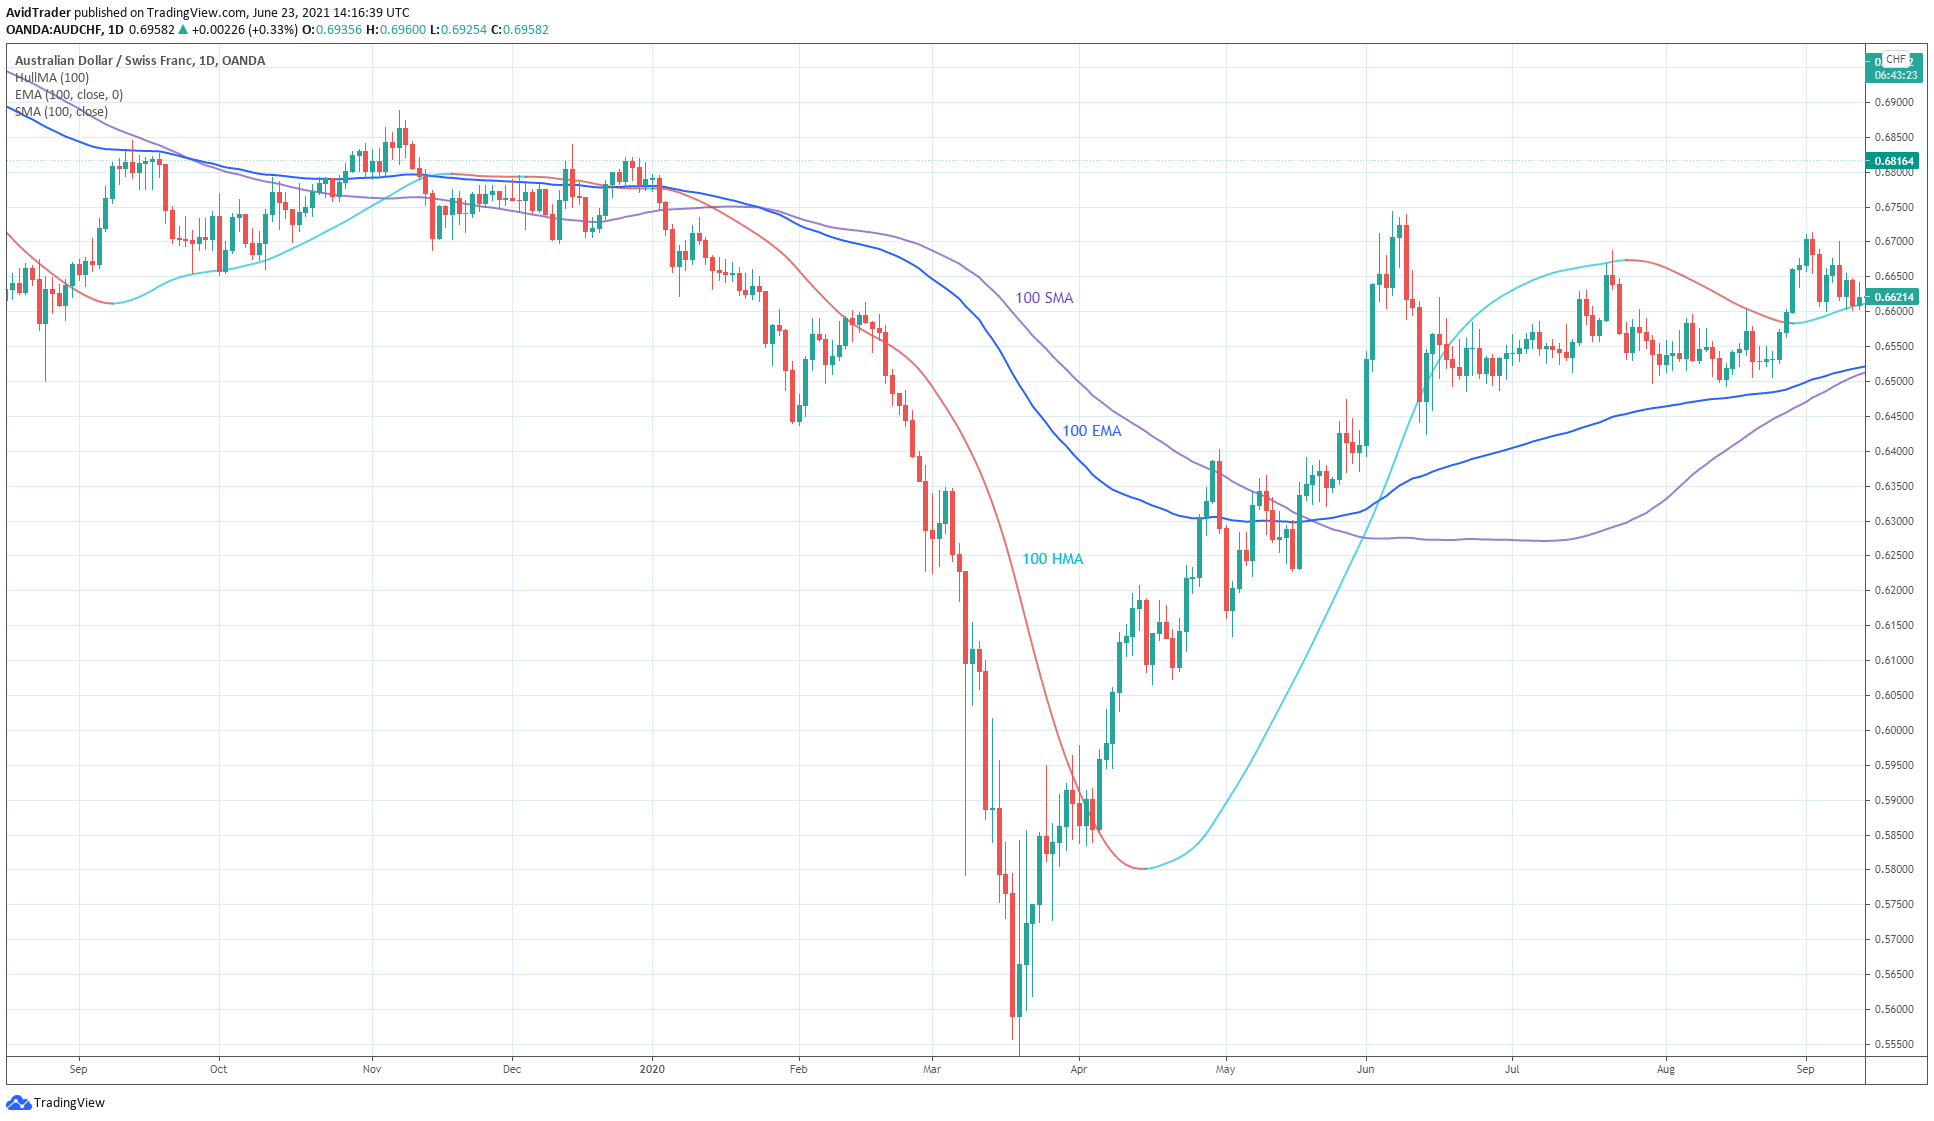
HMA vs. SMA & EMA
The above daily AUD\CHF chart depicts how HMA differs from EMA and SMA. To make a comparison, we use the same period or length for the three MA’s, that is, 100. At first glance, EMA is more responsive than SMA and is rightly so. Of course, HMA is way more responsive than EMA. HMA tends to pinpoint the swing points better than the two. It is closer to price and displays a smoother line.
As you can see on the chart, the three moving averages overlap when the market enters a range. This means that in ranging market conditions, MA’s, regardless of type, have little use. Price chops around the moving averages.
- When the market starts trending again, the three moving averages begin to part ways.
- When the trend changes from down to up, HMA catches up faster than the two.
- The delay of EMA and SMA during trend reversals is evident in this example.
Benefits of using HMA
HMA has two values:
- Positional value
- Directional value
Positional value refers to the location of the MA concerning price. Directional value pertains to the inclination of the moving average at any point in time. All moving averages share this common attribute. In terms of directional value, HMA scores higher compared to SMA and EMA.
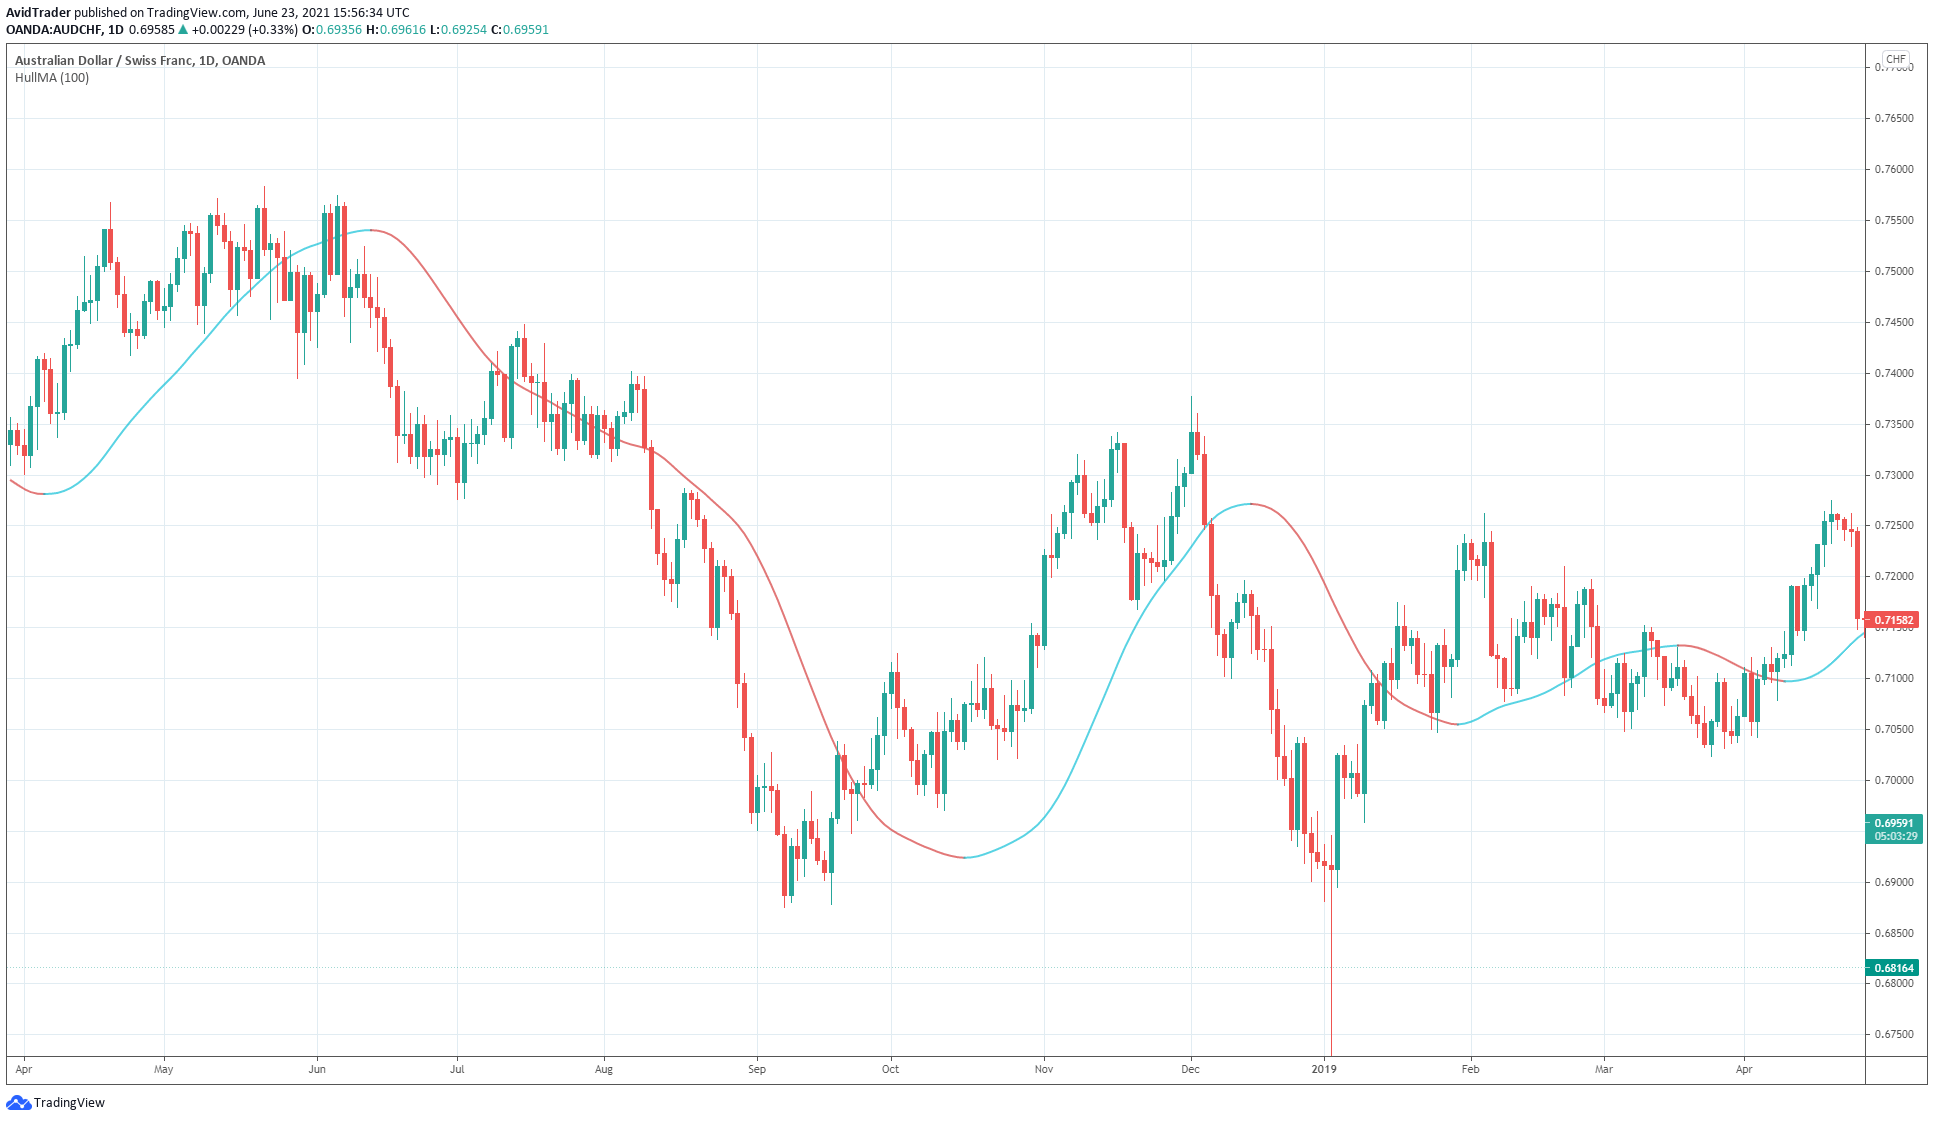
One advantage of HMA over other alternatives is color-coding:
- Usually, when the market is trending upward, HMA slopes upward and comes in blue color.
- When the market is trending down, HMA slopes downward and comes in red.
Naturally, the slope of a moving average defines the trend of a market.
However, there are times when the slope is not easy to recognize. This often occurs in ranging market conditions or when the price is changing the trend. To address this issue, Alan Hull applied color-coding to HMA according to its angle of inclination.
Now you can easily perceive the movement at a glance. Check the above AUD/CHF daily chart and see for yourself.
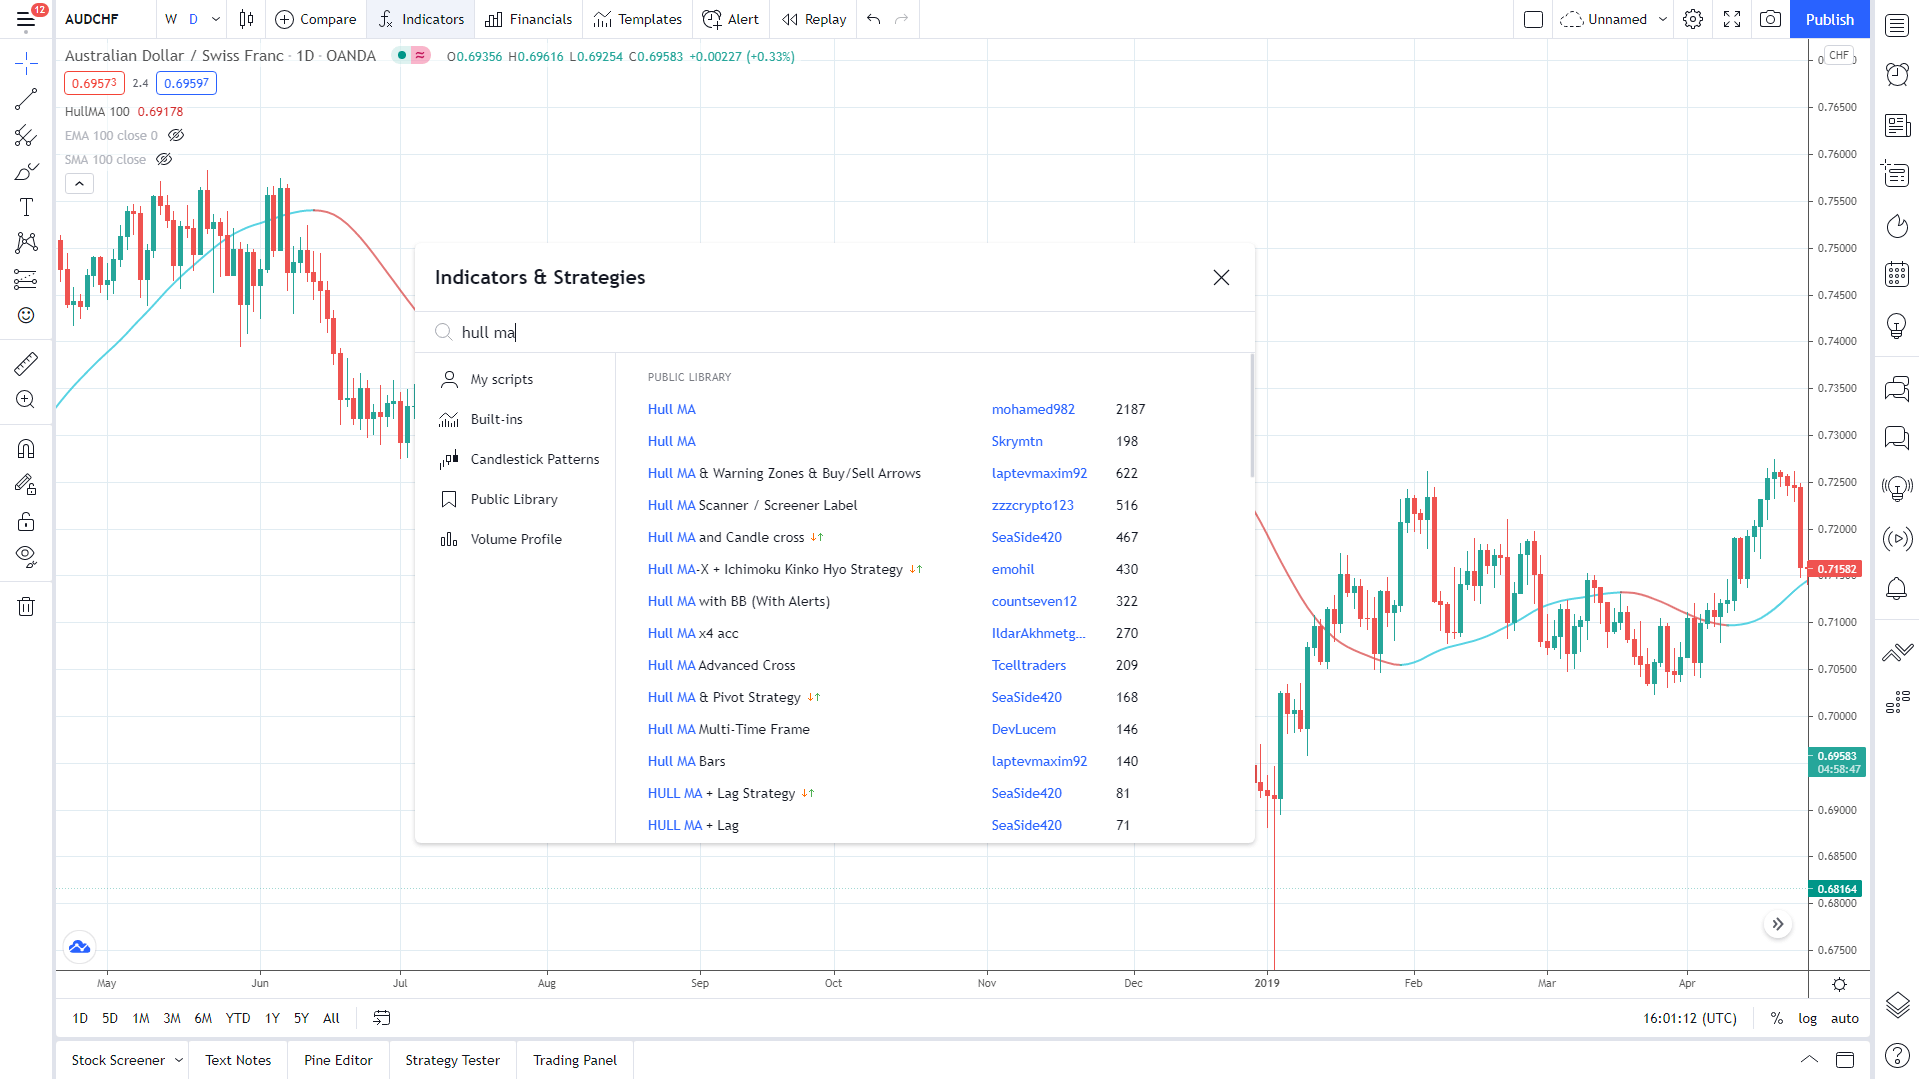
If you are using TradingView in your market analysis, here is a tip for you.
- To use the color-coded HMA, do not use the default indicator.
- To plot the correct HMA, click the indicators menu and type “Hull MA” in the search field.
- Then select the item that comes with the name mohamed982.
- If you do, you will get an HMA similar to that used in the above chart.
What HMA period to use?
As with SMA and EMA, you can adjust the period of HMA. Doing this affects how far back in history HMA checks when computing values and then displaying the result as a line. Choosing a short period for HMA makes the line touch price very frequently. This makes the HMA provide a signal with a concise duration. In a ranging market, the call can change very rapidly. Anyway, you should have known at this point that any type of moving average is not helpful in a range-bound market.
If you are wondering which period to choose for your strategy, here is the answer. You have to curve fit HMA to suit your trading system. You might get the best period that works in all symbols by doing manual testing. Through trial and error, you can find the setting that leads to a smooth HMA that interacts better with the price.
How to use HMA in trading?
You can use a combination of HMA with different periods as an entry strategy. One HMA has a more extended period, while the other HMA has a shorter period. Use the long-period HMA to determine the trend.
- If HMA is going up, it means the dominant trend is bullish. Therefore, you should look to buy trades.
- If HMA is going down, it suggests the prevailing trend is bearish. In this case, look for sell trades.
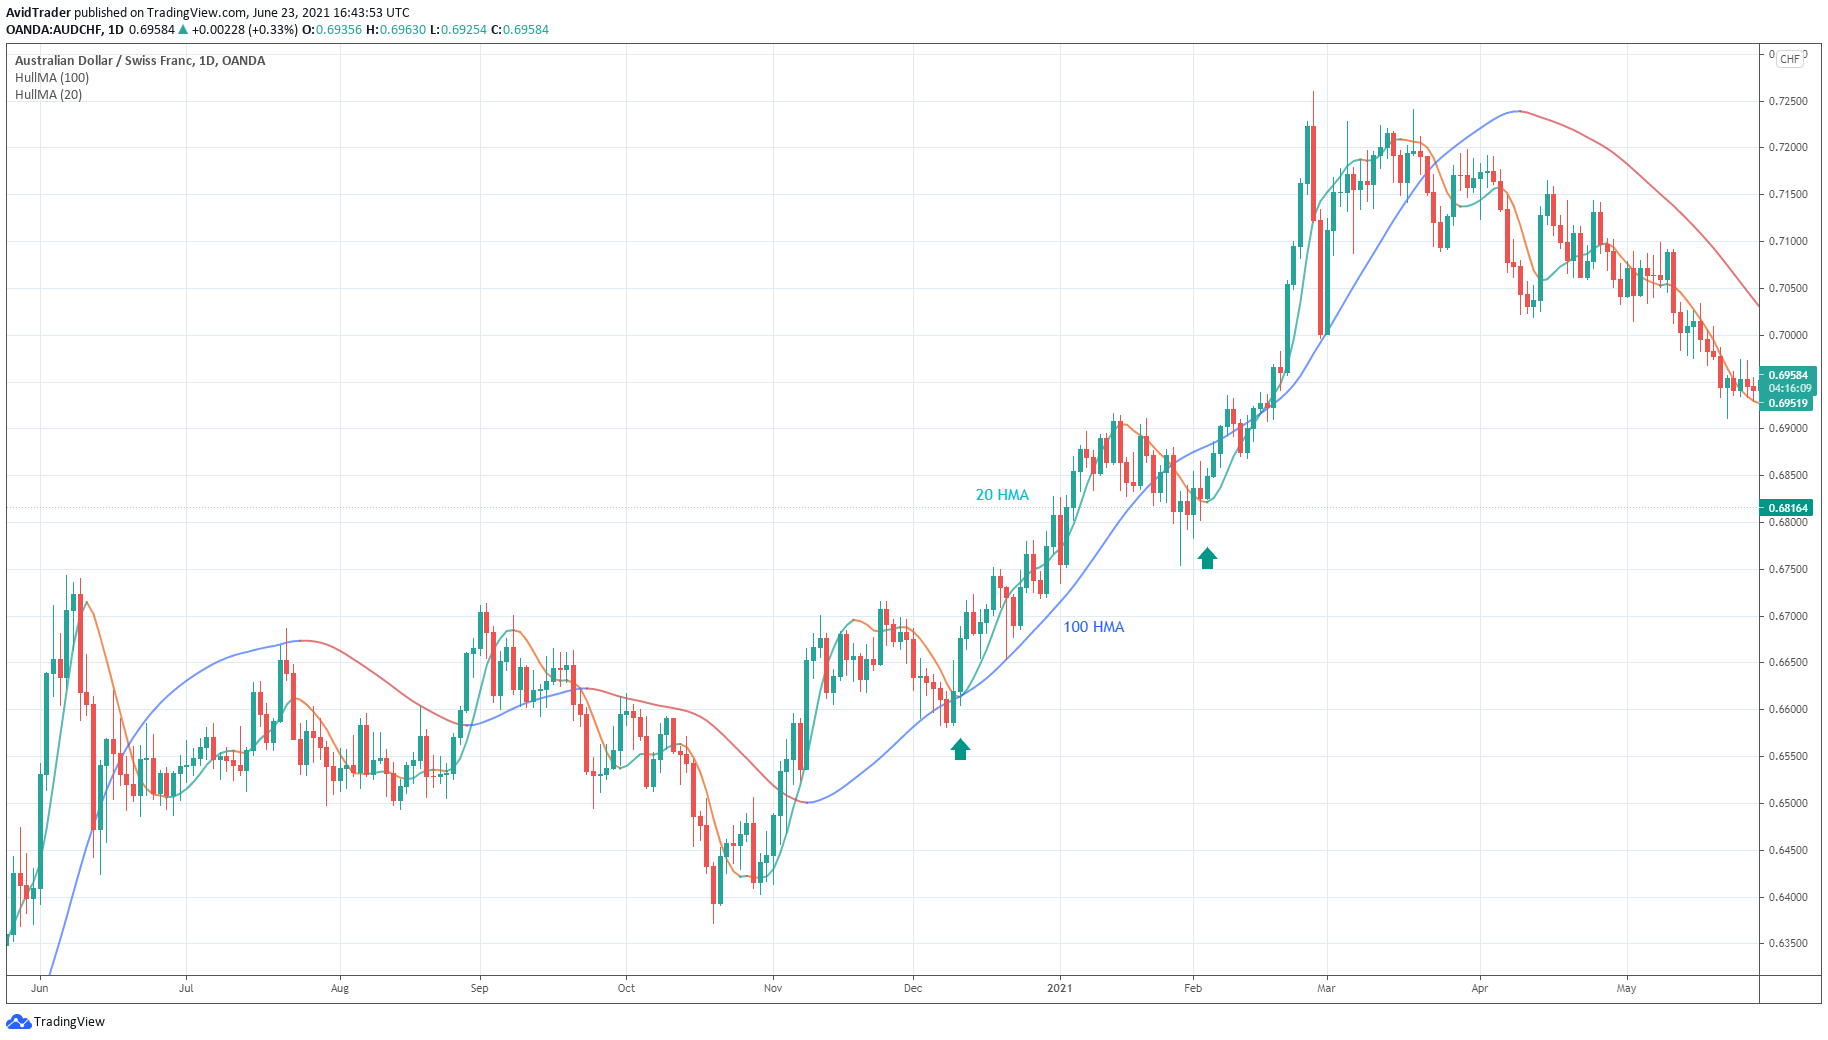
On the other hand, you can use the short-period HMA as an entry signal to take advantage of the dominant trend. To time the entry, you can wait for a pullback. Refer to the above chart.
- It shows 20 HMA, and 100 HMA plotted on the chart.
- You can open a trade when both HMAs have the same color.
- In the example above, you have two buy opportunities (marked with up arrows), which happens when 20 HMA turns green, and 100 HMA turns blue.
Final thoughts
As presented in this article, HMA is a fantastic MA. Due to its quick reaction, it can give you entries early into the trend. Also, HMA can alert you to exit the trade sooner than later. There is only a downside to this MA. That is, the line tends to overshoot when the trend changes. Regardless, this is not much of a drawback to ponder. Just be aware of this minor drawback.


Comments