
Reward ratio is an important term in the world of financial trading. Any investors need to find out the reward or return on investment within a specific period from the capital. Defining reward ratio is a crucial element to creating a complete trading strategy.
However, the risk ratio depends on trading methods besides the winning rate to determine traders’ payout. Novice traders often ignore this fact, which leads them to indiscipline trade execution and lose money.
Let’s discuss risk-reward on trading. Moreover, we describe trading strategies with chart attachments.
What is the high-risk, low reward?
In the forex market, risk-reward is a metric that traders calculate how much profit/reward they will get by risking how much money they make from the trade. Traders usually take a risk ratio of 1:2-1:3 risk ratio when executing trades or making trade decisions. You can calculate the difference between the executing order, stop loss, and profit target in forex trading.
Risk-reward concept
For example, you may risk 15$ in a trade, so if your stop loss gets to hit, you will lose that 15$. Meanwhile, the profit target you set may give you 30$. Here your risk-reward coefficient is 2, as 30/15 is 2. So the risk ratio of this order you execute is 1:2. The success rate is another important factor when you calculate risk-reward.
The equation of success rate is
P = (1+(X/Y)) x Z – 1
Where:
P is the success rate
X is the average payout size
Y is the average loss size
Z is the payout rate
Elaborating on this equation will give you the idea that your risk-reward may be high, but your winning rate is more excellent, maybe 85% or more, then this low risk-reward can be successful in the long run. Successful traders always try to make trades with low-risk high rewards to keep capital safe by applying many trade and money management ideas.
How to trade using risk reward?
When executing trades, the risk-reward calculation is a mandatory factor besides learning the trade durations. Without calculating it, you cannot have a complete trading method or discipline in executing trades.
Defining risk-reward depends on several factors, such as risk appetite, stop loss, profit target, position size, controlling emotions, leverage, etc.
Working on these fundamental facts will help you catch trades with more potentiality or low-risk, high-reward trading positions. Trading methods enable market participants to control risk rewards on trading.
For example, swing traders may be involved in trading with 1:3 risk ratios, whereas a day trader may make trades with 1:2 risk ratios. It is an initial fact to execute any trade; you can modify your trades after execution by supporting trade management ideas according to your trading techniques.
A short-term trading method
Our short-term trading method involves using support resistance besides a popular technical indicator, the parabolic SAR. It defines trends by dots on different price candle prices and identifies swing or fractal points by switching positions. This indicator creates dots below the price candle after a valid swing low takes place and a series of dots until the bullish trend remains intact and vice versa for a bearish trend.
This strategy suits any trading asset with sufficient volatility. We recommend using a 15-min or above chart to get good short-term trading positions. We prioritize monthly, weekly, daily, high-low-open-closing as necessary besides historical, price action, etc., support resistance levels. You can catch trades with 1:2-1:4 or more risk ratios through this trading strategy.
Bullish trade scenario
First, mark crucial levels from higher time frame charts. When price comes near any support level, observe the price movement. If it stops declining, then check:
- The price reaches near any support level and starts to bounce back on the upside.
- The parabolic dot takes place below price candles.
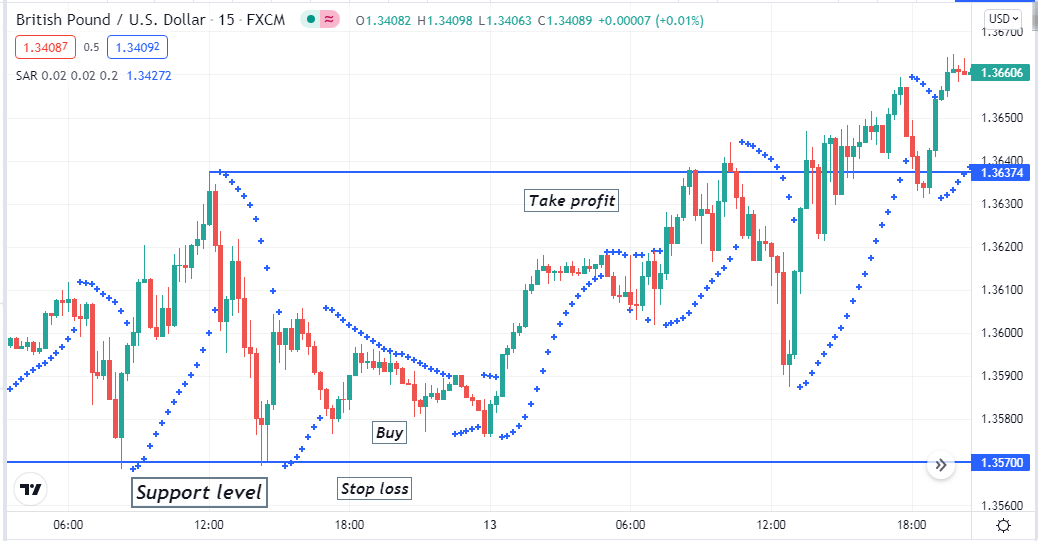
Bullish setup
Entry
When these conditions above match with your target asset chart, place a buy order.
Stop loss
The initial stop loss level will be below the current support level and swing low.
Take profit
The profit target will be below the recent next resistance level or close manually when Parabolic SAR dots take place above price candles.
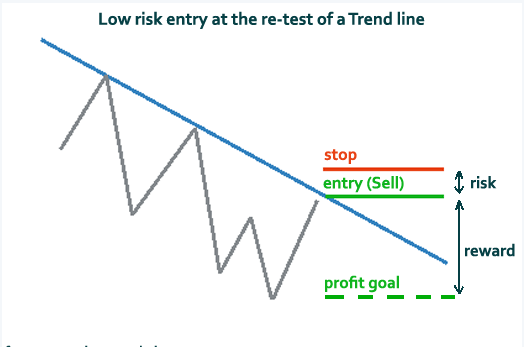
Bearish trade scenario
First, mark crucial levels from higher time frame charts. When price comes near any resistance level, observe the price movement. If it stops increasing, then check:
- The price reaches near any resistance level and starts to bounce back on the downside.
- The parabolic dot takes place above price candles.
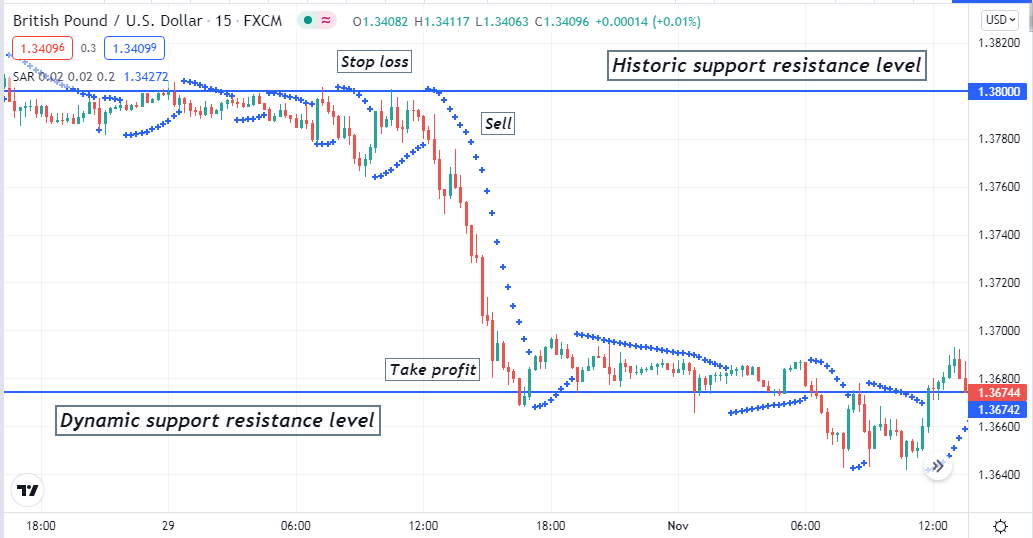
Bearish setup
Entry
When these conditions above match with your target asset chart, place a sell order.
Stop loss
The initial stop loss level will be above the current resistance level and swing high.
Take profit
The profit target will be above the recent next support level or close manually when Parabolic SAR dots take place below price candles.
A long-term trading strategy
Our long-term trading strategy involves using two popular momentum indicators, the MACD and the ADX. This strategy suits any trading assets on many timeframes. We recommend using at least n H4 or above charts to catch potential long-term trading positions. This strategy will allow you to acquire trades with 1:3 or above risk-reward trading positions.
Bullish trade scenario
After applying both indicators on your target asset chart, check when:
- The MACD dynamic blue line crosses the dynamic red line on the upside.
- MACD green histogram bars take place above the central line.
- The ADX value is above 20.
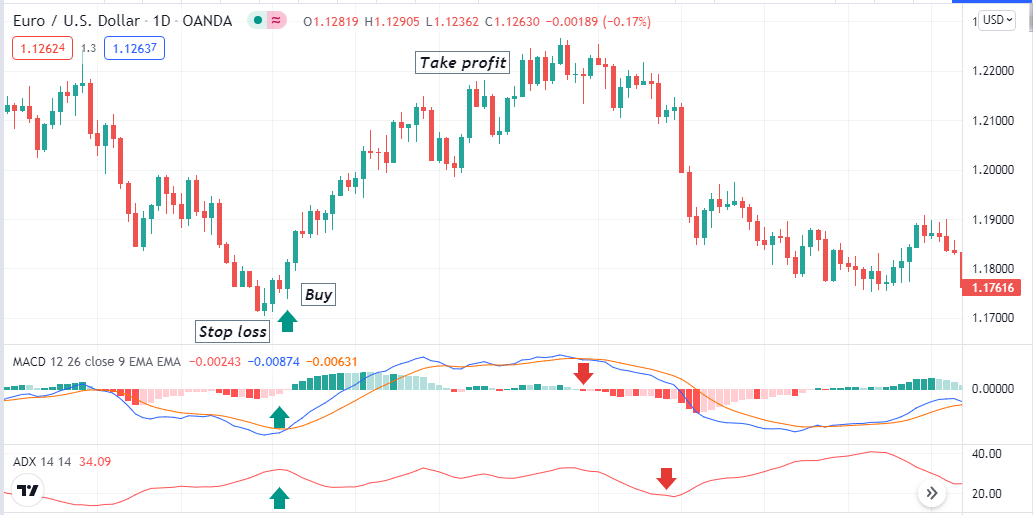
Bullish setup
Entry
When these conditions above match with your target asset chart, place a buy order.
Stop loss
Place an initial stop loss below the current swing low.
Take profit
Close the buy order when:
- The dynamic blue line crosses below the dynamic red line on the MACD indicator window.
- MACD red histogram bars appear below the central line.
- The ADX value drops below 20.
Bearish trade scenario
After applying both indicators on your target asset chart, check when:
- The MACD dynamic blue line crosses the dynamic red line on the downside.
- MACD red histogram bars take place below the central line.
- The ADX value is above 20.
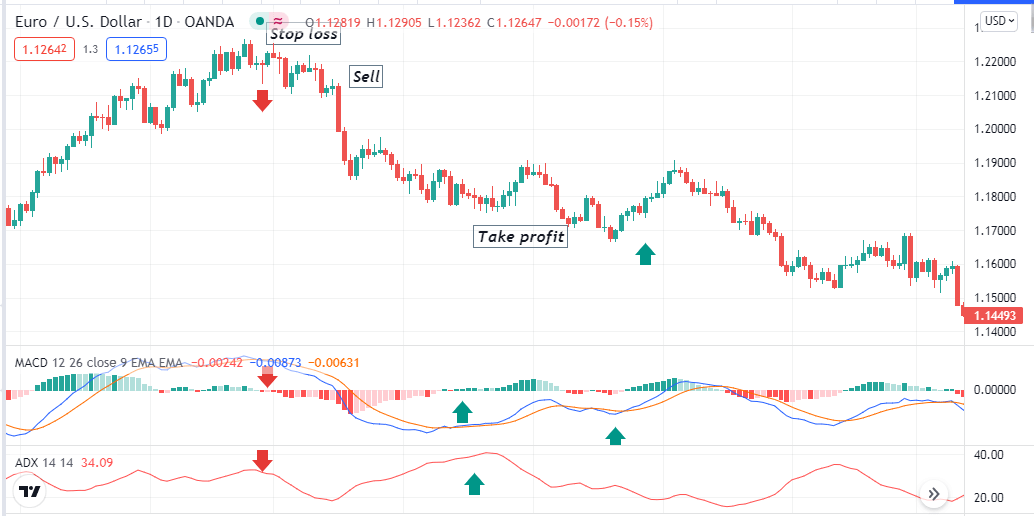
Bearish setup
Entry
When these conditions above match with your target asset chart, place a sell order.
Stop loss
Place an initial stop loss above the current swing high.
Take profit
Close the sell order when:
- The dynamic blue line crosses above the dynamic red line on the MACD indicator window.
- MACD green histogram bars appear above the central line.
- The ADX value drops below 20.
Pros and cons
| 👍 Pros | 👎 Cons |
|
|
|
|
|
|
Final thought
Finally, the risk-reward concept is a vital factor to any trader when executing or making trade decisions. You can reduce risks by performing many trade management ideas after executing trades. We suggest following potential trading strategies with good risk ratios of at least 1:2 or more to be a successful trader. Otherwise, high-risk, low reward strategies also can work if you have a winning rate of more than 85% trades.


Comments