
Chart analysis is the best way to achieve the goal of being a successful forex trader. Mark out specific patterns will enable you to make precise trading positions with greater profits and decreasing risks. For instance, price action traders are smart traders that seek trading positions depending on price formations and patterns besides using technical and fundamental info.
However, each pattern generates trading signals depending on formations, so all patterns’ functionality is not the same. This article contains a cheat sheet of forex patterns, introducing you to many common financial market patterns besides bullish and bearish trading strategies with chart attachments.
What is a forex pattern cheat sheet?
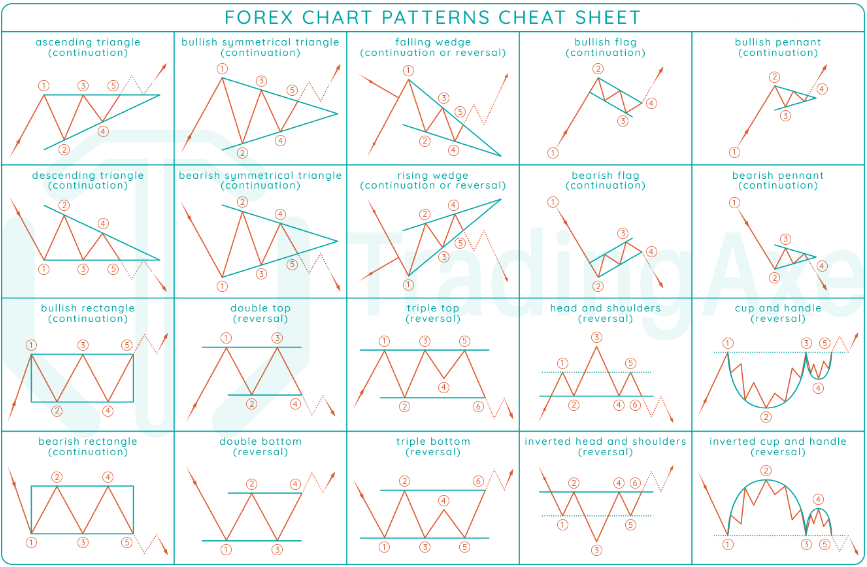
It can be tricky to make continuous profits from the financial market. Identifying several patterns and functionalities will enable you to determine more precious entry/exit for trading positions. This forex pattern cheat sheet contains twenty different typical chart patterns in the financial asset charts.
Various patterns
Now it comes to the functionality and trading ideas. These are the twenty most standard, familiar, and functional patterns that often take place in charts of the forex market. We are attaching a chart of the functionality and characteristics of these chart patterns for a better understanding.
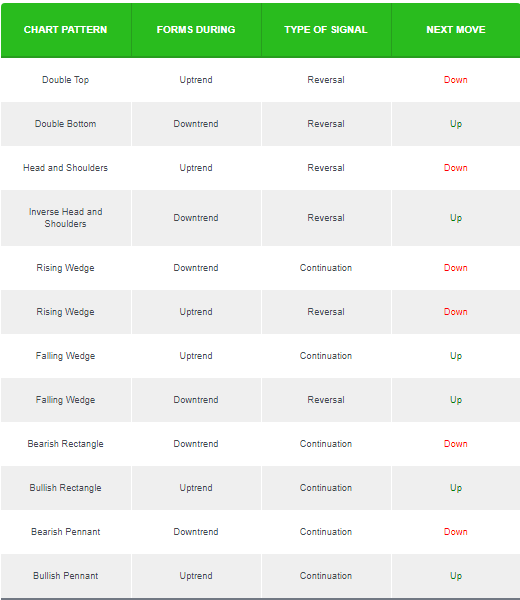
Characteristics of chart patterns
Now match the pattern information with the pattern formation to be clear about the concepts of each pattern. Now we are explaining some of the most common patterns below.
Head and shoulders
This pattern has three peaks and a neckline. The peak on the middle is the top, the head; meanwhile, the other two peaks or shoulders sizes are the same. Usually, it takes place at the finish line of an uptrend signaling a declining pressure to come.
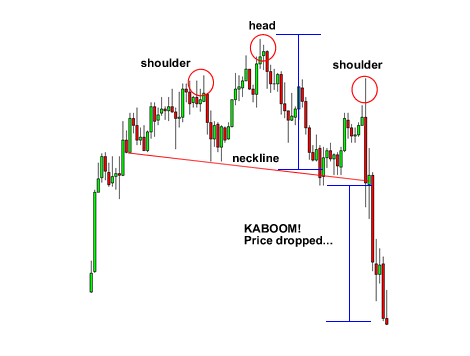
H&S
Inverse head and shoulders
It is the exact opposite formation with the H&S.
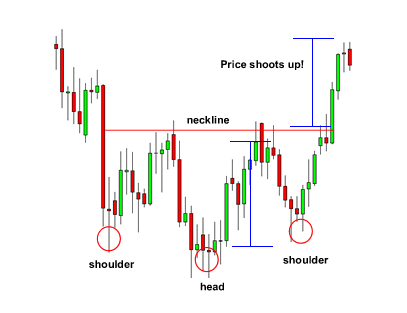
Inverse H&S
You may simultaneously enter buy/sell trades with profit targets from the top peak/bottom to the neckline when the neckline breaks.
Double top and double bottom
These patterns have either two peaks or two bottoms with a neckline. Both peaks/bottoms have the same distance from the neckline. Entry suggestions at the neckline breaking whereas profit target will be the exact distance between the neckline and peak/bottom.
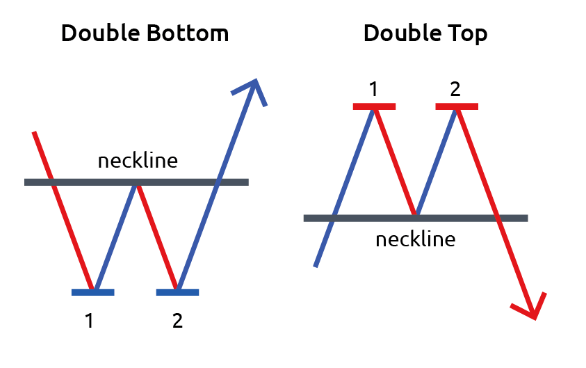
Double top and bottom
Many more patterns, such as butterfly pattern, cup and handle pattern, pennant pattern, engulfing pattern, rising and falling wages, rounding top, etc., are popular and preferable patterns that suggest almost complete trading positions.
Bull and bear flag
Flag patterns are another typical pattern that occurs during a bullish or bearish trend, signaling a trend continuation. Bullish flags take place at the bullish trends, while bearish flags take place at the bearish trends.
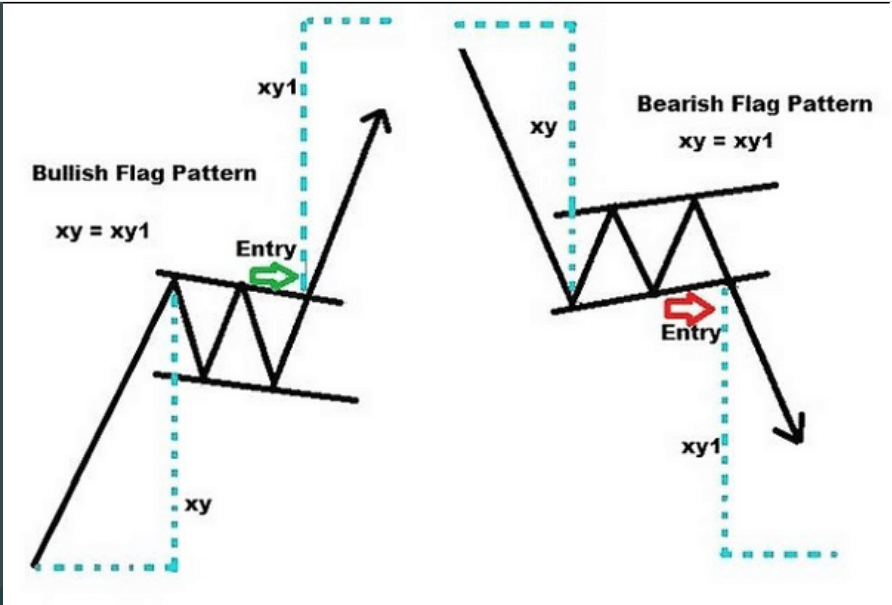
Flag patterns
These patterns signal a continuation of the price movement when the price breaks above/below flags. Meanwhile, the profit target is at the same distance as the flag pole.
Triangle patterns
These patterns often occur at financial asset price charts.
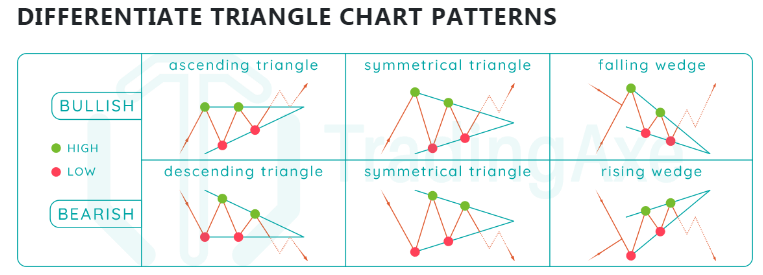
Triangle patterns
All these patterns declare that the price may continue in the same direction. The price crosses a range of triangles to enable opportunities for traders to make precious trading positions.
How to trade with forex chart patterns
You can use these patterns of cheat sheets to identify the market context of almost any financial asset, including commodities, stocks, indexes, currency pairs, etc. You can make trades using these patterns individually, as every pattern suggests specific entry/exit levels.
It is a common practice among financial traders that they often combine these patterns with other technical tools or indicators to determine trading positions. For example, when you make trades by looking at any flag pattern, you will make an entry when the price breaks above or below the range of the flag. Meanwhile, your profit target will be in the same range as the flagpole.
You can find many patterns such as rectangle, triangle, pennant, etc., patterns that signal a continuation of the current trend. Meanwhile, head and shoulder, double top, double bottom, etc., signals an upcoming reversal on the price movement.
A short-term trading strategy
Our short-term strategy involves using the volume indicator beside flag patterns to seek potentially profitable trading positions. This trading method works fine on any time frame chart. We recommend using H1 charts for good entry positions for short-term trading. Meanwhile, confirm the current trend from the H4 or D1 charts.
Bullish scenario
Open your platform and check:
- The current trend is bullish from the H4 or D1 chart.
- Seek and identify the bullish flag on the H1 chart of your target asset.
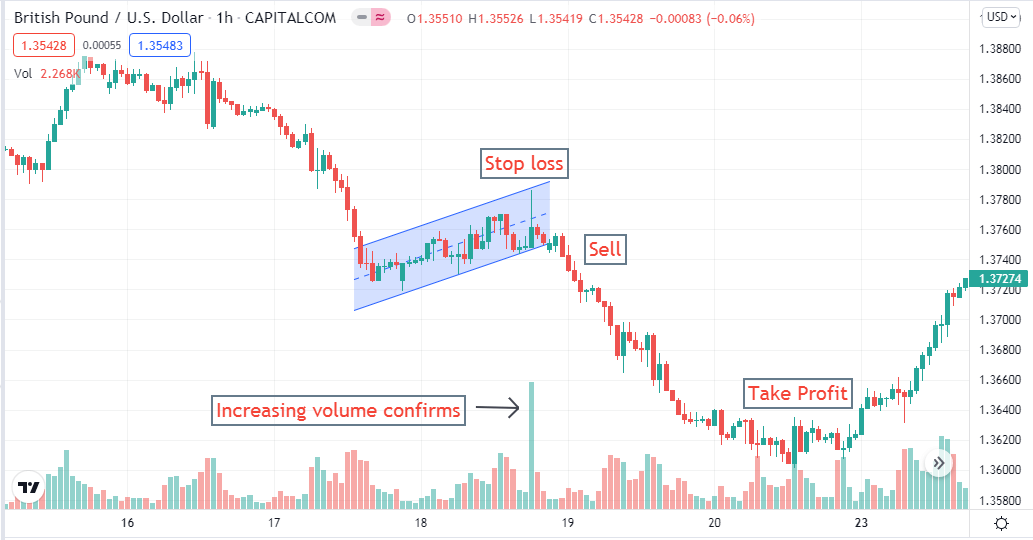
- Price breaks above the flag range check the volume indicator.
- Volume indicator confirms sufficient participants.
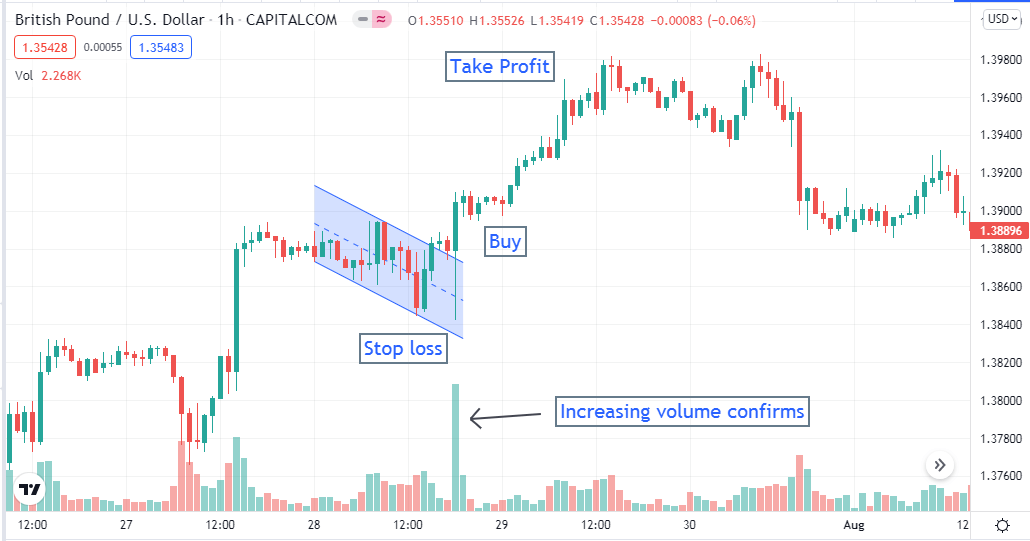
Bullish setup
When these conditions above are true, place a buy order at the current price. The stop loss level of your buy order will be below the flag range, and the profit target will be the same distance above the flag as the flagpole.
Bearish scenario
Open your platform and check:
- The current trend is bearish from the H4 or D1 chart.
- Seek and identify the bearish flag on the H1 chart of your target asset.
- Price breaks below the flag range check the volume indicator.
- Volume indicator confirms sufficient participants.
Bearish setup
When these conditions above are true, place a sell order at the current price. The stop loss level of your sell order will be above the flag range, and the profit target will be the same distance below the flag as the flagpole.
A long-term strategy
Our long-term strategy involves using triangle patterns at the daily chart of any currency pair. Confirm the trend from the weekly or monthly chart and seek trading positions on the daily chart.
Bullish scenario
Bullish trading steps are:
- Price at a bullish trend on the weekly or monthly chart.
- Mark the bullish triangle when the price consolidates.
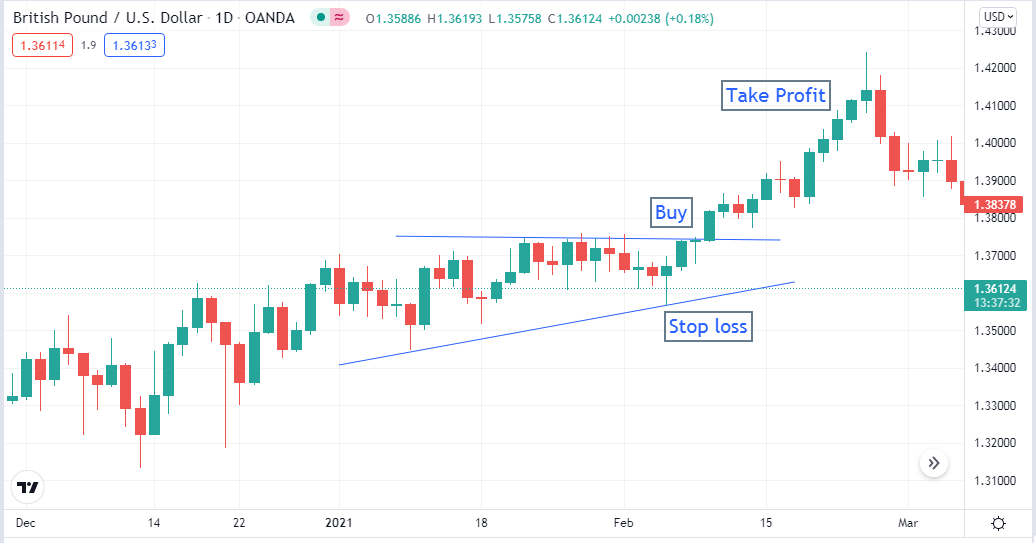
Bullish setup
When the price goes above the triangle, place a buy order. The stop loss will be below the triangle range, and the profit target will be above the same distance as the triangle size.
Bearish scenario
Bearish trading steps are:
- Price at a bearish trend on the weekly or monthly chart.
- Mark the bearish triangle when the price consolidates.
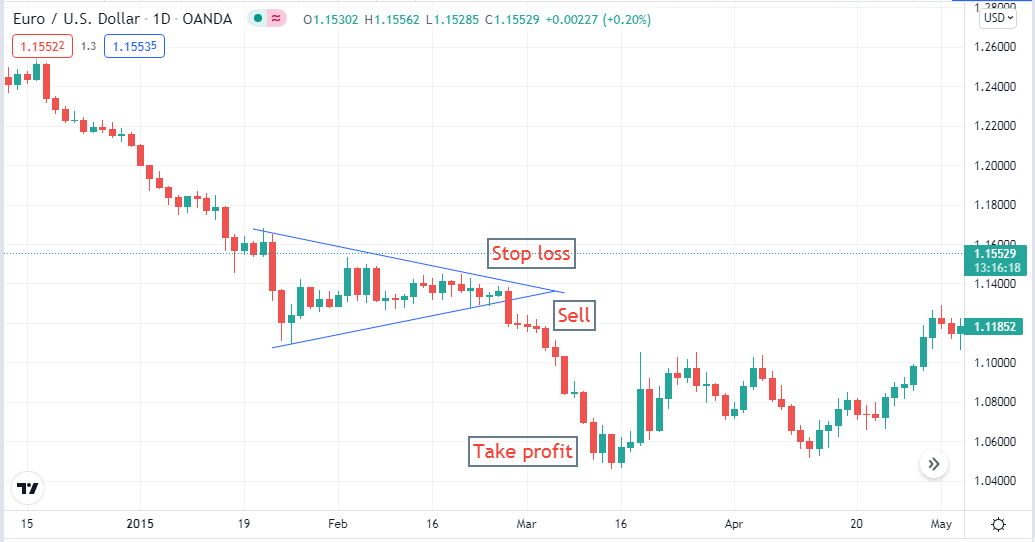
Bearish setup
When the price goes below the triangle, place a sell order. The stop loss will be above the triangle range, and the profit target will be below the same distance as the triangle size.
Pros and cons
| Pros | Cons |
|
|
|
|
|
|
Final thought
Finally, this article introduces you to many standard patterns that work fine on any financial asset chart besides the FX market. These patterns can help you to obtain thousands of pips using these patterns. We suggest mastering these patterns by identifying, observing, and making trades at demo trading using these patterns before applying them on live trading.


Comments